Explore
 Validate
 Learn
Learn Western blot
 ELISA
ELISA Immunocytochemistry
Antibody data
- Antibody Data
- Antigen structure
- References [0]
- Comments [0]
- Validations
- Immunocytochemistry [7]
- Immunohistochemistry [3]
- Other assay [62]
Submit
Validation data
Reference
Comment
Report error
- Product number
- MA1-744 - Provider product page

- Provider
- Invitrogen Antibodies
- Product name
- Actin Monoclonal Antibody (mAbGEa)
- Antibody type
- Monoclonal
- Antigen
- Purifed from natural sources
- Description
- MA1-744 detects actin protein in human, mouse, rat, bovine, sheep, drosophila, zebra fish (Danio rerio), yeast, arabidopsis and xenopus samples. This antibody has shown cross-reactivity with actin 1, 2, 3, 4, 7, 8, 11 and 12. MA1-744 has successfully been used in Western blot and ELISA procedures. By Western blot, this antibody detects a 45 kDa protein representing actin. The MA1-744 immunogen is purified actin protein from Arabidopsis.
- Reactivity
- Human, Mouse, Rat, Bovine, Drosophila, Xenopus, Yeast, Zebrafish
- Host
- Mouse
- Isotype
- IgG
- Antibody clone number
- mAbGEa
- Vial size
- 100 μL
- Concentration
- Conc. Not Determined
- Storage
- -20°C, Avoid Freeze/Thaw Cycles
No comments: Submit comment
Supportive validation
- Submitted by
- Invitrogen Antibodies (provider)
- Main image
- Experimental details
- Immunofluorescent analysis of Actin using Anti-Actin Monoclonal Antibody (mAbGEa) (Product # MA1-744) shows staining in A375 Cells. Actin staining (green), F-Actin staining with Phalloidin (red) and nuclei with DAPI (blue) is shown. Cells were grown on chamber slides and fixed with formaldehyde prior to staining. Cells were probed without (control) or with or an antibody recognizing Actin (Product # MA1-744) at a dilution of 1:20 over night at 4°C, washed with PBS and incubated with a DyLight-488 conjugated secondary antibody (Product # 35503, Goat Anti-Mouse). Images were taken at 60X magnification.

- Submitted by
- Invitrogen Antibodies (provider)
- Main image

- Experimental details
- Immunofluorescent analysis of Actin using Anti-Actin Monoclonal Antibody (mAbGEa) (Product # MA1-744) shows staining in Hela Cells. Actin staining (green), F-Actin staining with Phalloidin (red) and nuclei with DAPI (blue) is shown. Cells were grown on chamber slides and fixed with formaldehyde prior to staining. Cells were probed without (control) or with or an antibody recognizing Actin (Product # MA1-744) at a dilution of 1:20 over night at 4°C, washed with PBS and incubated with a DyLight-488 conjugated secondary antibody (Product # 35503, Goat Anti-Mouse). Images were taken at 60X magnification.

- Submitted by
- Invitrogen Antibodies (provider)
- Main image
- Experimental details
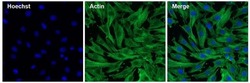
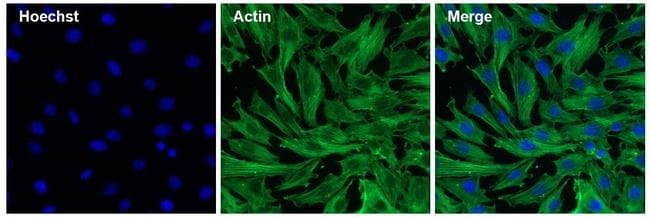
- Immunofluorescent analysis of Actin (green) in 3T3 cells. The cells were permeabilized with 0.1% Triton X-100 in TBS for 15 minutes, and blocked with 3% Blocker BSA in PBS (Product # 37525) for 15 minutes at room temperature. Cells were stained with an Actin mouse monoclonal antibody (Product # MA1-744), at a dilution of 1:100 in blocking buffer for at least 1 hour at room temperature, and then incubated with a Goat anti-Mouse IgG Superclonal secondary antibody, Alexa Fluor 488 conjugate (Product # A28175) at a dilution of 1:1000 for 30 minutes at room temperature (green). Nuclei (blue) were stained with Hoechst 33342 dye (Product # 62249). Images were taken on a Thermo Scientific ToxInsight Instrument at 20X magnification.
- Submitted by
- Invitrogen Antibodies (provider)
- Main image
- Experimental details
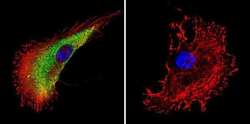
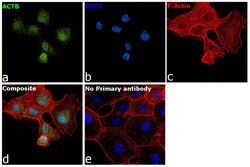
- Immunofluorescence analysis of Actin, cytoplasmic 1 was performed using 70% confluent log phase DU 145 cells. The cells were fixed with 4% paraformaldehyde for 5 minutes, permeabilized with 0.1% Triton™ X-100 for 10 minutes, and blocked with 2% BSA for 45 minutes at room temperature. The cells were labeled with Actin Monoclonal Antibody (mAbGEa) (Product # MA1-744) at 1:100 dilution in 0.1% BSA, incubated at 4 degree celsius overnight and then labeled with Donkey anti-Mouse IgG (H+L) Highly Cross-Adsorbed Secondary Antibody, Alexa Fluor Plus 647 (Product # A32787), (1:2000 dilution), for 45 minutes at room temperature (Panel a: Green). Nuclei (Panel b:Blue) were stained with ProLong™ Diamond Antifade Mountant with DAPI (Product # P36962). F-actin (Panel c: Red) was stained with Rhodamine Phalloidin (Product # R415, 1:300). Panel d represents the merged image showing Nucleus and cytoplasm localization. Panel e represents control cells with no primary antibody to assess background. The images were captured at 60x magnification.

- Submitted by
- Invitrogen Antibodies (provider)
- Main image

- Experimental details
- Immunofluorescent analysis of Actin using Anti-Actin Monoclonal Antibody (mAbGEa) (Product # MA1-744) shows staining in A375 Cells. Actin staining (green), F-Actin staining with Phalloidin (red) and nuclei with DAPI (blue) is shown. Cells were grown on chamber slides and fixed with formaldehyde prior to staining. Cells were probed without (control) or with or an antibody recognizing Actin (Product # MA1-744) at a dilution of 1:20 over night at 4°C, washed with PBS and incubated with a DyLight-488 conjugated secondary antibody (Product # 35503, Goat Anti-Mouse). Images were taken at 60X magnification.

- Submitted by
- Invitrogen Antibodies (provider)
- Main image

- Experimental details
- Immunofluorescent analysis of Actin (green) in 3T3 cells. The cells were permeabilized with 0.1% Triton X-100 in TBS for 15 minutes, and blocked with 3% Blocker BSA in PBS (Product # 37525) for 15 minutes at room temperature. Cells were stained with an Actin mouse monoclonal antibody (Product # MA1-744), at a dilution of 1:100 in blocking buffer for at least 1 hour at room temperature, and then incubated with a Goat anti-Mouse IgG Superclonal secondary antibody, Alexa Fluor 488 conjugate (Product # A28175) at a dilution of 1:1000 for 30 minutes at room temperature (green). Nuclei (blue) were stained with Hoechst 33342 dye (Product # 62249). Images were taken on a Thermo Scientific ToxInsight Instrument at 20X magnification.

- Submitted by
- Invitrogen Antibodies (provider)
- Main image

- Experimental details
- Immunofluorescence analysis of Actin, cytoplasmic 1 was performed using 70% confluent log phase DU 145 cells. The cells were fixed with 4% paraformaldehyde for 5 minutes, permeabilized with 0.1% Triton™ X-100 for 10 minutes, and blocked with 2% BSA for 45 minutes at room temperature. The cells were labeled with Actin Monoclonal Antibody (mAbGEa) (Product # MA1-744) at 1:100 dilution in 0.1% BSA, incubated at 4 degree celsius overnight and then labeled with Donkey anti-Mouse IgG (H+L) Highly Cross-Adsorbed Secondary Antibody, Alexa Fluor Plus 647 (Product # A32787), (1:2000 dilution), for 45 minutes at room temperature (Panel a: Green). Nuclei (Panel b:Blue) were stained with ProLong™ Diamond Antifade Mountant with DAPI (Product # P36962). F-actin (Panel c: Red) was stained with Rhodamine Phalloidin (Product # R415, 1:300). Panel d represents the merged image showing Nucleus and cytoplasm localization. Panel e represents control cells with no primary antibody to assess background. The images were captured at 60x magnification.

Supportive validation
- Submitted by
- Invitrogen Antibodies (provider)
- Main image

- Experimental details
- Immunohistochemistry was performed on cancer biopsies of deparaffinized Human colon carcinoma tissues. To expose target proteins, heat induced antigen retrieval was performed using 10mM sodium citrate (pH6.0) buffer, microwaved for 8-15 minutes. Following antigen retrieval tissues were blocked in 3% BSA-PBS for 30 minutes at room temperature. Tissues were then probed at a dilution of 1:1000 with a mouse monoclonal antibody recognizing Anti-Actin (Product # MA1-744) or without primary antibody (negative control) overnight at 4°C in a humidified chamber. Tissues were washed extensively with PBST and endogenous peroxidase activity was quenched with a peroxidase suppressor. Detection was performed using a biotin-conjugated secondary antibody and SA-HRP, followed by colorimetric detection using DAB. Tissues were counterstained with hematoxylin and prepped for mounting.

- Submitted by
- Invitrogen Antibodies (provider)
- Main image

- Experimental details
- Immunohistochemistry was performed on normal deparaffinized Human tonsil tissue tissues. To expose target proteins, heat induced antigen retrieval was performed using 10mM sodium citrate (pH6.0) buffer, microwaved for 8-15 minutes. Following antigen retrieval tissues were blocked in 3% BSA-PBS for 30 minutes at room temperature. Tissues were then probed at a dilution of 1:1000 with a mouse monoclonal antibody recognizing Anti-Actin (Product # MA1-744) or without primary antibody (negative control) overnight at 4°C in a humidified chamber. Tissues were washed extensively with PBST and endogenous peroxidase activity was quenched with a peroxidase suppressor. Detection was performed using a biotin-conjugated secondary antibody and SA-HRP, followed by colorimetric detection using DAB. Tissues were counterstained with hematoxylin and prepped for mounting.

- Submitted by
- Invitrogen Antibodies (provider)
- Main image

- Experimental details
- Immunohistochemistry was performed on normal deparaffinized Human skeletal muscle tissues. To expose target proteins, heat induced antigen retrieval was performed using 10mM sodium citrate (pH6.0) buffer, microwaved for 8-15 minutes. Following antigen retrieval tissues were blocked in 3% BSA-PBS for 30 minutes at room temperature. Tissues were then probed at a dilution of 1:1000 with a mouse monoclonal antibody recognizing Anti-Actin (Product # MA1-744) or without primary antibody (negative control) overnight at 4°C in a humidified chamber. Tissues were washed extensively with PBST and endogenous peroxidase activity was quenched with a peroxidase suppressor. Detection was performed using a biotin-conjugated secondary antibody and SA-HRP, followed by colorimetric detection using DAB. Tissues were counterstained with hematoxylin and prepped for mounting.

Supportive validation
- Submitted by
- Invitrogen Antibodies (provider)
- Main image
- Experimental details
- NULL

- Submitted by
- Invitrogen Antibodies (provider)
- Main image
- Experimental details
- NULL
- Submitted by
- Invitrogen Antibodies (provider)
- Main image

- Experimental details
- NULL
- Submitted by
- Invitrogen Antibodies (provider)
- Main image
- Experimental details
- NULL
- Submitted by
- Invitrogen Antibodies (provider)
- Main image

- Experimental details
- NULL
- Submitted by
- Invitrogen Antibodies (provider)
- Main image
- Experimental details
- NULL
- Submitted by
- Invitrogen Antibodies (provider)
- Main image
- Experimental details
- NULL
- Submitted by
- Invitrogen Antibodies (provider)
- Main image
- Experimental details
- NULL
- Submitted by
- Invitrogen Antibodies (provider)
- Main image
- Experimental details
- NULL
- Submitted by
- Invitrogen Antibodies (provider)
- Main image
- Experimental details
- NULL
- Submitted by
- Invitrogen Antibodies (provider)
- Main image
- Experimental details
- NULL
- Submitted by
- Invitrogen Antibodies (provider)
- Main image
- Experimental details
- NULL
- Submitted by
- Invitrogen Antibodies (provider)
- Main image
- Experimental details
- NULL
- Submitted by
- Invitrogen Antibodies (provider)
- Main image
- Experimental details
- NULL
- Submitted by
- Invitrogen Antibodies (provider)
- Main image

- Experimental details
- NULL
- Submitted by
- Invitrogen Antibodies (provider)
- Main image
- Experimental details
- NULL
- Submitted by
- Invitrogen Antibodies (provider)
- Main image
- Experimental details
- NULL
- Submitted by
- Invitrogen Antibodies (provider)
- Main image
- Experimental details
- NULL
- Submitted by
- Invitrogen Antibodies (provider)
- Main image
- Experimental details
- NULL

- Submitted by
- Invitrogen Antibodies (provider)
- Main image

- Experimental details
- NULL
- Submitted by
- Invitrogen Antibodies (provider)
- Main image
- Experimental details
- NULL

- Submitted by
- Invitrogen Antibodies (provider)
- Main image
- Experimental details
- NULL

- Submitted by
- Invitrogen Antibodies (provider)
- Main image

- Experimental details
- NULL
- Submitted by
- Invitrogen Antibodies (provider)
- Main image
- Experimental details
- NULL
- Submitted by
- Invitrogen Antibodies (provider)
- Main image
- Experimental details
- NULL

- Submitted by
- Invitrogen Antibodies (provider)
- Main image
- Experimental details
- NULL
- Submitted by
- Invitrogen Antibodies (provider)
- Main image
- Experimental details
- NULL
- Submitted by
- Invitrogen Antibodies (provider)
- Main image
- Experimental details
- NULL
- Submitted by
- Invitrogen Antibodies (provider)
- Main image
- Experimental details
- NULL
- Submitted by
- Invitrogen Antibodies (provider)
- Main image
- Experimental details
- NULL

- Submitted by
- Invitrogen Antibodies (provider)
- Main image
- Experimental details
- NULL
- Submitted by
- Invitrogen Antibodies (provider)
- Main image
- Experimental details
- NULL
- Submitted by
- Invitrogen Antibodies (provider)
- Main image
- Experimental details
- NULL
- Submitted by
- Invitrogen Antibodies (provider)
- Main image
- Experimental details
- NULL
- Submitted by
- Invitrogen Antibodies (provider)
- Main image

- Experimental details
- NULL

- Submitted by
- Invitrogen Antibodies (provider)
- Main image

- Experimental details
- NULL
- Submitted by
- Invitrogen Antibodies (provider)
- Main image
- Experimental details
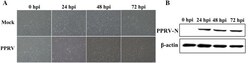
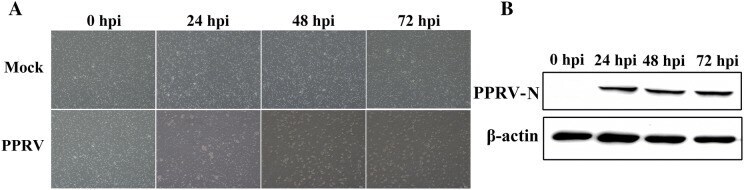
- Figure 1 Characterization of PPRV infection in goat PBMC. A Morphological changes in goat PBMC at different time points after PPRV infection (MOI = 1), with mock-infected cells as a control. B Western blot analysis of N protein in PPRV-infected and mock-infected goat PBMC. Equal amounts of protein from PPRV to mock-infected cells were separated using SDS-PAGE and transferred to PVDF membranes. The membranes were probed with N antibody. beta-actin was used as the internal reference.
- Submitted by
- Invitrogen Antibodies (provider)
- Main image
- Experimental details
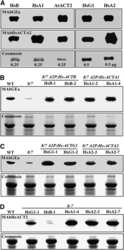
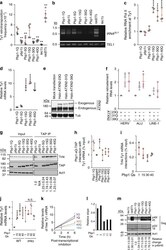
- Fig. 4 Pbp1 polyQ expansions inhibit Ty1 retromobility at the post-translational level. a Effects of Pbp1-polyQ expansion on Ty1his3AI retromobility (Mean +- SD; n = 5 independent cultures; Mann-Whitney U -test). b Semi-quantitative PCR products reflecting Ty1 integration upstream of 12 tRNA GLY loci. TEL1 amplification serves as control. c ChIP examining the localization of RNA Pol II at TyB using an alpha-RNA Pol II (phosphorylated serine 5) antibody (One-way ANOVA and Dunnett's post hoc). d Effects of Pbp1-polyQ expansion on the levels of Ty1 mRNA in RT-qPCR (One-way ANOVA and Dunnett's post hoc). e Confirmation of ATXN2-polyQ expression in transfected HEK293T cells by western blotting. f Effects of ATXN2 polyQ expansion on the levels of retroelement RNAs as detected by RT-qPCR. Values are normalized to GAPDH and statistics are relative to 23Q (Student's t -test). g Pbp1 polyQ forms exhibit an increased interaction with Trf4 ( n = 2). TAP-tagged Pbp1 proteins with indicated glutamine features were subjected to anti-TAP pulldowns followed by immunoblotting for endogenous Trf4, TAP tag or Actin control. h , i Interactions between Pbp1 forms or Trf4 with Ty1 mRNA. Presented are levels of Ty1 mRNA immunoprecipitated relative to input, as detected by RT-qPCR. Values are normalized to pull-down in untagged ( h ) or trf4 cells ( i ). j Effects of Pbp1-polyQ expansion on Ty1 mRNA levels in the presence/absence of TRF4 as detected by RT-qPCR (One
- Submitted by
- Invitrogen Antibodies (provider)
- Main image
- Experimental details
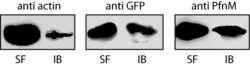
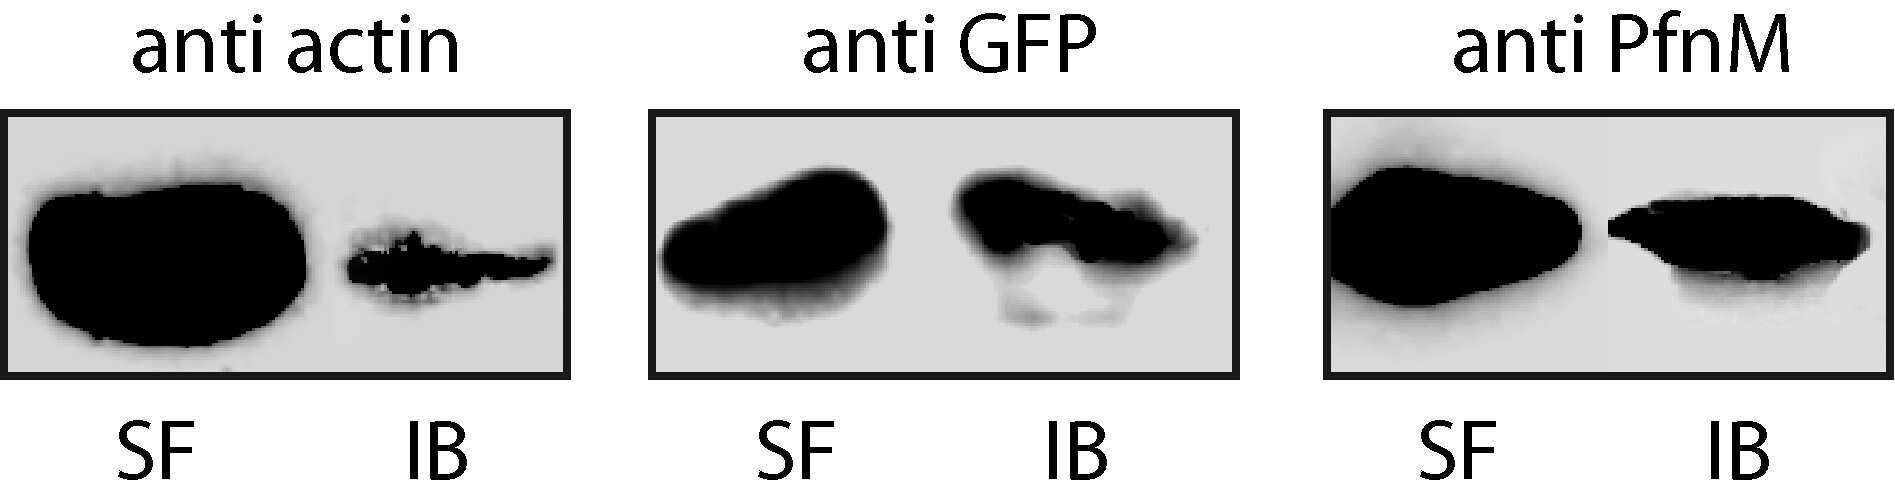
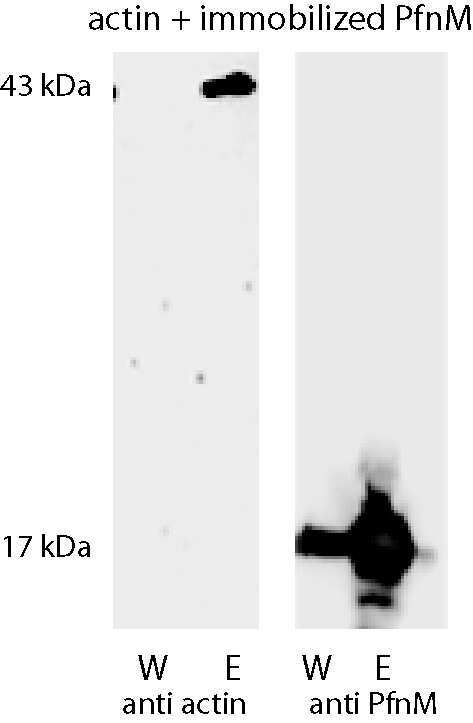
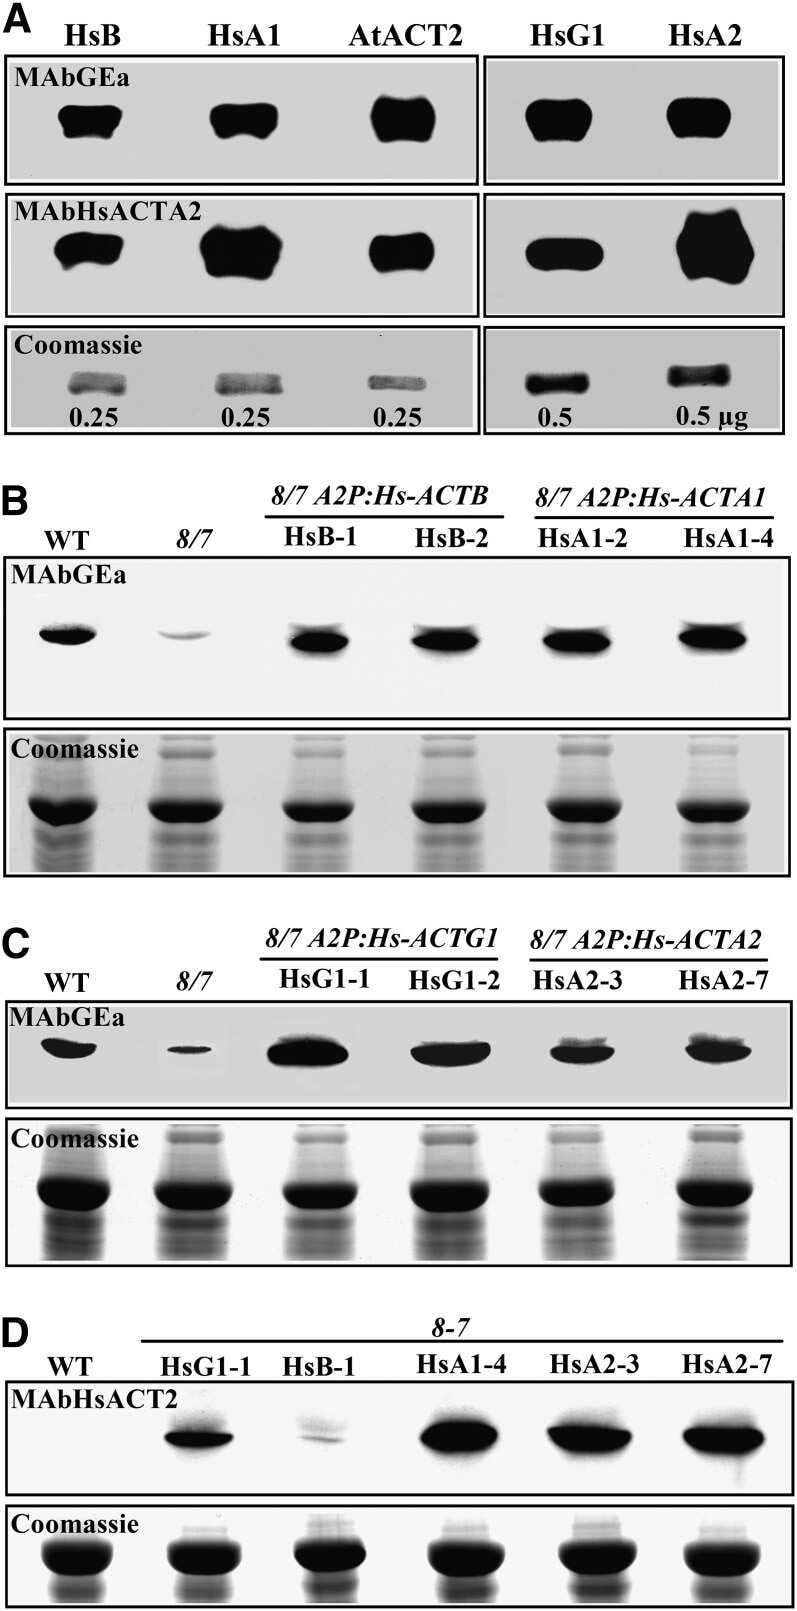
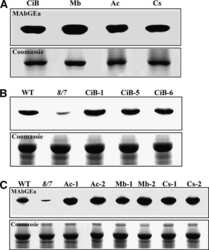
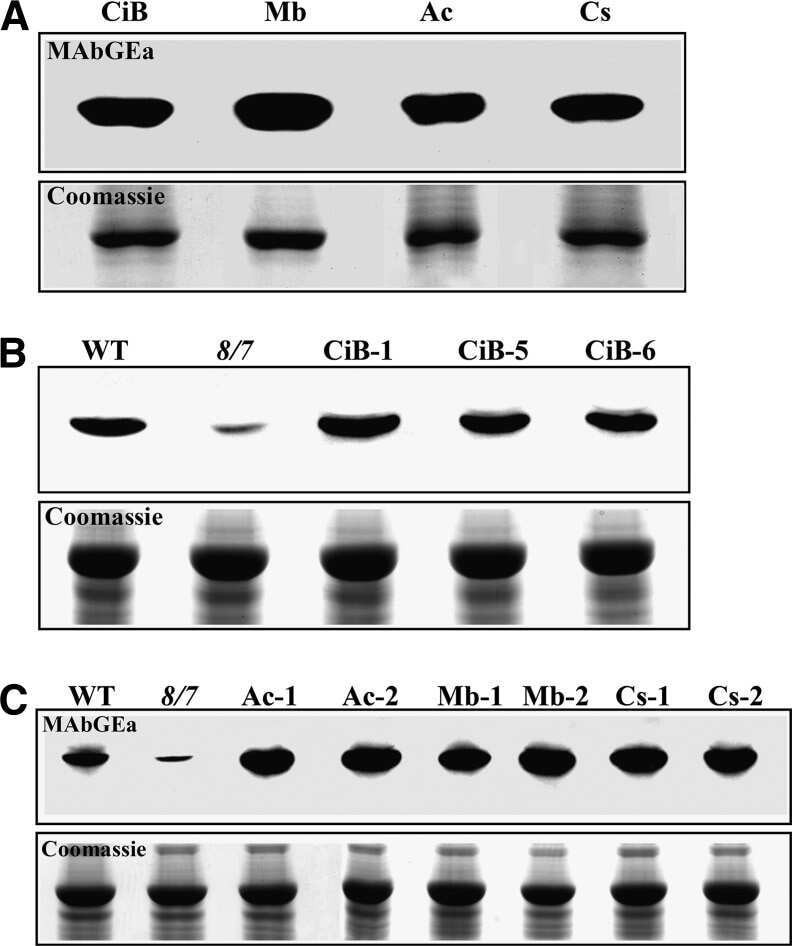
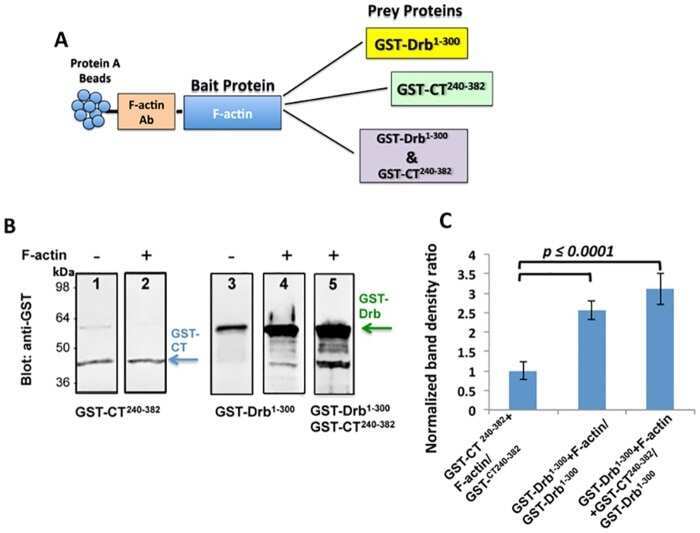
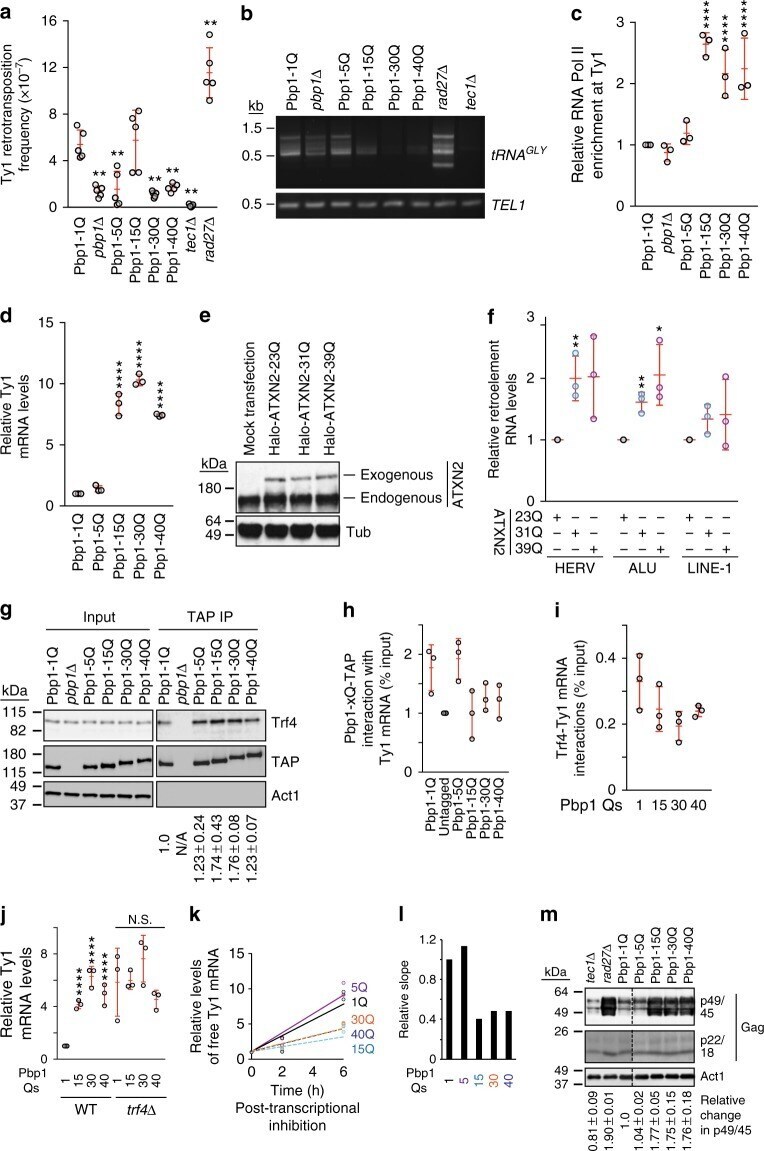
- Figure 4 Binding and co-elution of ActM and PfnM. One potential binding partner was immobilized, the other added in solution. Protein blots and immunodetection of final wash (W) and eluate (E) are shown; employed antibody is indicated at the bottom. Molecular weights are 39 kDa for ActM and 17 kDa for PfnM.

- Submitted by
- Invitrogen Antibodies (provider)
- Main image

- Experimental details
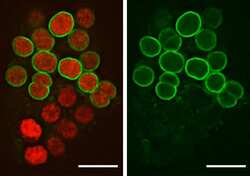
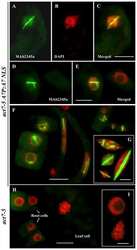
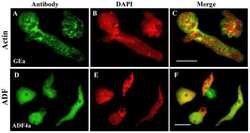
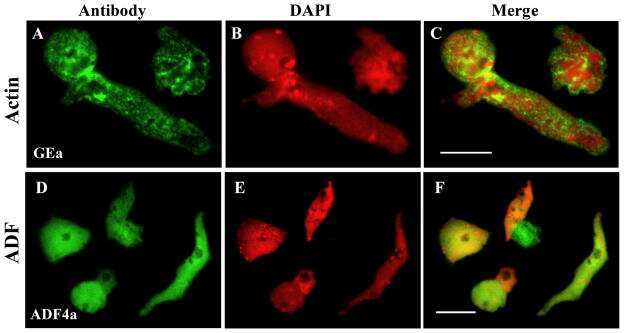
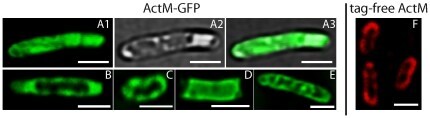
- Figure 1 ActM-GFP expression in E.coli. ActM-GFP adopts a variety of shapes and apparently is not freely diffusible in E.coli . All images show the GFP-channel, except for A2 and A3 which display the transmission channel and an overlay of transmission and GFP, respectively. Image F shows anti-actin/TRITC immunofluorescence of untagged ActM expressed in E.coli . Scale bars: 2 um.
- Submitted by
- Invitrogen Antibodies (provider)
- Main image
- Experimental details
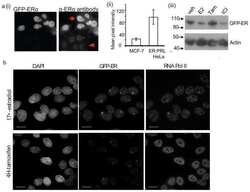
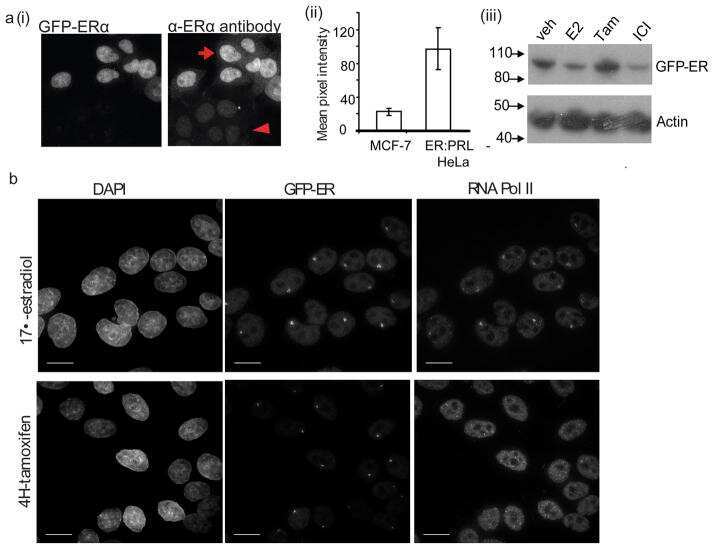
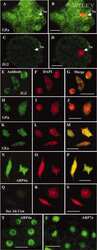
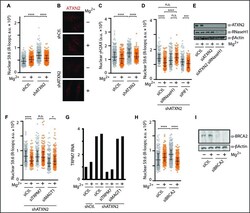
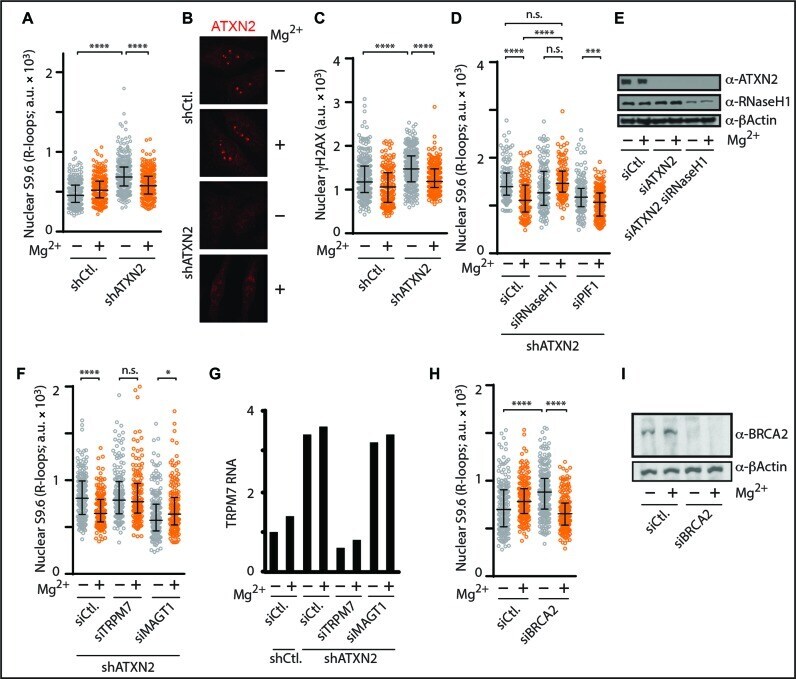
- Figure 5. Mg 2+ counters human R-loop accumulation by relying on RNaseH1 and the TRPM7 Mg 2+ transporter. ( A ) Anti-RNA-DNA hybrid immunofluorescence indicates that 10 mM Mg 2+ supplementation significantly decreases nuclear R-loop buildup in shATXN2 HeLa cells as shown in the scatter plot to better represent cell population data (N = 150 per condition; Mean +- Quartiles; **** P < 0.0001 for the Mann-Whitney test). ( B ) Representative anti-ATXN2 immunofluorescence images from cells transiently transfected with siCtl. or siATXN2 in the presence or absence of 10 mM Mg 2+ supplementation. Note how Mg 2+ supplementation does not alter ATXN2 levels or localization. ( C ) Anti-gammaH2AX immunofluorescence imaging and quantitation indicate that 10 mM Mg 2+ supplementation counters gammaH2AX accumulation in shATXN2 HeLa cells (N = 150 per condition; Mean +- Quartiles; **** P < 0.0001 for the Mann-Whitney test). ( D ) Anti-RNA-DNA hybrid immunofluorescence reveals that transient knockdown of RNaseH1, but not PIF1, abolishes the R-loop-suppressing effect of 10 mM Mg 2+ supplementation in shATXN2 HeLa cells (N = 150 per condition; Mean +- Quartiles; **** P < 0.0001, *** P < 0.001 for the Mann-Whitney test; n.s. not statistically significant). ( E ) Immunoblots showing transient knockdown of RNaseH1 in ATXN2-deficient HeLa cells. Anti-beta-Actin immunoblotting served as loading control. ( F ) Anti-RNA-DNA hybrid immunofluorescence reveals that transient knockdown of TRPM7, but not MAGT
- Submitted by
- Invitrogen Antibodies (provider)
- Main image
- Experimental details
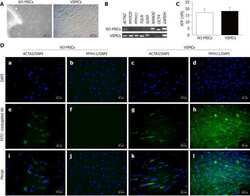
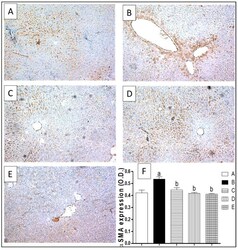
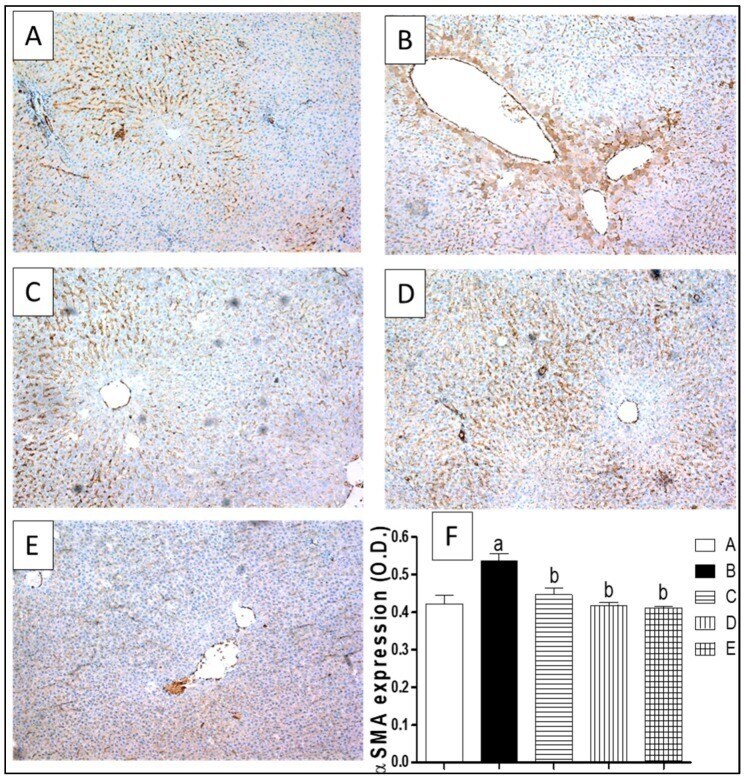
- Figure 6 Expression of alpha smooth muscle actin (alpha-SMA) by immunohistochemical staining (x100). ( A ) Photomicrograph of liver section of control rats showing minimal immunostaining for alpha -SMA; ( B ) Photomicrograph of liver section of CCl 4 intoxicated rats showing extensive alpha -SMA expression of as shown by the intense brown staining; ( C ) Photomicrograph of liver section of (CCl 4 /Silymarin) treated rats showing limited alpha -SMA expression; ( D ) Photomicrograph of liver section of rats concurrently treated with CCl 4 (1 mL/kg) twice a week and ETN (100 mg/kg) three times per week, showing limited alpha -SMA expression; ( E ) Photomicrograph of liver section of rats simultaneously treated with CCl 4 (1 mL/kg) twice a week and STN (100 mg/Kg) three times per week, showing minimal alpha -SMA expression; ( F ) A graphical representation of the alpha -SMA expression as optical density (O.D) for the liver sections from different groups, where a or b express the significant difference from control or CCl 4 group respectively at p < 0.05 using ANOVA followed by Tukey-Kramer as a post-hoc test.
- Submitted by
- Invitrogen Antibodies (provider)
- Main image

- Experimental details
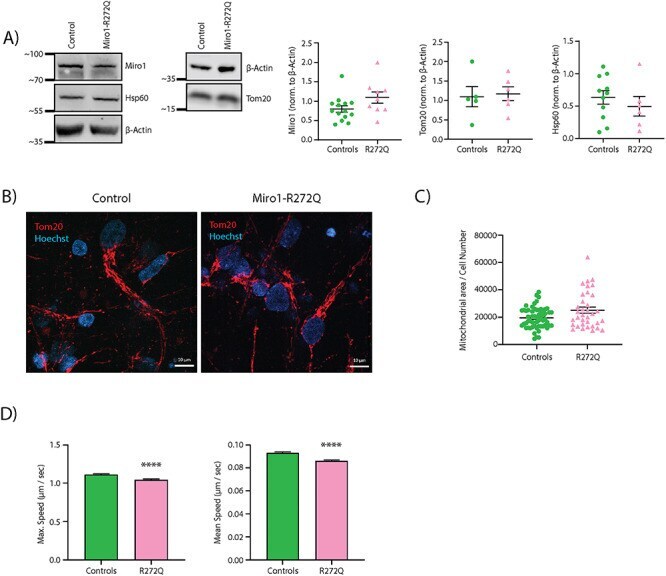
- Figure 1 Miro1-R272Q does not affect mitochondrial mass, but reduces mitochondrial movement. ( A ) Representative western blot images of Miro1 protein and the mitochondrial marker proteins Tom20 and Hsp60 in iPSC-derived neurons. Corresponding densitometries of western blot analyses normalized to beta-actin are shown at the right. Data indicated as mean +- SEM ( n = 3). ( B ) iPSC-derived neurons were fixed and stained against Tom20. Images were obtained using a 63x objective; scale bars indicate 10 mum. ( C ) Quantification of mitochondrial area per cell from the Tom20 signal from images shown in B. Data indicated as mean +- SEM. Significance calculated by Mann-Whitney test ( n = 4). ( D ) Analysis of maximum and mean speed per mitochondria from iPSC-derived neurons stained with MitoTracker Green FM. Data indicated as mean +- SEM. Significance calculated by Mann-Whitney test; * * * P < 0.001; ( n = 5).
- Submitted by
- Invitrogen Antibodies (provider)
- Main image
- Experimental details
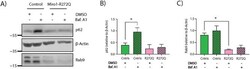
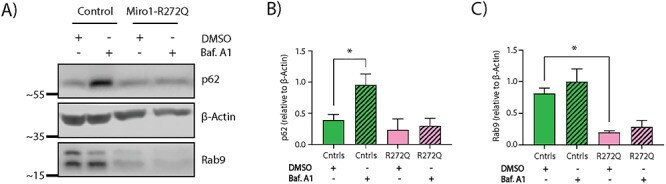
- Figure 5 Miro1-R272Q leads to alterations of autophagy flux and Rab9 protein levels. ( A ) Representative western blot image of p62 and Rab9 proteins in iPSC-derived neurons after bafilomycin A1 treatment. ( B) Densitometry of p62 western blot analysis normalized to beta-actin. Data indicated as mean +- SEM. Significance calculated by Mann-Whitney test; * P < 0.05; ( n = 3). ( C ) Densitometry of Rab9 western blot analysis normalized to beta-actin. Data indicated as mean +- SEM. Significance calculated by Mann-Whitney test; * P < 0.05; ( n = 3).
- Submitted by
- Invitrogen Antibodies (provider)
- Main image
- Experimental details
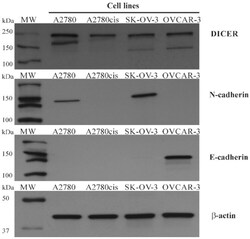
- Figure 7 The total level of DICER, N-cadherin and E-cadherin proteins in A2780, A2780cis, SK-OV-3, and OVCAR-3 cell lines-Immunoblots. A2780, A2780cis, SK-OV-3, OVCAR3 ovarian cancer cell lines were cultured, harvested, and lysed with RIPA buffer. This Figure contains representative immunoblots of DICER, N-cadherin, E-cadherin, and beta-actin proteins level, which were obtained with the Immunoblotting-ECL method.

- Submitted by
- Invitrogen Antibodies (provider)
- Main image
- Experimental details
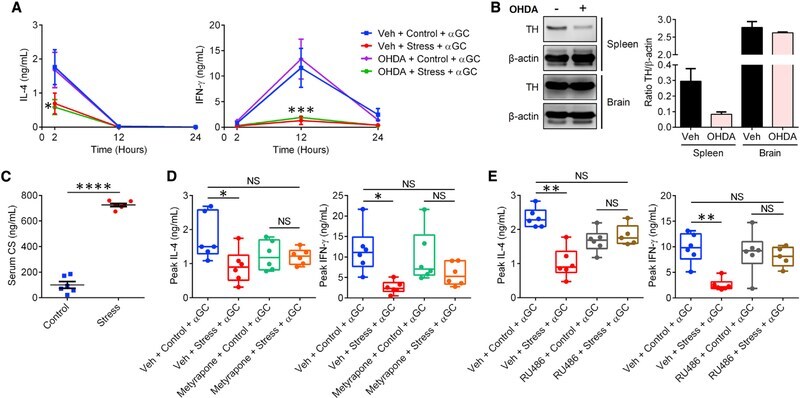
- Figure 3. Stress-induced suppression of i NKT cell responses is mediated by glucocorticoids, not by SNS signals (A) WT B6 mice (n = 3 or 4 per group) were injected i.p. with OHDA or Veh 6 days before they were restrained. Control cohorts were left undisturbed. Stressed and control animals were injected with alphaGC and bled at the indicated time points. Circulating IL-4 and IFN-gamma levels were measured by ELISA. (B) Protein extracts from flash-frozen spleen and brain samples from mice in (A) were loaded onto the same SDS-polyacrylamide gel and examined for their tyrosine hydroxylase (TH) content by western blotting. Staining for beta-actin was used to ensure equal protein loading. Summary data illustrate normalized TH levels after densitometry analyses. (C) Separate cohorts that had been restrained for 12 h or left undisturbed were bled for serum CS quantification by ELISA. (D and E) Mice were injected i.p. with metyrapone (D) or RU486 (E) 1 h before they were restrained for 12 h (or not) followed by an i.p. injection of alphaGC. Box-and-whisker plots show IL-4 and IFN-gamma levels at 2- and 12-h time points post-alphaGC administration, respectively, with each symbol representing an individual mouse. Statistical comparisons were made by two-way ANOVA with Dunnett''s correction (A), unpaired Student''s t test (C), or one-way ANOVA with Tukey''s correction (D and E). *p < 0.05, **p < 0.01, ***p < 0.001, ****p < 0.0001; NS, not significant.
- Submitted by
- Invitrogen Antibodies (provider)
- Main image
- Experimental details
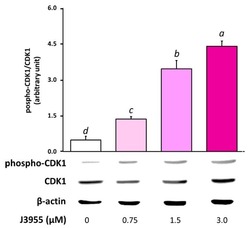
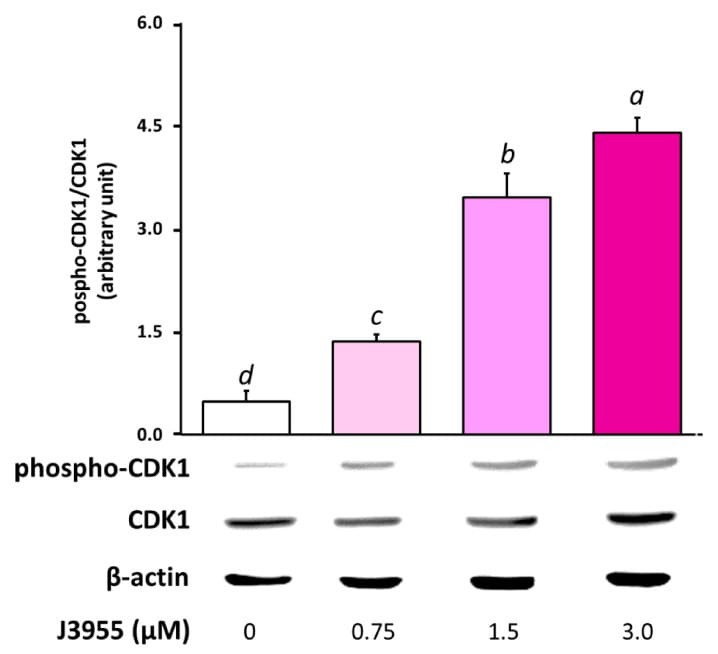
- Figure 10 Effects of a 6 h treatment with J3955 (0.75, 1.5, and 3 muM) on Cdk1 phosphorylation in HepG2 cells. After the treatment, cells were collected and the proteins were isolated for Western blot analysis as described in ''''Materials and methods''''. The panel shows a representative Western blot and densitometric analysis. The values represent the ratio between phospho-Cdk1 and total Cdk1, both previously normalized for the corresponding beta-actin. Values are expressed as the mean +- S.D. of three separate experiments with similar results. Different lowercase letters on the top of each histogram indicate statistical ( p < 0.05) differences among the tested samples, as measured by one-way ANOVA followed by the Tuckey test. The letter ""a"" marks the highest value. Bars not sharing the same letter were significantly different.
- Submitted by
- Invitrogen Antibodies (provider)
- Main image
- Experimental details
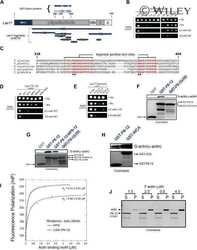
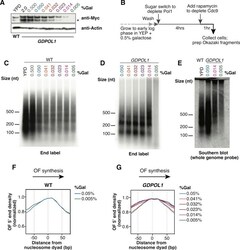
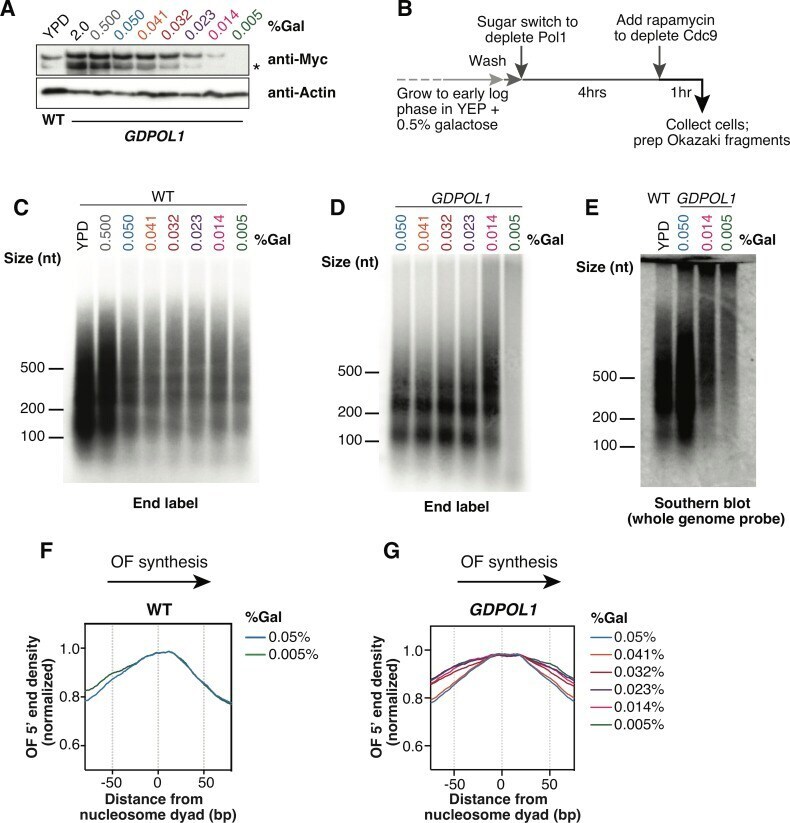
- 10.1371/journal.pgen.1008755.g001 Fig 1 Okazaki fragments increase in length when Pol alpha is limiting. (A). Western blot against 13xMyc-tagged Pol1 from S. cerevisiae from a wild-type or GDPOL1 strain, as indicated, shifted to YPD or YEP + 3% raffinose (hereafter, media) supplemented with various concentrations of galactose. The lower band indicated by an asterisk is a degradation product resulting from degron-tagging. (B). Schematic of experimental workflow for Okazaki fragment analysis and sequencing (also see methods ). (C, D). Alkaline agarose gel analysis of end-labeled Okazaki fragments from a wild type (C) or GDPOL1 (D) strain, shifted to YPD or media supplemented with galactose as indicated. (E). Southern blot using a whole genome probe, on Okazaki fragments from a wild type or GDPOL1 strain shifted to media with the indicated sugar concentrations. (F, G). Distribution of Okazaki fragment 5' ends around consensus nucleosome dyads [] for a wild-type (F) or GDPOL1 (G) strain shifted to media containing the indicated concentration of galactose. Data for Okazaki fragment 3' ends in GDPOL1 are in S1F Fig .
- Submitted by
- Invitrogen Antibodies (provider)
- Main image

- Experimental details
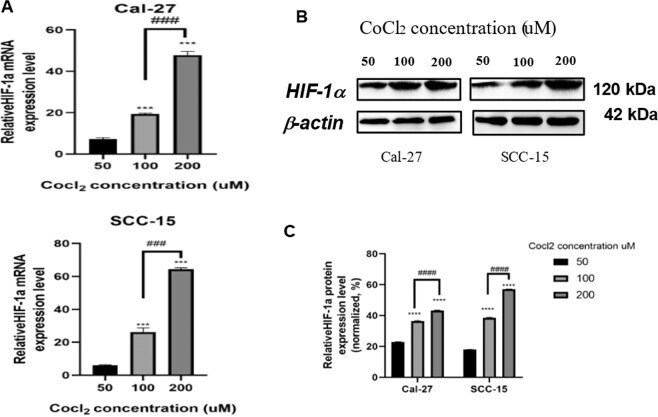
- Fig. 3 CoCl 2 induced the mRNA and protein expression of HIF-1 alpha to construct a hypoxic microenvironment. CoCl 2 significantly induced the mRNA ( A ) and protein ( B ) and ( C ) expression of HIF-1alpha in a dose-dependent manner. Cal-27 and SCC-15 cells were co-cultured with different concentrations of CoCl2 for 24 h, then the mRNA and protein expression levels of HIF-1alpha were analyzed by qRT-PCR and Western blot, which were normalized to those of beta-actin. Data were expressed as the mean +- SEM from three independent experiments. * p < 0.05, ** p < 0.01, *** p < 0.001 vs 50 muM CoCl 2 ; # p < 0.05, ## p < 0.01, ### p < 0.001 vs. 50 muM CoCl 2 .
- Submitted by
- Invitrogen Antibodies (provider)
- Main image
- Experimental details
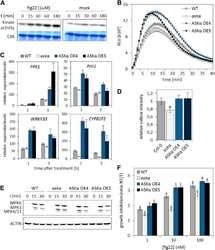
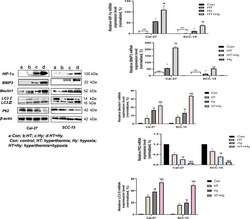
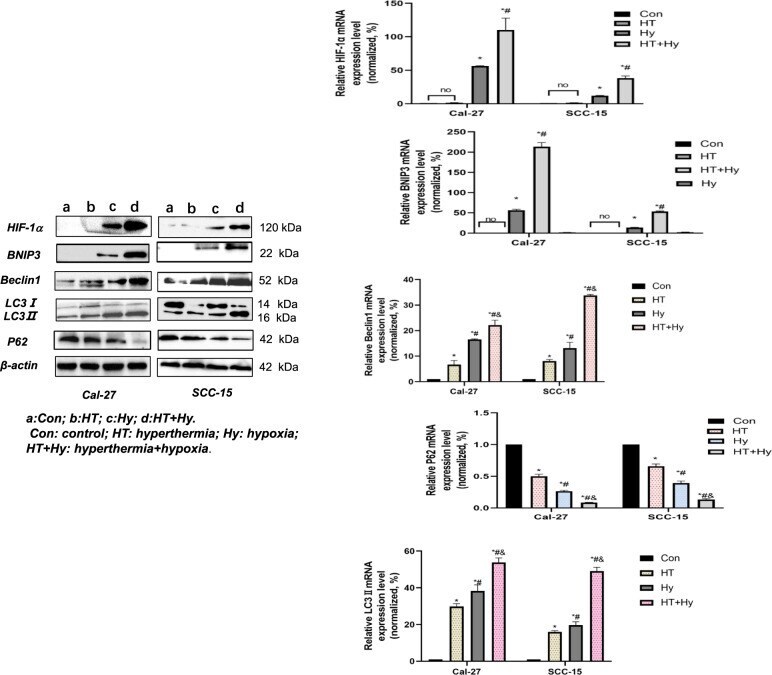
- Fig. 4 Hyperthermia and hypoxia-induced the expression of autophagy hallmark proteins in OSCC cells. Cal-27 and SCC-15 cells were cultured in hypoxia conditions and were exposed to 42 degC for 1 h, followed by recovery at 37 degC for 24 h. The protein and mRNA levels of HIF-1alpha, BNIP3, Beclin1, LC3-II, and p62 were analyzed by qRT-PCR and western blot and normalized to those of beta-actin. Data were expressed as the mean +- SEM from three independent experiments. a: Con; b: HT; c: Hy; d: HT + Hy. Con control, HT hyperthermia, Hy hypoxia, HT + Hy hyperthermia+hypoxia. * p < 0.05 vs. Con group; # p < 0.05 vs. HT group; & p < 0.05 vs. Hy group; no: no significant difference ( p > 0.05).
- Submitted by
- Invitrogen Antibodies (provider)
- Main image
- Experimental details
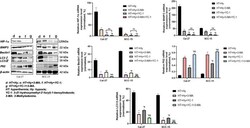
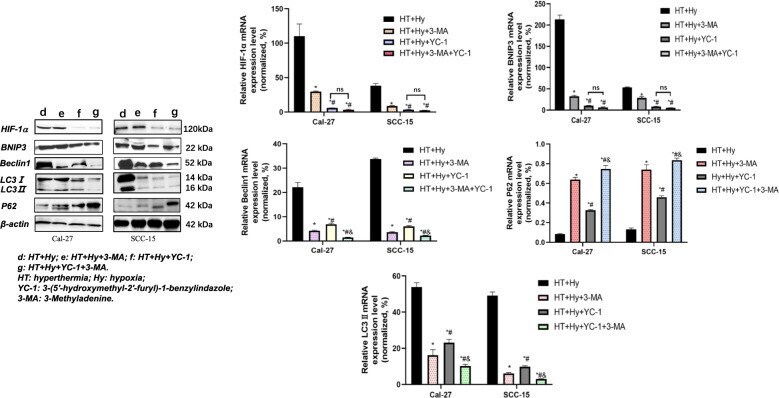
- Fig. 5 The addition of YC-1 and 3-MA inhibited HT-induced autophagy in hypoxia and starvation tumor microenvironment, both of which involved downregulation of the HIF-1alpha/BNIP3 /Beclin1 signaling pathway. The mRNA and protein expression of HIF-1alpha, BNIP3, Beclin1, LC3-II, and p62 in OSCC cells were measured by Western blot and qRT-PCR, which were normalized to beta-actin. The results were presented as the mean +- standard deviation of three independent experiments. d: HT + Hy; e: HT + Hy+3-MA; f: HT + Hy+YC-1; g: HT + Hy+YC-1 + 3-MA. HT: hyperthermia; Hy: hypoxia; YC-1: 3-(5'-hydroxymethyl-2'-furyl)-1-benzylindazole; 3-MA: 3-Methyladenine. * p < 0.05 vs. HT + Hy group; # p < 0.05 vs. HT + Hy+3-MA group; & p < 0.05 vs. HT + Hy+YC-1 group; ns no significant difference ( p > 0.05).
- Submitted by
- Invitrogen Antibodies (provider)
- Main image

- Experimental details
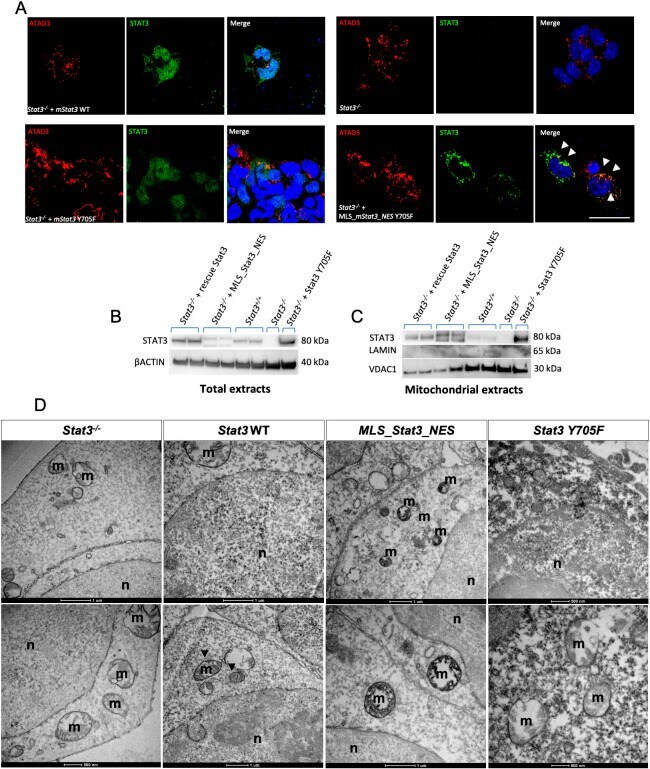
- Fig. 5. Y705 phosphorylation is needed for the correct localisation of STAT3 in the mitochondrion. (A) IF with anti-STAT3 and anti-ATAD3 antibodies on ESCs transiently transfected with either mStat3 , mStat3 Y705F or MLS_mStat3_NES Y705F . Arrowheads indicate the colocalisation of ATAD and STAT3. (B) Western blot of total STAT3 in ESC extracts; beta-actin was used as a loading control. (C) Western blot of mitochondrial STAT3 from ESC mitochondrial extracts; VDAC1 was used as a mitochondrial loading control, Lamin was used as a control for nuclear contamination. (D) Representative pictures of DAB IHC on ESCs acquired with TEM; positive signal is black and negative is white. Cristae are positive in Stat3 WT and MLS_Stat3_NES transfected cells. m, mitochondria; n, nucleus. Scale bar: 200 mum (A).
- Submitted by
- Invitrogen Antibodies (provider)
- Main image

- Experimental details
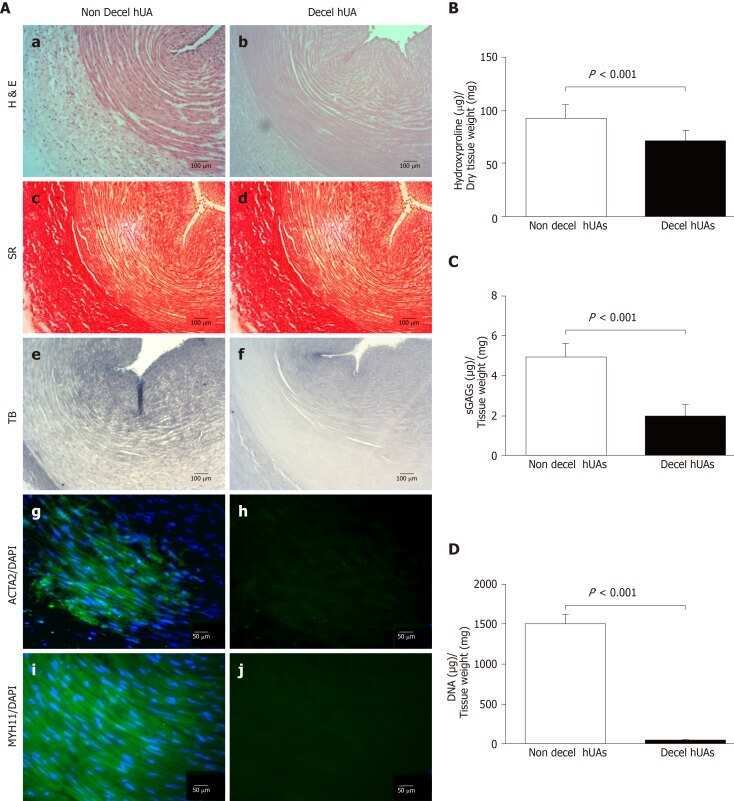
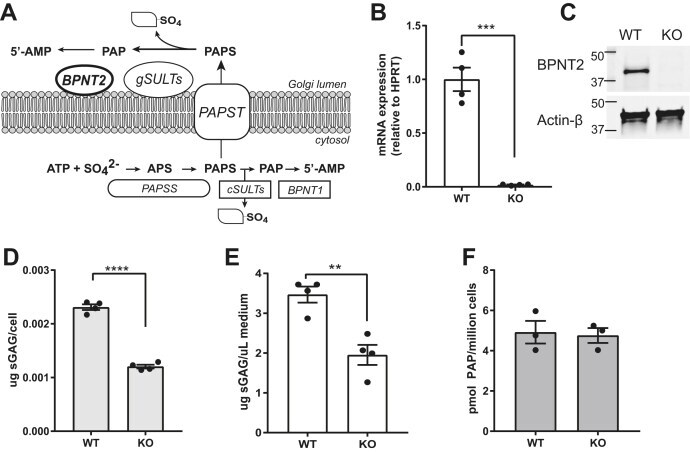
- Figure 1 Loss of Bpnt2 impairs glycosaminoglycan sulfation but does not alter the PAP level. A , illustration of intracellular sulfation pathways, wherein BPNT2 hydrolyzes PAP, a by-product of sulfation, to AMP. B , absent expression of Bpnt2 mRNA (*** p = 0.0001) in Bpnt2-KO MEFs as determined by quantitative PCR and ( C ) absent BPNT2 protein in Bpnt2-KO MEFs, as determined by Western blot. D , Bpnt2-KO MEFs exhibit decreased levels of both intracellular ( left , **** p < 0.0001) and ( E ) secreted ( right , ** p = 0.0034) sulfated glycosaminoglycans, as determined by the DMMB assay. F , Bpnt2-KO MEFs do not show changes in the PAP level relative to WT cells. The bars show the mean +- SEM. Significance analyses are the results of unpaired Student's t test (two-sided). APS, adenosine phosphosulfate; BPNT1, bisphosphate nucleotidase 1; BPNT2, bisphosphate nucleotidase 2; cSULTs, cytosolic sulfotransferases; DMMB, dimethylmethylene blue; gSULTs, Golgi-resident sulfotransferases; MEFs, mouse embryonic fibroblasts; PAP, 3'-phosphoadenosine-5'-phosphate; PAPS, phosphoadenosine-phosphosulfate; PAPSS, PAPS synthase; PAPST, PAPS transporter.
- Submitted by
- Invitrogen Antibodies (provider)
- Main image
- Experimental details
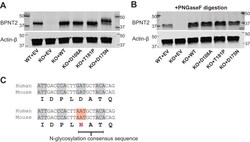
- Figure 3 Generation of mutant Bpnt2 MEF lines. A , blot for BPNT2 and actin on protein extracted from Bpnt2 MEF lines; arrows in D175N lane denote 2 bands, representing singly and doubly glycosylated protein. B , blot of proteins extracted from MEF lines, treated with PNGaseF to remove N-glycosyl groups; PNGaseF removes both glycosyl groups, resulting in a single band for BPNT2-D175N. Note that all bands shift downward with PNGaseF, as native murine BPNT2 has one N-glycosylation site at N257. C , a selection of Bpnt2 sequence from mouse and human Bpnt2 . In both, the D175N/D177N mutation results in the generation of an N-glycosyl consensus sequence. BPNT2, bisphosphate nucleotidase 2; MEF, mouse embryonic fibroblast.

- Submitted by
- Invitrogen Antibodies (provider)
- Main image
- Experimental details
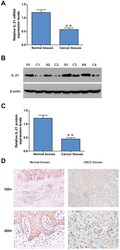
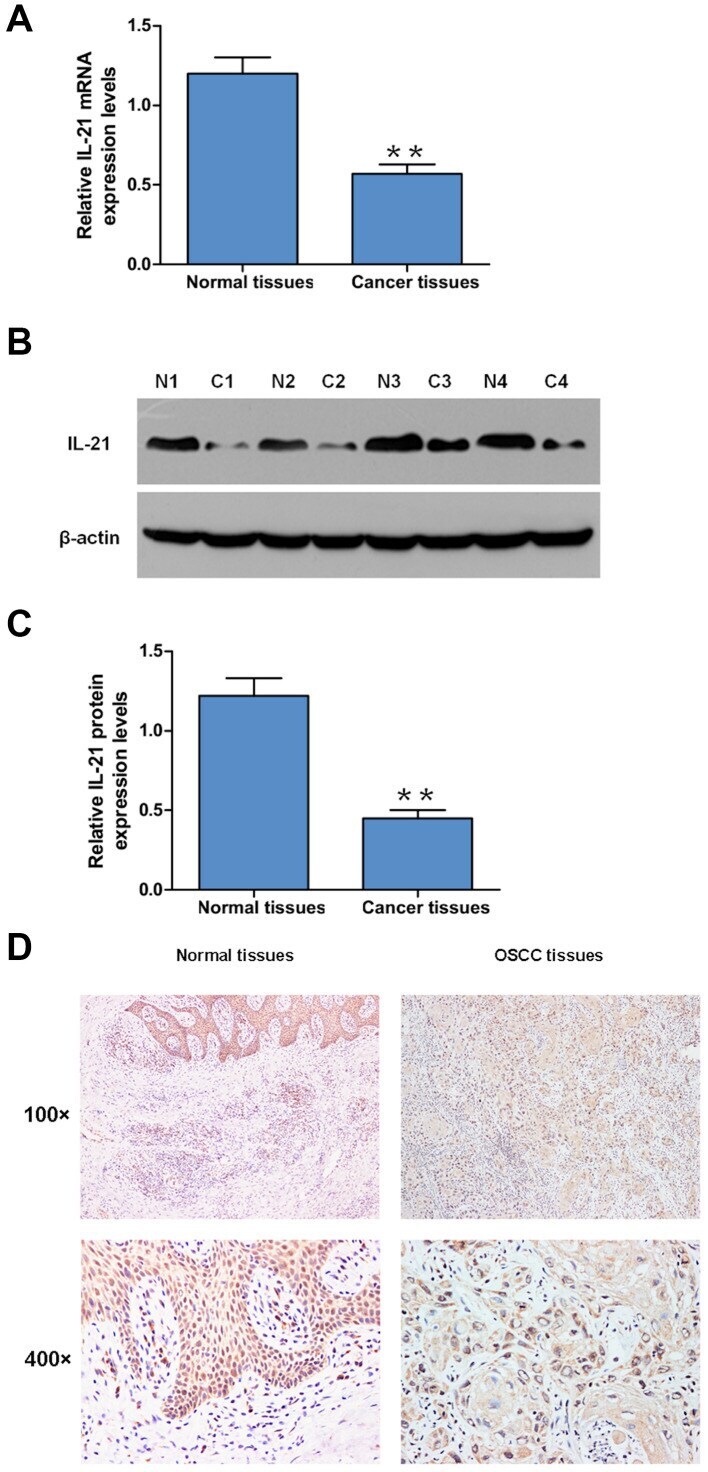
- Figure 1. Expression levels of IL-21 in OSCC tissues. (A) mRNA expression levels of IL-21 in OSCC tissues and adjacent normal tissues were detected using reverse transcription-quantitative PCR. (B) Protein expression levels of IL-21 in OSCC tissues and adjacent normal tissues were detected using western blotting. (C) Semi-quantification of the western blotting data presented in part B. Expression levels of IL-21 were normalized to beta-actin. The data are presented as the mean +- SEM from three independent experiments. **P
- Submitted by
- Invitrogen Antibodies (provider)
- Main image
- Experimental details
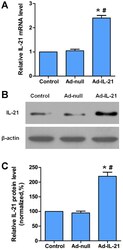
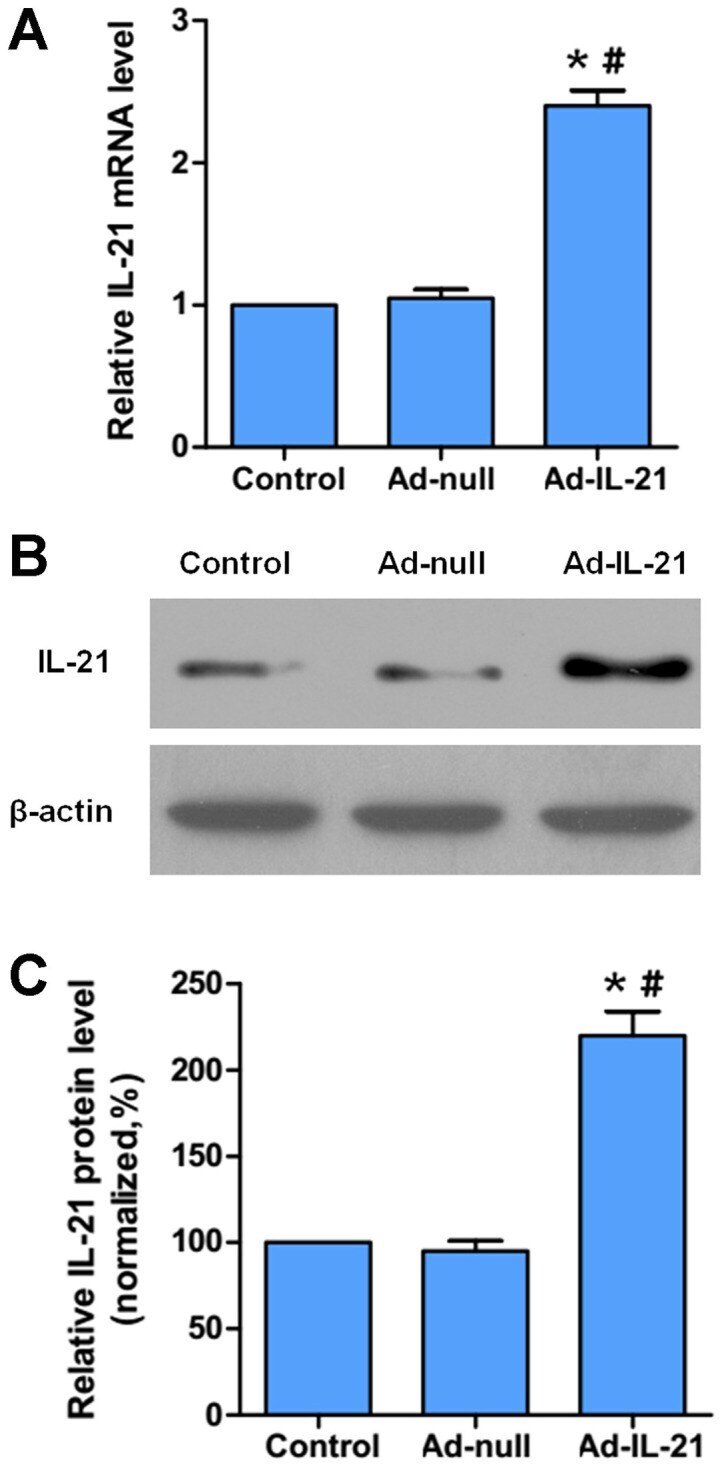
- Figure 2. Adenoviral-mediated overexpression of IL-21 in CAL-27 cells. (A) Reverse transcription-quantitative PCR or (B) western blotting was used to analyze the mRNA or protein expression levels, respectively, of IL-21 in CAL-27 cells infected with Ad- or Ad-IL-21. (C) Semi-quantification of the western blotting data presented in part B. Expression levels of IL-21 were normalized to beta-actin. The data were expressed as the mean +- SEM from three independent experiments. *P
- Submitted by
- Invitrogen Antibodies (provider)
- Main image

- Experimental details
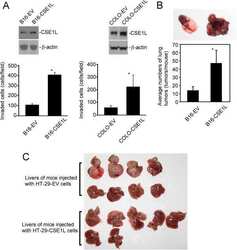
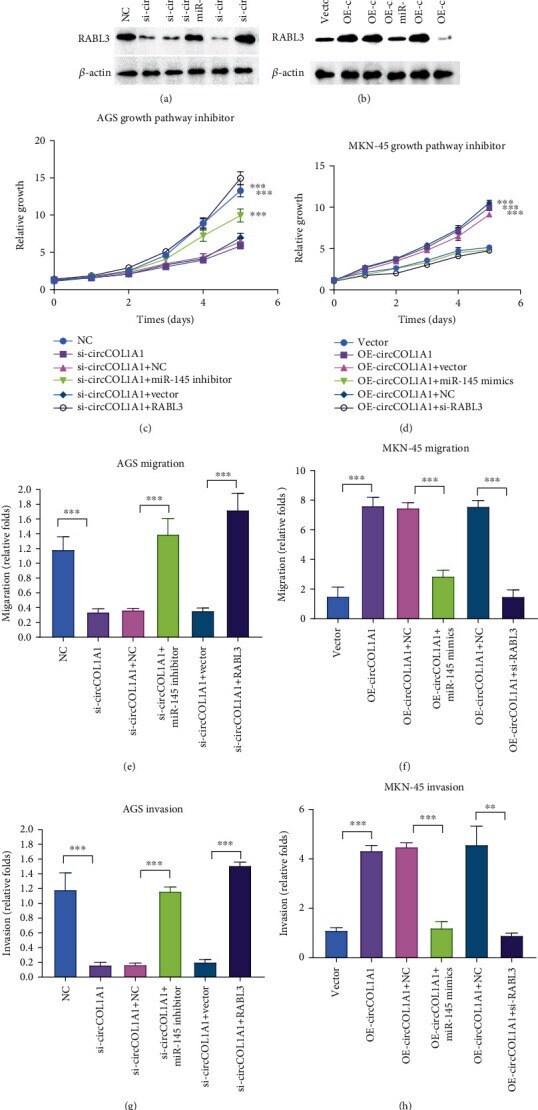
- Figure 6 circCOL1A/miR-145/RABL3 axis regulates the proliferation, migration, and invasion of gastric cancer. (a) Western blot results of RABL3 in AGS cells. (b) Western blot results of RABL3 in MKN-45 cells. (c) CCK8 assay was used in AGS NC and si-circCOL1A1 cells. AGS NC and si-circCOL1A1 cells were rescued by transfection of the miR-145 inhibitor or RABL3 overexpression plasmids. (d) CCK8 assay was used in the MKN-45 vector and circCOL1A1 overexpression cells. MKN-45 vector and circCOL1A1 overexpression cells were then transfected with miR-145 mimics or RABL3 siRNA. (e) Migration assay was used in AGS NC and si-circCOL1A1 cells with indicated transfections. (f) Migration assay was used in the MKN-45 vector and circCOL1A1 overexpression cells with indicated transfections. (g) Invasion assay was used in AGS NC and si-circCOL1A1 cells with indicated transfections. (h) Invasion assay was used in the MKN-45 vector and circCOL1A1 overexpression cells with indicated transfections.
- Submitted by
- Invitrogen Antibodies (provider)
- Main image
- Experimental details
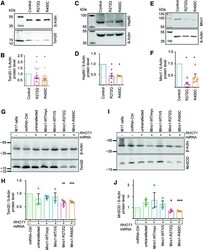
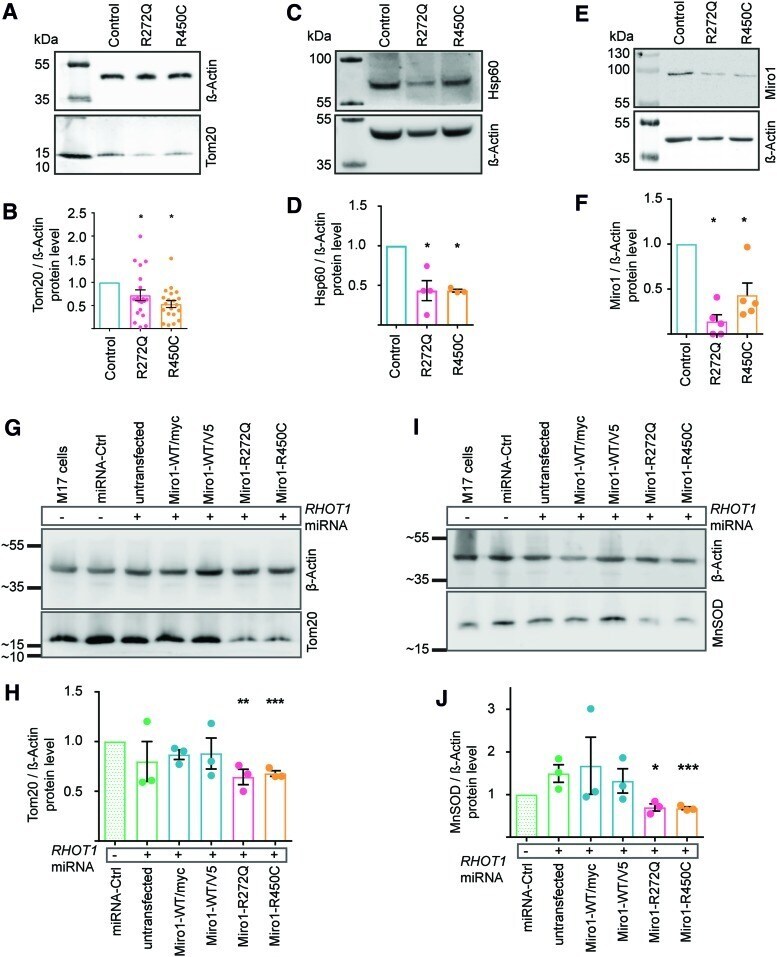
- FIG. 4. Mutant Miro1 protein leads to reduction of mitochondrial mass. (A) Representative Western blot of Tom20 in immortalized fibroblasts. (B) Quantification of Tom20 protein level in immortalized fibroblasts from (A) . Significance tested with the Wilcoxon test ( n = 20). (C) Representative Western blot image of Hsp60 protein in immortalized fibroblasts. (D) Quantification of Hsp60 normalized to beta-actin from (C) . Significance assessed using the Mann-Whitney test ( n = 4). (E) Representative Western blot image of Miro1 protein in immortalized fibroblasts. (F) Quantification of Western blot analysis of Miro1 protein levels from (E) . Significance determined using the Wilcoxon test ( n = 5). (G) Representative Western blot image of Tom20 and (I) MnSOD proteins in M17 cells with stable knockdown of endogenous RHOT1 and transiently overexpression of Miro1 variants. (-) Indicates M17 cells without knockdown of endogenous RHOT1 . (+) Indicates knockdown of endogenous RHOT1 by stable transfection with the RHOT1 -targeting miRNA-2471 ( RHOT1 miRNA). M17 cells were transfected with Miro1-WT/myc (in pRK5-myc vector), Miro1-WT/V5, Miro1-R272Q, or Miro1-R450C (in pcDNA3.1/V5-HisA vector). (H) Quantification of Tom20 protein levels from (G) ( n = 3). (J) Quantification of MnSOD protein levels from (I) ( n = 3). All data indicated as mean +- SEM. * p
- Submitted by
- Invitrogen Antibodies (provider)
- Main image
- Experimental details
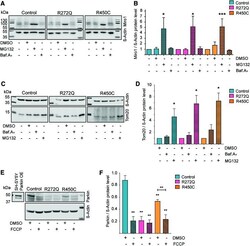
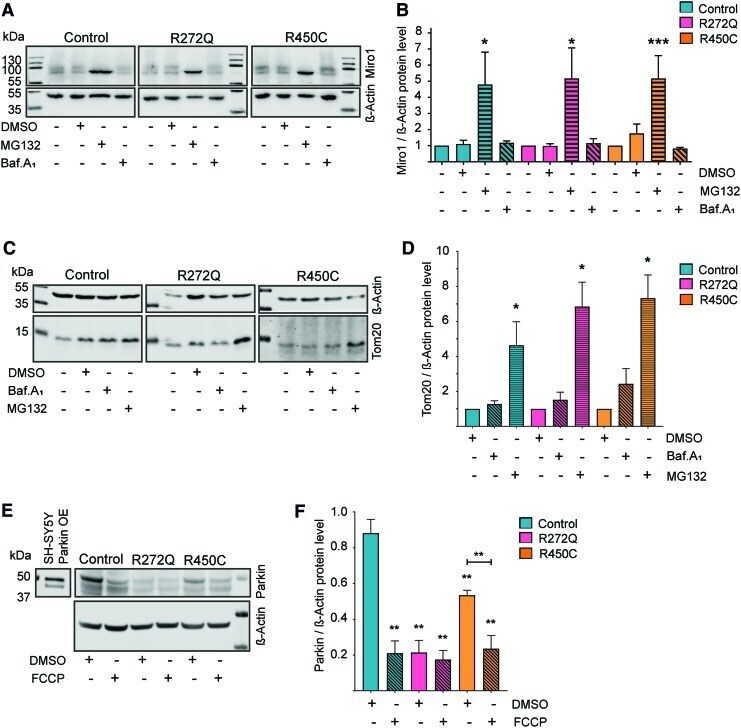
- FIG. 5. Mitochondrial turnover is increased in Miro1-mutant fibroblasts. (A) Representative Western blot image of Miro1 in immortalized fibroblasts treated with 10 mu M MG132 for 24 h or with 10 n M bafilomycinA 1 for 48 h. (B) Quantification of Miro1 protein level from Western blots displayed in (A) . Significance assessed with the Wilcoxon test ( n = 3-7). (C) Western blot image for Tom20 protein in immortalized fibroblasts treated with 10 n M bafilomycinA 1 for 48 h or with 10 mu M MG132 for 24 h, respectively. (D) Quantification of Tom20 protein levels from Western blot analysis shown in (C) . Significance assessed using the Wilcoxon test ( n = 5). (E) Representative Western blot image of Parkin protein. Left panel shows Parkin bands in SH-SY5Y cells overexpressing Parkin. Right panel shows endogenous Parkin in immortalized fibroblasts treated with 10 mu M FCCP for 14 h. (F) Quantification of Parkin protein levels normalized to beta-actin from (E) . Significance calculated by the Mann-Whitney test ( n = 5). All data indicated as mean +- SEM. * p
- Submitted by
- Invitrogen Antibodies (provider)
- Main image

- Experimental details
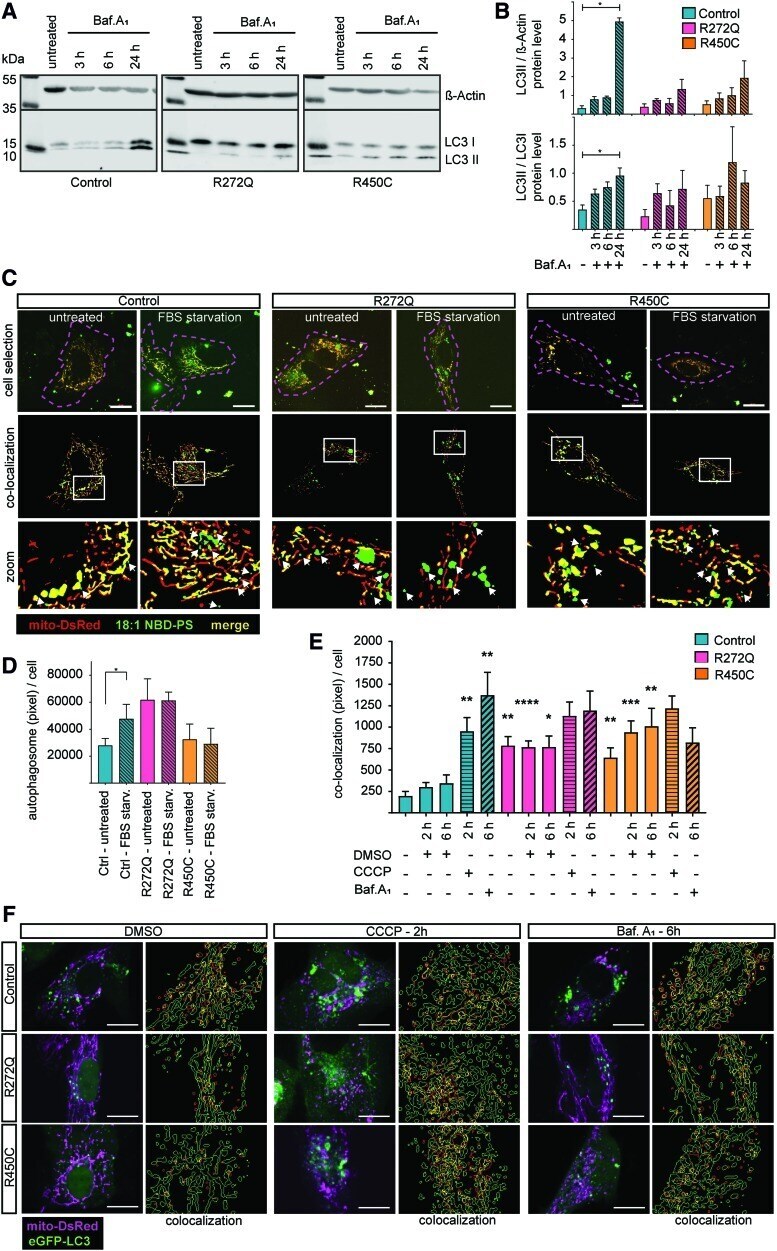
- FIG. 6. LC3-dependent autophagy is affected in Miro1-mutant fibroblasts. (A) Representative Western blot image of immortalized fibroblasts treated with 10 n M bafilomycinA 1 for 3, 6, or 24 h. (B) Densitometry analysis of Western blot for LC3-II normalized to beta-actin ( upper graph ) and the ratio of LC3-II/LC3-I protein levels ( lower graph ) from (A) . Significance calculated by the Friedman test ( n = 3). (C) Immortalized fibroblasts were transfected with mito-DsRed and labeled with 18:1 NBD-PS. Then, cells were starved in medium without FBS for 2 h for subsequent live cell imaging, using a 63 x objective. Cell selection shows microscopy images with mito-DsRed-labeled mitochondria ( red ) and 18:1 NBD-PS ( green ). Cells were manually selected ( dashed pink outline ) to ensure that only 18:1 NBD-PS-labeled autophagosomes in the cytosol were analyzed. The colocalization panel shows the selected cells from the data analysis. White squares indicate the regions, which were shown in the zoom panel . Autophagosomes were identified as green particles, which are not colocalizing with the mito-DsRed signal ( white arrows ). (D) Quantification of autophagosome formation from images shown in (C) . Significance calculated by the Wilcoxon test ( n = 3). (E) Colocalization of mitochondria and LC3 pixel from (F) were quantified and normalized to cell number. Significance assessed using the Mann-Whitney test ( n = 3, with ~30 cells per cell line). (F) Immortalized fibroblasts were trans
- Submitted by
- Invitrogen Antibodies (provider)
- Main image
- Experimental details
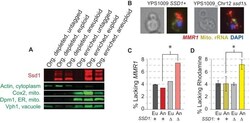
- Figure 5. Ssd1 affects mRNA localization. ( A ) Representative Western blot showing Ssd1-GFP and markers of mitochondria, ER, and vacuole as detected in organelle-depleted and organelle-enriched fractions from SSD1-GFP or untagged-Ssd1 strains (see Methods). Ssd1 fragments migrating below the expected top band emerge during the fractionation incubations. ( B ) Representative smFISH showing bud-localized M MR1 transcript in wild-type and ssd1Delta aneuploids. ( C ) Quantification of percent buds lacking MMR1 from smFISH (see Materials and methods). ( D ) Percent of cells lacking Rhodamine staining. Histograms represent average and SEM across biological triplicates; *, p

- Submitted by
- Invitrogen Antibodies (provider)
- Main image

- Experimental details
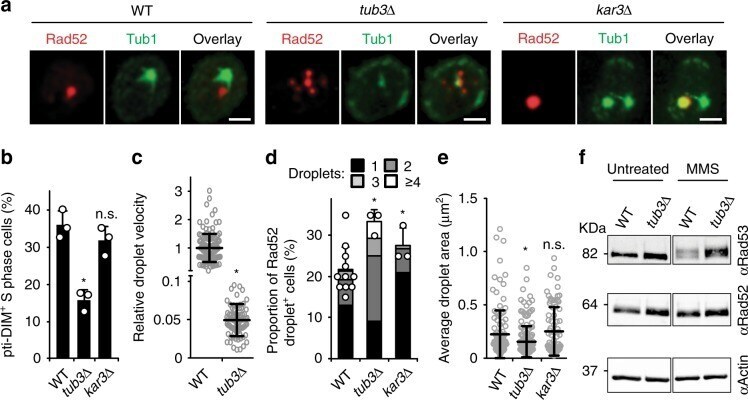
- Fig. 4 pti-DIMs promote genome-stabilising clustering of Rad52 droplets. a - f Live-cell microscopy shows that the pti-DIM-compromising tub3Delta ( a , b ) lowers droplet velocity ( c ), increases droplet numbers ( d ) and decreases droplet size ( e ), while western blotting shows Rad53 hyper-phosphorylation ( f ). kar3 served as control. Quantifications represent the mean +- s.d. ; * P