Explore
 Validate
 Learn
Learn Western blot
Antibody data
- Antibody Data
- Antigen structure
- References [14]
- Comments [0]
- Validations
- Western blot [4]
- Immunocytochemistry [2]
- Immunohistochemistry [2]
- Flow cytometry [1]
- Other assay [2]
Submit
Validation data
Reference
Comment
Report error
- Product number
- 71-7100 - Provider product page

- Provider
- Invitrogen Antibodies
- Product name
- Pan-cadherin Polyclonal Antibody
- Antibody type
- Polyclonal
- Antigen
- Synthetic peptide
- Description
- This peptide antibody is broadly cross-reactive with all members of the cadherin family of proteins including N-cadherin, E-cadherin, P-cadherin, and R-cadherin. The antibody also displays broad species cross-reactivity including human, bovine, mouse, rat, chicken, amphibian, as well as other species. Rabbit anti-pan-Cadherin is useful as both a ubiquitous cadherin probe as well as a marker for adherens junctions.
- Concentration
- 0.25 mg/mL
Submitted references Peptide functionalized DNA hydrogel enhances neuroblastoma cell growth and differentiation.
Application of Three-Dimensional Culture Method in the Cardiac Conduction System Research.
Soluble RARRES1 induces podocyte apoptosis to promote glomerular disease progression.
Lipidomics unveils lipid dyshomeostasis and low circulating plasmalogens as biomarkers in a monogenic mitochondrial disorder.
Enteropathogenic E. coli effectors EspF and Map independently disrupt tight junctions through distinct mechanisms involving transcriptional and post-transcriptional regulation.
Diamond, graphite, and graphene oxide nanoparticles decrease migration and invasiveness in glioblastoma cell lines by impairing extracellular adhesion.
Different responses in transformation of MDCK cells in 2D and 3D culture by v-Src as revealed by microarray techniques, RT-PCR and functional assays.
Immunofluorescent analysis of connexin-43 using monoclonal antibodies to its extracellular domain.
Proteomic Analysis of Vascular Endothelial Cells-Effects of Laminar Shear Stress and High Glucose.
p27Kip1 is expressed in proliferating cells in its form phosphorylated on threonine 187.
Myofibroblast development is characterized by specific cell-cell adherens junctions.
Differential regulation of the TRAIL death receptors DR4 and DR5 by the signal recognition particle.
ESX induces transformation and functional epithelial to mesenchymal transition in MCF-12A mammary epithelial cells.
Conditional ROCK activation in vivo induces tumor cell dissemination and angiogenesis.
Hivare P, Gangrade A, Swarup G, Bhavsar K, Singh A, Gupta R, Thareja P, Gupta S, Bhatia D
Nanoscale 2022 Jun 23;14(24):8611-8620
Nanoscale 2022 Jun 23;14(24):8611-8620
Application of Three-Dimensional Culture Method in the Cardiac Conduction System Research.
Mishra A, Pasumarthi KBS
Methods and protocols 2022 Jun 14;5(3)
Methods and protocols 2022 Jun 14;5(3)
Soluble RARRES1 induces podocyte apoptosis to promote glomerular disease progression.
Chen A, Feng Y, Lai H, Ju W, Li Z, Li Y, Wang A, Hong Q, Zhong F, Wei C, Fu J, Guan T, Liu B, Kretzler M, Lee K, He JC
The Journal of clinical investigation 2020 Oct 1;130(10):5523-5535
The Journal of clinical investigation 2020 Oct 1;130(10):5523-5535
Lipidomics unveils lipid dyshomeostasis and low circulating plasmalogens as biomarkers in a monogenic mitochondrial disorder.
Ruiz M, Cuillerier A, Daneault C, Deschênes S, Frayne IR, Bouchard B, Forest A, Legault JT, LSFC Consortium, Vaz FM, Rioux JD, Burelle Y, Des Rosiers C
JCI insight 2019 Jul 25;4(14)
JCI insight 2019 Jul 25;4(14)
Enteropathogenic E. coli effectors EspF and Map independently disrupt tight junctions through distinct mechanisms involving transcriptional and post-transcriptional regulation.
Singh AP, Sharma S, Pagarware K, Siraji RA, Ansari I, Mandal A, Walling P, Aijaz S
Scientific reports 2018 Feb 27;8(1):3719
Scientific reports 2018 Feb 27;8(1):3719
Diamond, graphite, and graphene oxide nanoparticles decrease migration and invasiveness in glioblastoma cell lines by impairing extracellular adhesion.
Wierzbicki M, Jaworski S, Kutwin M, Grodzik M, Strojny B, Kurantowicz N, Zdunek K, Chodun R, Chwalibog A, Sawosz E
International journal of nanomedicine 2017;12:7241-7254
International journal of nanomedicine 2017;12:7241-7254
Different responses in transformation of MDCK cells in 2D and 3D culture by v-Src as revealed by microarray techniques, RT-PCR and functional assays.
Töyli M, Rosberg-Kulha L, Capra J, Vuoristo J, Eskelinen S
Laboratory investigation; a journal of technical methods and pathology 2010 Jun;90(6):915-28
Laboratory investigation; a journal of technical methods and pathology 2010 Jun;90(6):915-28
Immunofluorescent analysis of connexin-43 using monoclonal antibodies to its extracellular domain.
Baklaushev VP, Gurina OI, Yusubalieva GM, Grinenko NF, Cytrin EB, Victorov IV, Chekhonin VP
Bulletin of experimental biology and medicine 2009 Oct;148(4):725-30
Bulletin of experimental biology and medicine 2009 Oct;148(4):725-30
Proteomic Analysis of Vascular Endothelial Cells-Effects of Laminar Shear Stress and High Glucose.
Wang XL, Fu A, Spiro C, Lee HC
Journal of proteomics & bioinformatics 2009 Jan 1;2:445
Journal of proteomics & bioinformatics 2009 Jan 1;2:445
p27Kip1 is expressed in proliferating cells in its form phosphorylated on threonine 187.
Troncone G, Martinez JC, Iaccarino A, Zeppa P, Caleo A, Russo M, Migliaccio I, Motti ML, Califano D, Palmieri EA, Palombini L
BMC clinical pathology 2005 Feb 23;5(1):3
BMC clinical pathology 2005 Feb 23;5(1):3
Myofibroblast development is characterized by specific cell-cell adherens junctions.
Hinz B, Pittet P, Smith-Clerc J, Chaponnier C, Meister JJ
Molecular biology of the cell 2004 Sep;15(9):4310-20
Molecular biology of the cell 2004 Sep;15(9):4310-20
Differential regulation of the TRAIL death receptors DR4 and DR5 by the signal recognition particle.
Ren YG, Wagner KW, Knee DA, Aza-Blanc P, Nasoff M, Deveraux QL
Molecular biology of the cell 2004 Nov;15(11):5064-74
Molecular biology of the cell 2004 Nov;15(11):5064-74
ESX induces transformation and functional epithelial to mesenchymal transition in MCF-12A mammary epithelial cells.
Schedin PJ, Eckel-Mahan KL, McDaniel SM, Prescott JD, Brodsky KS, Tentler JJ, Gutierrez-Hartmann A
Oncogene 2004 Mar 4;23(9):1766-79
Oncogene 2004 Mar 4;23(9):1766-79
Conditional ROCK activation in vivo induces tumor cell dissemination and angiogenesis.
Croft DR, Sahai E, Mavria G, Li S, Tsai J, Lee WM, Marshall CJ, Olson MF
Cancer research 2004 Dec 15;64(24):8994-9001
Cancer research 2004 Dec 15;64(24):8994-9001
No comments: Submit comment
Supportive validation
- Submitted by
- Invitrogen Antibodies (provider)
- Main image
- Experimental details
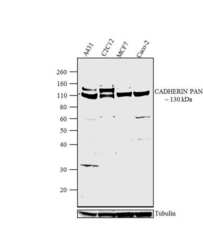
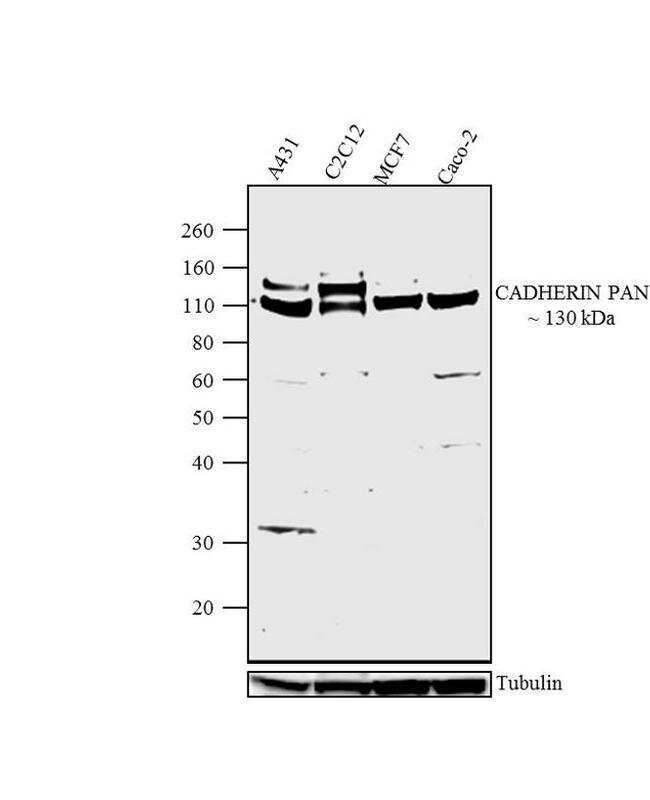
- Western blot analysis was performed on membrane enriched extracts (30 µg lysate) of A431 (Lane 1), C2C12 (Lane 2), MCF 7 (Lane 3) and Caco2 (Lane 4). The blots were probed with Anti-CADHERIN PAN Rabbit Polyclonal Antibody (Product # 71-7100, 1-2 µg/mL) and detected by chemiluminescence using Goat anti-Rabbit IgG (H+L) Secondary Antibody, HRP conjugate (Product # G-21234, 1:5000 dilution). A ~ 130 kDa band corresponding to CADHERIN PAN was observed across cell lines tested. Known quantity of protein samples were electrophoresed using Novex® NuPAGE® 10 % Bis-Tris gel (Product # NP0302BOX), XCell SureLock™ Electrophoresis System (Product # EI0002) and Novex® Sharp Pre-Stained Protein Standard (Product # LC5800). Resolved proteins were then transferred onto a nitrocellulose membrane with Pierce™ Power Blotter System (Product # 22834). The membrane was probed with the relevant primary and secondary Antibody following blocking with 5 % skimmed milk. Chemiluminescent detection was performed using Pierce™ ECL Western Blotting Substrate (Product # 32106).
- Submitted by
- Invitrogen Antibodies (provider)
- Main image

- Experimental details
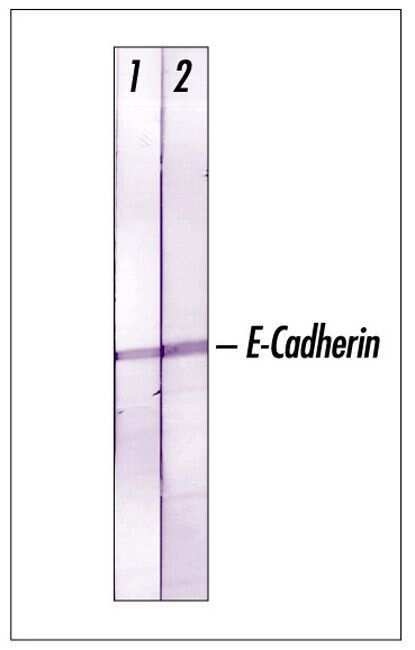
- Recognition of E-Cadherin in A431 cells by using Rabbit pan-Cadherin.
- Submitted by
- Invitrogen Antibodies (provider)
- Main image
- Experimental details
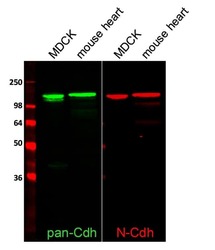
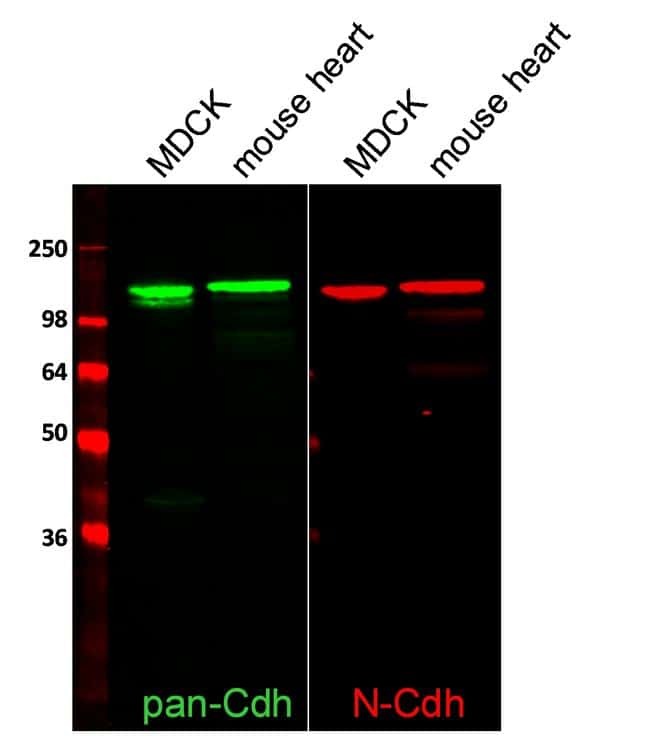
- Western blot analysis of total Cadherin and N-Cadherin was performed by loading 2 µL SeeBlue® Plus2 Prestained Protein Ladder (Product # LC5925), 50 µg of MDCK cell lysates and 10 µg mouse heart lysate per well onto a 4-20% Tris-HCl polyacrylamide gel. Proteins were transferred to a nitrocellulose membrane and blocked with 1% BSA/TBST for at least 1 hour at room temperature. Total cadherin was detected using a rabbit antibody (Product # 71-7100) and N-Cadherin was detected using a mouse antibody (Product # 33-3900), both at a concentration of 1 µg/mL in blocking buffer overnight at 4°C on a rocking platform. The blot was then incubated with goat anti-rabbit IgG-Alexa Fluor 790 secondary antibody (Product # A11369) and goat anti-mouse IgG-Alexa Fluor 680 secondary antibody (Product # A-21058) at a dilution of 1:10,000 for at least 1 hour. Fluorescent detection was performed using the Odyssey® CLx imaging system (Li-cor Biosciences). Images generated by Joell Solan in Paul Lampe Lab at Fred Hutchinson Cancer Research Center.
- Submitted by
- Invitrogen Antibodies (provider)
- Main image
- Experimental details
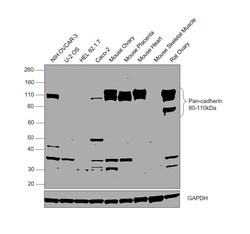
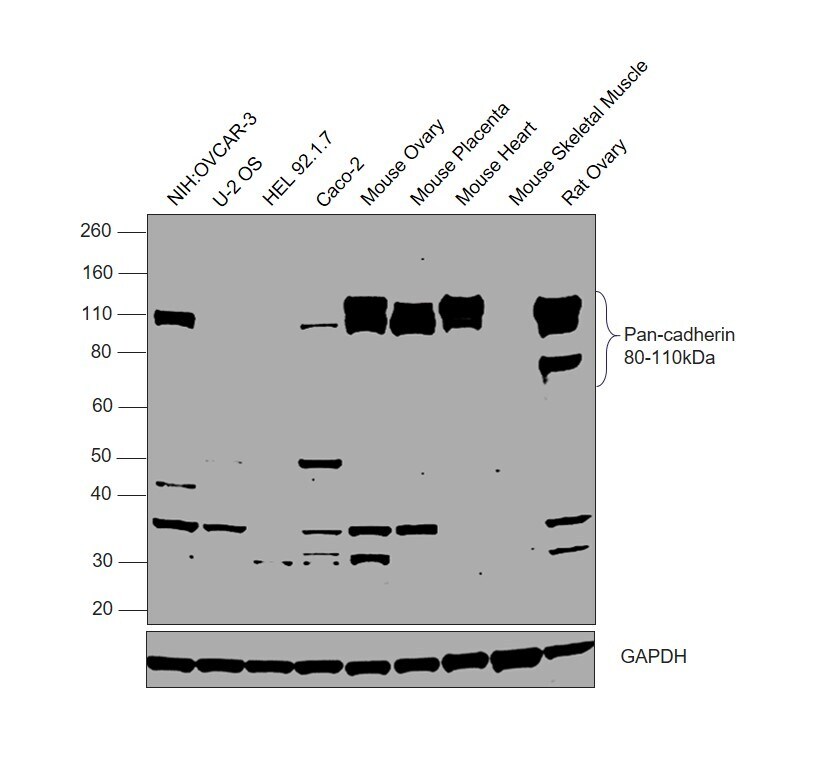
- Western Blot was performed using Anti-Pan-cadherin Polyclonal Antibody (Product # 71-7100) and a 80-110 kDa band corresponding to Cadherin-3 was observed across all the tested cell lines and tissues, except U-2 OS, HEL 92.1.7 and Mouse Skeletal Muscle. Whole cell extracts (30 µg lysate) of NIH:OVCAR-3 (Lane 1), U-2 OS (Lane 2), HEL 92.1.7 (Lane 3), Caco-2 (Lane 4), Mouse Ovary (Lane 5), Mouse Placenta (Lane 6), Mouse Heart (Lane 7), Mouse Skeletal Muscle (Lane 8), Rat Ovary (Lane 9) were electrophoresed using NuPAGE™ 4-12% Bis-Tris Protein Gel (Product # NP0322BOX). Resolved proteins were then transferred onto a nitrocellulose membrane (Product # IB23002) by iBlot® 2 Dry Blotting System (Product # IB21001). The blot was probed with the primary antibody (1 µg/mL) and detected by chemiluminescence with Goat anti-Rabbit IgG (H+L) Superclonal™ Recombinant Secondary Antibody, HRP (Product # A27036, 1/4000) using the iBright FL 1000 (Product # A32752). Chemiluminescent detection was performed using Novex® ECL Chemiluminescent Substrate Reagent Kit (Product # WP20005).
Supportive validation
- Submitted by
- Invitrogen Antibodies (provider)
- Main image
- Experimental details
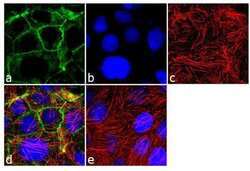
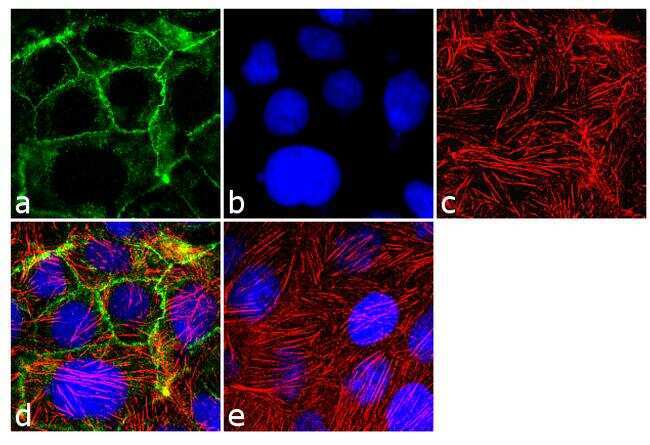
- Immunofluorescence analysis of Pan-Cadherin was performed using 90% confluent log phase Caco-2 cells. The cells were fixed with 4% paraformaldehyde for 10 minutes, permeabilized with 0.1% Triton™ X-100 for 10 minutes, and blocked with 2% BSA for 1 hour at room temperature. The cells were labeled with Cadherin pan Rabbit Polyclonal Antibody (Product # 71-7100) at 2 µg/mL in 0.1% BSA and incubated for 3 hours at room temperature and then labeled with Goat anti-Rabbit IgG (H+L) Superclonal™ Secondary Antibody, Alexa Fluor® 488 conjugate (Product # A27034) a dilution of 1:2000 for 45 minutes at room temperature (Panel a: green). Nuclei (Panel b: blue) were stained with SlowFade® Gold Antifade Mountant with DAPI (Product # S36938). F-actin (Panel c: red) was stained with Alexa Fluor® 555 Rhodamine Phalloidin (Product # R415, 1:300). Panel d represents the merged image showing cell junctional localization. Panel e shows the no primary antibody control. The images were captured at 60X magnification.
- Submitted by
- Invitrogen Antibodies (provider)
- Main image

- Experimental details
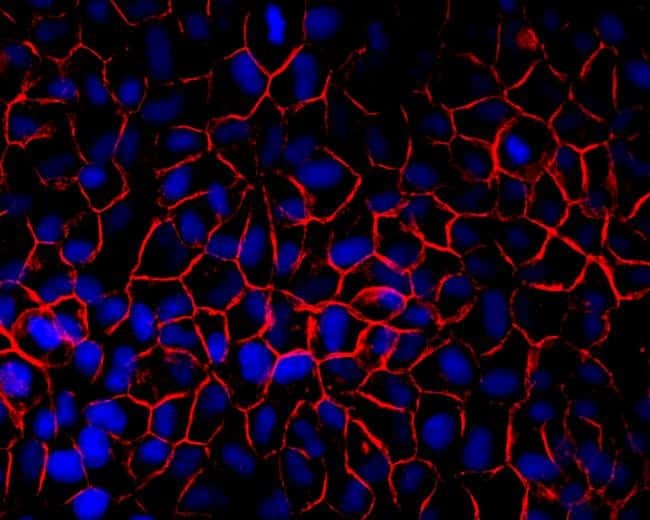
- Immunofluorescent detection of pan cadherin in MDCK cells. Confluent monolayers were fixed in 50%methanol/50%Acetone, blocked for at least 30 minutes in 1% BSA then incubated 2 hours with a pan cadherin antibody (Product # 71-7100) at 2.5 µg/mL, washed, then incubated 1 hour with Alexa Fluor 594 conjugated Donkey anti-Rabbit secondary antibody (Product # A-21207) at 1:2000 dilution. Cells were counterstained with DAPI (blue). Coverslips were mounted with Prolong Gold Antifade reagent (Product # P36930) and imaged at 40X. Images generated by Joell Solan in Paul Lampe Lab at the Fred Hutchinson cancer Research Center.
Supportive validation
- Submitted by
- Invitrogen Antibodies (provider)
- Main image
- Experimental details
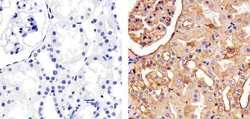
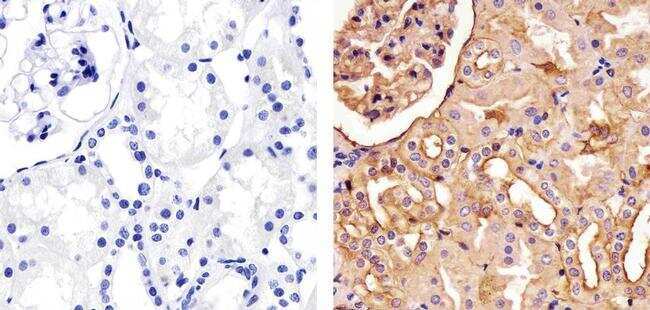
- Immunohistochemistry analysis of Cadherin pan showing staining in the membrane and also weakly in the cytoplasm of paraffin-embedded human kidney tissue (right) compared to a negative control without primary antibody (left). To expose target proteins, antigen retrieval was performed using 10mM sodium citrate (pH 6.0), microwaved for 8-15 min. Following antigen retrieval, tissues were blocked in 3% H2O2-methanol for 15 min at room temperature, washed with ddH2O and PBS, and then probed with a Anti- Cadherin pan Polyclonal Antibody (Product # 71-7100) diluted in 3% BSA-PBS at a dilution of 1:100 overnight at 4°C in a humidified chamber. Tissues were washed extensively in PBST and detection was performed using an HRP-conjugated secondary antibody followed by colorimetric detection using a DAB kit. Tissues were counterstained with hematoxylin and dehydrated with ethanol and xylene to prep for mounting.
- Submitted by
- Invitrogen Antibodies (provider)
- Main image
- Experimental details
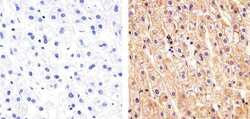
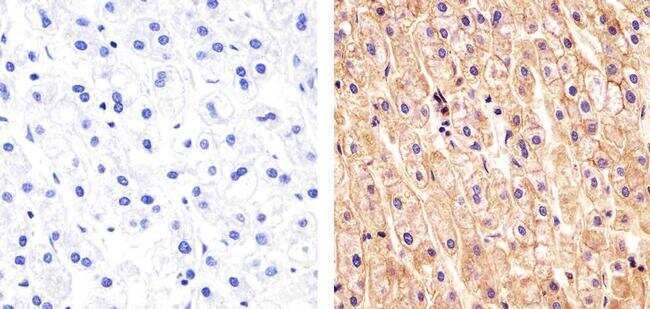
- Immunohistochemistry analysis of Cadherin pan showing staining in the membrane and also weakly in the cytoplasm of paraffin-embedded human liver tissue (right) compared to a negative control without primary antibody (left). To expose target proteins, antigen retrieval was performed using 10mM sodium citrate (pH 6.0), microwaved for 8-15 min. Following antigen retrieval, tissues were blocked in 3% H2O2-methanol for 15 min at room temperature, washed with ddH2O and PBS, and then probed with a Anti- Cadherin pan Polyclonal Antibody (Product # 71-7100) diluted in 3% BSA-PBS at a dilution of 1:100 overnight at 4°C in a humidified chamber. Tissues were washed extensively in PBST and detection was performed using an HRP-conjugated secondary antibody followed by colorimetric detection using a DAB kit. Tissues were counterstained with hematoxylin and dehydrated with ethanol and xylene to prep for mounting.
Supportive validation
- Submitted by
- Invitrogen Antibodies (provider)
- Main image
- Experimental details
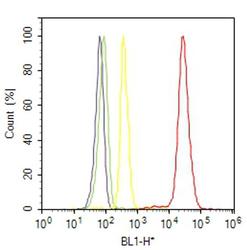
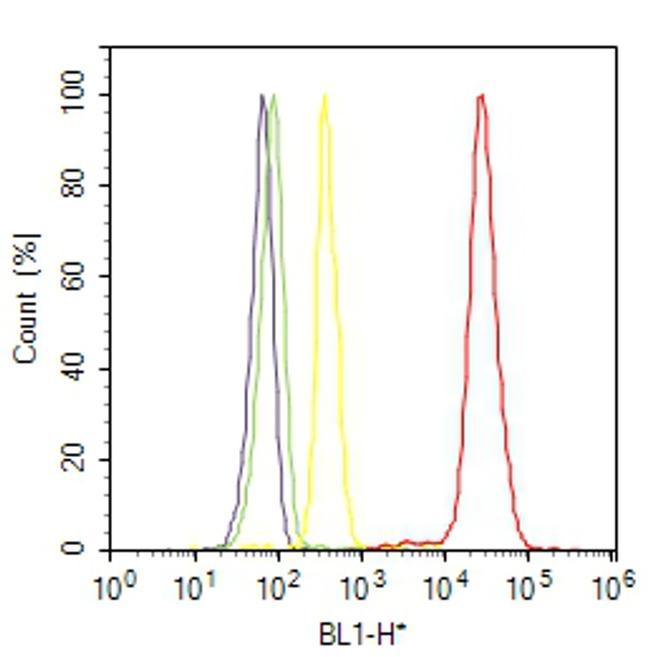
- Flow cytometry analysis of Cadherin pan was done on C2C12 cells. Cells were fixed with 70% ethanol for 10 minutes, permeabilized with 0.25% Triton™ X-100 for 20 minutes, and blocked with 5% BSA for 30 minutes at room temperature. Cells were labeled with Cadherin Rabbit Polyclonal Antibody (717100, red histogram) or with rabbit isotype control (yellow histogram) at 3-5 ug/million cells in 2.5% BSA. After incubation at room temperature for 2 hours, the cells were labeled with Alexa Fluor® 488 Goat Anti-Rabbit Secondary Antibody (A11008) at a dilution of 1:400 for 30 minutes at room temperature. The representative 10,000 cells were acquired and analyzed for each sample using an Attune® Acoustic Focusing Cytometer. The purple histogram represents unstained control cells and the green histogram represents no-primary-antibody control.
Supportive validation
- Submitted by
- Invitrogen Antibodies (provider)
- Main image

- Experimental details
- NULL
- Submitted by
- Invitrogen Antibodies (provider)
- Main image
- Experimental details
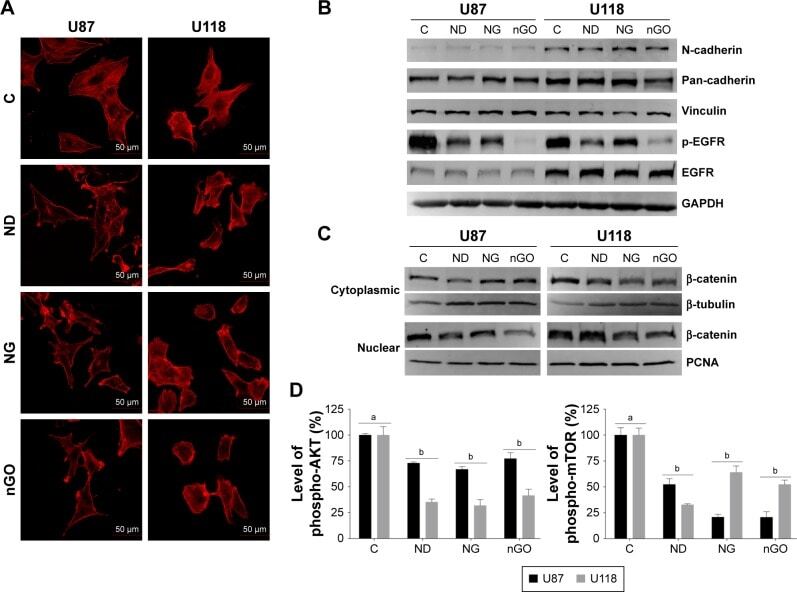
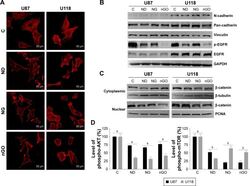
- Figure 5 EGFR/AKT/mTOR and beta-catenin signaling in glioblastoma cells after treated with nanoparticles. Notes: ( A ) Confocal microscope images of U87 and U118 cells actin cytoskeleton. Cells were grown on extracellular matrix for 24 h and treated with diamond nanoparticles, graphite nanoparticles, or graphene oxide nanoparticles at a concentration of 20 mug/mL and incubated for 24 h. F-Actin was stained with phalloidin conjugated with Atto 633. ( B ) Western blot analysis of N-cadherin, pan-cadherin, vinculin, p-EGFR, and EGFR. GAPDH was used as a loading control. ( C ) Western blot analysis of nuclear and cytoplasmic protein fractions used for determination of beta-catenin protein level. PCNA and beta-tubulin were used as loading controls for nuclear and cytoplasmic fractions, respectively. ( D ) ELISA analysis of AKT and mTOR phosphorylation in comparison to control. Treatment with nanoparticles significantly reduced phospho-AKT ( P