Explore
 Validate
 Learn
Learn Western blot
Antibody data
- Antibody Data
- Antigen structure
- References [2]
- Comments [0]
- Validations
- Western blot [1]
- Immunohistochemistry [1]
- Other assay [1]
Submit
Validation data
Reference
Comment
Report error
- Product number
- PA5-38099 - Provider product page

- Provider
- Invitrogen Antibodies
- Product name
- Caspase 1 (Cleaved Asp210) Polyclonal Antibody
- Antibody type
- Polyclonal
- Antigen
- Synthetic peptide
- Reactivity
- Human, Mouse
- Host
- Rabbit
- Isotype
- IgG
- Vial size
- 100 µg
- Concentration
- 1 mg/mL
- Storage
- -20°C
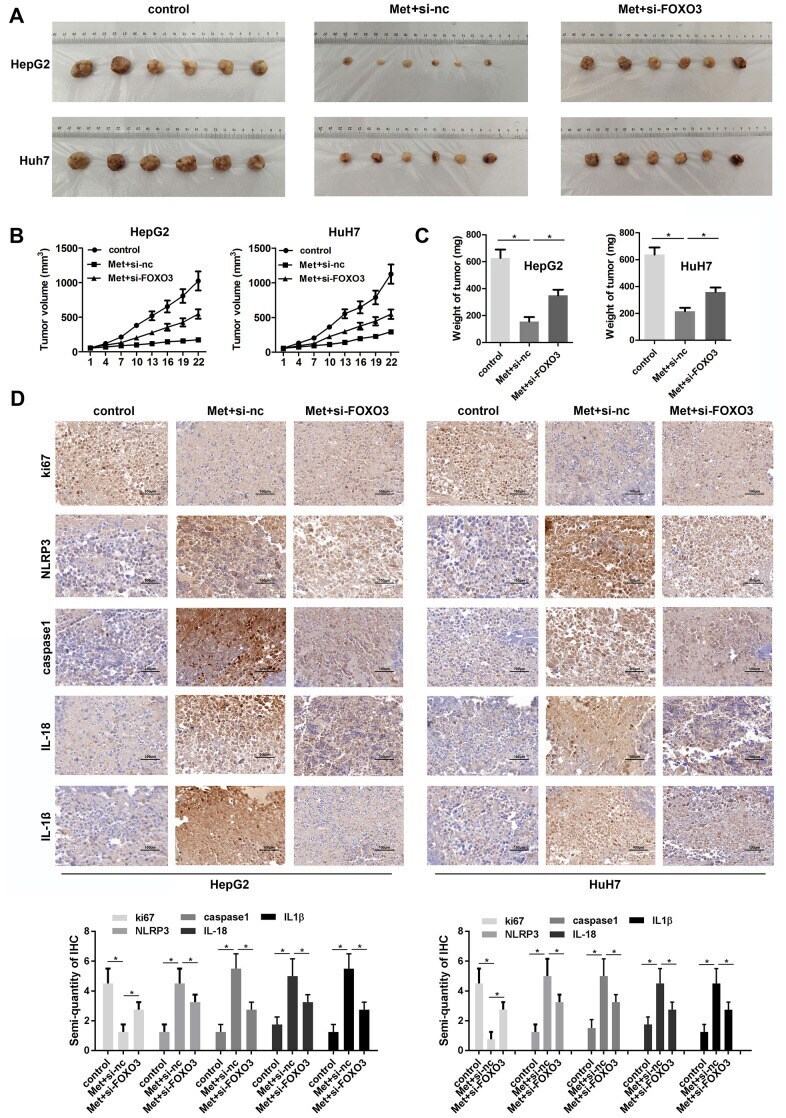
Submitted references Metformin inhibits hepatocellular carcinoma development by inducing apoptosis and pyroptosis through regulating FOXO3.
Transgenic expression of human APOL1 risk variants in podocytes induces kidney disease in mice.
Shen Z, Zhou H, Li A, Wu T, Ji X, Guo L, Zhu X, Zhang D, He X
Aging 2021 Sep 21;13(18):22120-22133
Aging 2021 Sep 21;13(18):22120-22133
Transgenic expression of human APOL1 risk variants in podocytes induces kidney disease in mice.
Beckerman P, Bi-Karchin J, Park AS, Qiu C, Dummer PD, Soomro I, Boustany-Kari CM, Pullen SS, Miner JH, Hu CA, Rohacs T, Inoue K, Ishibe S, Saleem MA, Palmer MB, Cuervo AM, Kopp JB, Susztak K
Nature medicine 2017 Apr;23(4):429-438
Nature medicine 2017 Apr;23(4):429-438
No comments: Submit comment
Supportive validation
- Submitted by
- Invitrogen Antibodies (provider)
- Main image
- Experimental details
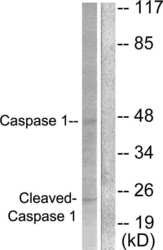
- Western blot analysis of Caspase 1 (Cleaved Asp210) in extracts from NIH-3T3 cells treated with PMA (25µM, 60min) using a Caspase 1 (Cleaved Asp210) polyclonal antibody (Product # PA5-38099).

Supportive validation
- Submitted by
- Invitrogen Antibodies (provider)
- Main image
- Experimental details
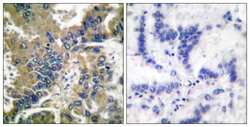
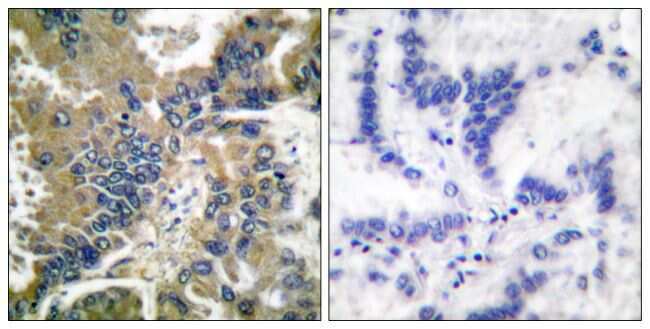
- Immunohistochemical analysis of Caspase 1 (Cleaved Asp210) in paraffin-embedded human lung carcinoma using a Caspase 1 (Cleaved Asp210) polyclonal antibody (Product # PA5-38099).
Supportive validation
- Submitted by
- Invitrogen Antibodies (provider)
- Main image
- Experimental details
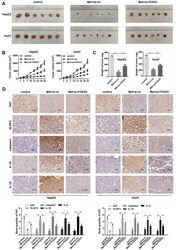
- Figure 8 Met inhibits HCC cell growth in vivo . ( A ) Image of tumors in each group. ( B ) Growth curves of the tumors in each group. ( C ) Tumor weights in the different groups. ( D ) IHC was used to evaluate the expression of Ki-67, NLRP3, caspase1, IL-1beta, and IL-18. * P