Explore
 Validate
 Learn
Learn Flow cytometry
Antibody data
- Antibody Data
- Antigen structure
- References [21]
- Comments [0]
- Validations
- Flow cytometry [1]
- Other assay [15]
Submit
Validation data
Reference
Comment
Report error
- Product number
- 11-4877-42 - Provider product page

- Provider
- Invitrogen Antibodies
- Product name
- EOMES Monoclonal Antibody (WD1928), FITC, eBioscience™
- Antibody type
- Monoclonal
- Antigen
- Other
- Description
- Description: This WD1928 antibody recognizes Eomesodermin (Eomes), also known as T-box brain 2 (TBR2). Eomes is a T-box transcription factor that is highly homologous to T-bet, which is essential during trophoblast development and gastrulation in most vertebrates. In the immune system, Eomes controls the differentiation of effector and memory CD8+ T cells, as well as natural killer (NK) cells. Expression of Eomes in these cells correlates with high expression of CD122, the common beta-chain of the IL-2R and IL-15R.
- Conjugate
- Green dye
- Antibody clone number
- WD1928
- Concentration
- 5 µL/Test
Submitted references A single-cell map of dynamic chromatin landscapes of immune cells in renal cell carcinoma.
Homeostatic Function and Inflammatory Activation of Ileal CD8(+) Tissue-Resident T Cells Is Dependent on Mucosal Location.
Norovirus-Specific CD8(+) T Cell Responses in Human Blood and Tissues.
Culture, expansion, and flow-cytometry-based functional analysis of pteropid bat MR1-restricted unconventional T cells.
TBC1D3 promotes neural progenitor proliferation by suppressing the histone methyltransferase G9a.
Complement opsonization of HIV affects primary infection of human colorectal mucosa and subsequent activation of T cells.
CD19-CAR-T Cells Bearing a KIR/PD-1-Based Inhibitory CAR Eradicate CD19(+)HLA-C1(-) Malignant B Cells While Sparing CD19(+)HLA-C1(+) Healthy B Cells.
In Situ Maturation and Tissue Adaptation of Type 2 Innate Lymphoid Cell Progenitors.
Cell-type-specific 3D epigenomes in the developing human cortex.
A Multiplex Human Pluripotent Stem Cell Platform Defines Molecular and Functional Subclasses of Autism-Related Genes.
The CD38/NAD/SIRTUIN1/EZH2 Axis Mitigates Cytotoxic CD8 T Cell Function and Identifies Patients with SLE Prone to Infections.
PD-1 Blockade Reinvigorates Bone Marrow CD8(+) T Cells from Patients with Multiple Myeloma in the Presence of TGFβ Inhibitors.
Tissue-resident Eomes(+) NK cells are the major innate lymphoid cell population in human infant intestine.
Unique transcriptional and protein-expression signature in human lung tissue-resident NK cells.
Autophagy Regulation of Metabolism Is Required for CD8(+) T Cell Anti-tumor Immunity.
MAIT cells are activated in acute Dengue virus infection and after in vitro Zika virus infection.
Effect of Cytomegalovirus (CMV) and Ageing on T-Bet and Eomes Expression on T-Cell Subsets.
Fetal CD103+ IL-17-Producing Group 3 Innate Lymphoid Cells Represent the Dominant Lymphocyte Subset in Human Amniotic Fluid.
Cutting edge: identification and characterization of human intrahepatic CD49a+ NK cells.
Arming of MAIT Cell Cytolytic Antimicrobial Activity Is Induced by IL-7 and Defective in HIV-1 Infection.
Human Th1 cells that express CD300a are polyfunctional and after stimulation up-regulate the T-box transcription factor eomesodermin.
Kourtis N, Wang Q, Wang B, Oswald E, Adler C, Cherravuru S, Malahias E, Zhang L, Golubov J, Wei Q, Lemus S, Ni M, Ding Y, Wei Y, Atwal GS, Thurston G, Macdonald LE, Murphy AJ, Dhanik A, Sleeman MA, Tykodi SS, Skokos D
Nature cancer 2022 Jul;3(7):885-898
Nature cancer 2022 Jul;3(7):885-898
Homeostatic Function and Inflammatory Activation of Ileal CD8(+) Tissue-Resident T Cells Is Dependent on Mucosal Location.
Lutter L, Roosenboom B, Brand EC, Ter Linde JJ, Oldenburg B, van Lochem EG, Horjus Talabur Horje CS, van Wijk F
Cellular and molecular gastroenterology and hepatology 2021;12(5):1567-1581
Cellular and molecular gastroenterology and hepatology 2021;12(5):1567-1581
Norovirus-Specific CD8(+) T Cell Responses in Human Blood and Tissues.
Pattekar A, Mayer LS, Lau CW, Liu C, Palko O, Bewtra M, Consortium H, Lindesmith LC, Brewer-Jensen PD, Baric RS, Betts MR, Naji A, Wherry EJ, Tomov VT
Cellular and molecular gastroenterology and hepatology 2021;11(5):1267-1289
Cellular and molecular gastroenterology and hepatology 2021;11(5):1267-1289
Culture, expansion, and flow-cytometry-based functional analysis of pteropid bat MR1-restricted unconventional T cells.
Sia WR, Hey YY, Foo R, Wang LF, Leeansyah E
STAR protocols 2021 Jun 18;2(2):100487
STAR protocols 2021 Jun 18;2(2):100487
TBC1D3 promotes neural progenitor proliferation by suppressing the histone methyltransferase G9a.
Hou QQ, Xiao Q, Sun XY, Ju XC, Luo ZG
Science advances 2021 Jan;7(3)
Science advances 2021 Jan;7(3)
Complement opsonization of HIV affects primary infection of human colorectal mucosa and subsequent activation of T cells.
Bhattacharya P, Ellegård R, Khalid M, Svanberg C, Govender M, Keita ÅV, Söderholm JD, Myrelid P, Shankar EM, Nyström S, Larsson M
eLife 2020 Sep 2;9
eLife 2020 Sep 2;9
CD19-CAR-T Cells Bearing a KIR/PD-1-Based Inhibitory CAR Eradicate CD19(+)HLA-C1(-) Malignant B Cells While Sparing CD19(+)HLA-C1(+) Healthy B Cells.
Tao L, Farooq MA, Gao Y, Zhang L, Niu C, Ajmal I, Zhou Y, He C, Zhao G, Yao J, Liu M, Jiang W
Cancers 2020 Sep 13;12(9)
Cancers 2020 Sep 13;12(9)
In Situ Maturation and Tissue Adaptation of Type 2 Innate Lymphoid Cell Progenitors.
Zeis P, Lian M, Fan X, Herman JS, Hernandez DC, Gentek R, Elias S, Symowski C, Knöpper K, Peltokangas N, Friedrich C, Doucet-Ladeveze R, Kabat AM, Locksley RM, Voehringer D, Bajenoff M, Rudensky AY, Romagnani C, Grün D, Gasteiger G
Immunity 2020 Oct 13;53(4):775-792.e9
Immunity 2020 Oct 13;53(4):775-792.e9
Cell-type-specific 3D epigenomes in the developing human cortex.
Song M, Pebworth MP, Yang X, Abnousi A, Fan C, Wen J, Rosen JD, Choudhary MNK, Cui X, Jones IR, Bergenholtz S, Eze UC, Juric I, Li B, Maliskova L, Lee J, Liu W, Pollen AA, Li Y, Wang T, Hu M, Kriegstein AR, Shen Y
Nature 2020 Nov;587(7835):644-649
Nature 2020 Nov;587(7835):644-649
A Multiplex Human Pluripotent Stem Cell Platform Defines Molecular and Functional Subclasses of Autism-Related Genes.
Cederquist GY, Tchieu J, Callahan SJ, Ramnarine K, Ryan S, Zhang C, Rittenhouse C, Zeltner N, Chung SY, Zhou T, Chen S, Betel D, White RM, Tomishima M, Studer L
Cell stem cell 2020 Jul 2;27(1):35-49.e6
Cell stem cell 2020 Jul 2;27(1):35-49.e6
The CD38/NAD/SIRTUIN1/EZH2 Axis Mitigates Cytotoxic CD8 T Cell Function and Identifies Patients with SLE Prone to Infections.
Katsuyama E, Suarez-Fueyo A, Bradley SJ, Mizui M, Marin AV, Mulki L, Krishfield S, Malavasi F, Yoon J, Sui SJH, Kyttaris VC, Tsokos GC
Cell reports 2020 Jan 7;30(1):112-123.e4
Cell reports 2020 Jan 7;30(1):112-123.e4
PD-1 Blockade Reinvigorates Bone Marrow CD8(+) T Cells from Patients with Multiple Myeloma in the Presence of TGFβ Inhibitors.
Kwon M, Kim CG, Lee H, Cho H, Kim Y, Lee EC, Choi SJ, Park J, Seo IH, Bogen B, Song IC, Jo DY, Kim JS, Park SH, Choi I, Choi YS, Shin EC
Clinical cancer research : an official journal of the American Association for Cancer Research 2020 Apr 1;26(7):1644-1655
Clinical cancer research : an official journal of the American Association for Cancer Research 2020 Apr 1;26(7):1644-1655
Tissue-resident Eomes(+) NK cells are the major innate lymphoid cell population in human infant intestine.
Sagebiel AF, Steinert F, Lunemann S, Körner C, Schreurs RRCE, Altfeld M, Perez D, Reinshagen K, Bunders MJ
Nature communications 2019 Feb 28;10(1):975
Nature communications 2019 Feb 28;10(1):975
Unique transcriptional and protein-expression signature in human lung tissue-resident NK cells.
Marquardt N, Kekäläinen E, Chen P, Lourda M, Wilson JN, Scharenberg M, Bergman P, Al-Ameri M, Hård J, Mold JE, Ljunggren HG, Michaëlsson J
Nature communications 2019 Aug 26;10(1):3841
Nature communications 2019 Aug 26;10(1):3841
Autophagy Regulation of Metabolism Is Required for CD8(+) T Cell Anti-tumor Immunity.
DeVorkin L, Pavey N, Carleton G, Comber A, Ho C, Lim J, McNamara E, Huang H, Kim P, Zacharias LG, Mizushima N, Saitoh T, Akira S, Beckham W, Lorzadeh A, Moksa M, Cao Q, Murthy A, Hirst M, DeBerardinis RJ, Lum JJ
Cell reports 2019 Apr 9;27(2):502-513.e5
Cell reports 2019 Apr 9;27(2):502-513.e5
MAIT cells are activated in acute Dengue virus infection and after in vitro Zika virus infection.
Paquin-Proulx D, Avelino-Silva VI, Santos BAN, Silveira Barsotti N, Siroma F, Fernandes Ramos J, Coracini Tonacio A, Song A, Maestri A, Barros Cerqueira N, Felix AC, Levi JE, Greenspun BC, de Mulder Rougvie M, Rosenberg MG, Nixon DF, Kallas EG
PLoS neglected tropical diseases 2018 Jan;12(1):e0006154
PLoS neglected tropical diseases 2018 Jan;12(1):e0006154
Effect of Cytomegalovirus (CMV) and Ageing on T-Bet and Eomes Expression on T-Cell Subsets.
Hassouneh F, Lopez-Sejas N, Campos C, Sanchez-Correa B, Tarazona R, Pera A, Solana R
International journal of molecular sciences 2017 Jun 29;18(7)
International journal of molecular sciences 2017 Jun 29;18(7)
Fetal CD103+ IL-17-Producing Group 3 Innate Lymphoid Cells Represent the Dominant Lymphocyte Subset in Human Amniotic Fluid.
Marquardt N, Ivarsson MA, Sundström E, Åkesson E, Martini E, Eidsmo L, Mjösberg J, Friberg D, Kublickas M, Ek S, Tegerstedt G, Seiger Å, Westgren M, Michaëlsson J
Journal of immunology (Baltimore, Md. : 1950) 2016 Oct 15;197(8):3069-3075
Journal of immunology (Baltimore, Md. : 1950) 2016 Oct 15;197(8):3069-3075
Cutting edge: identification and characterization of human intrahepatic CD49a+ NK cells.
Marquardt N, Béziat V, Nyström S, Hengst J, Ivarsson MA, Kekäläinen E, Johansson H, Mjösberg J, Westgren M, Lankisch TO, Wedemeyer H, Ellis EC, Ljunggren HG, Michaëlsson J, Björkström NK
Journal of immunology (Baltimore, Md. : 1950) 2015 Mar 15;194(6):2467-71
Journal of immunology (Baltimore, Md. : 1950) 2015 Mar 15;194(6):2467-71
Arming of MAIT Cell Cytolytic Antimicrobial Activity Is Induced by IL-7 and Defective in HIV-1 Infection.
Leeansyah E, Svärd J, Dias J, Buggert M, Nyström J, Quigley MF, Moll M, Sönnerborg A, Nowak P, Sandberg JK
PLoS pathogens 2015 Aug;11(8):e1005072
PLoS pathogens 2015 Aug;11(8):e1005072
Human Th1 cells that express CD300a are polyfunctional and after stimulation up-regulate the T-box transcription factor eomesodermin.
Narayanan S, Silva R, Peruzzi G, Alvarez Y, Simhadri VR, Debell K, Coligan JE, Borrego F
PloS one 2010 May 13;5(5):e10636
PloS one 2010 May 13;5(5):e10636
No comments: Submit comment
Supportive validation
- Submitted by
- Invitrogen Antibodies (provider)
- Main image

- Experimental details
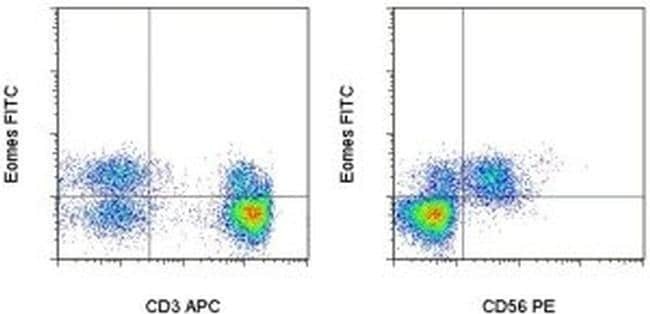
- Intracellular staining of normal human peripheral blood cells with Anti-Human CD3 APC (Product # 17-0037-42) (left), Anti-Human CD56 (NCAM) PE (Product # 12-0567-42) (right), and Anti-Human Eomes FITC using the Foxp3/Transcription Factor Buffer Set (Product # 00-5523-00) and protocol. Cells in the lymphocyte gate were used for analysis.
- Conjugate
- Green dye
Supportive validation
- Submitted by
- Invitrogen Antibodies (provider)
- Main image

- Experimental details
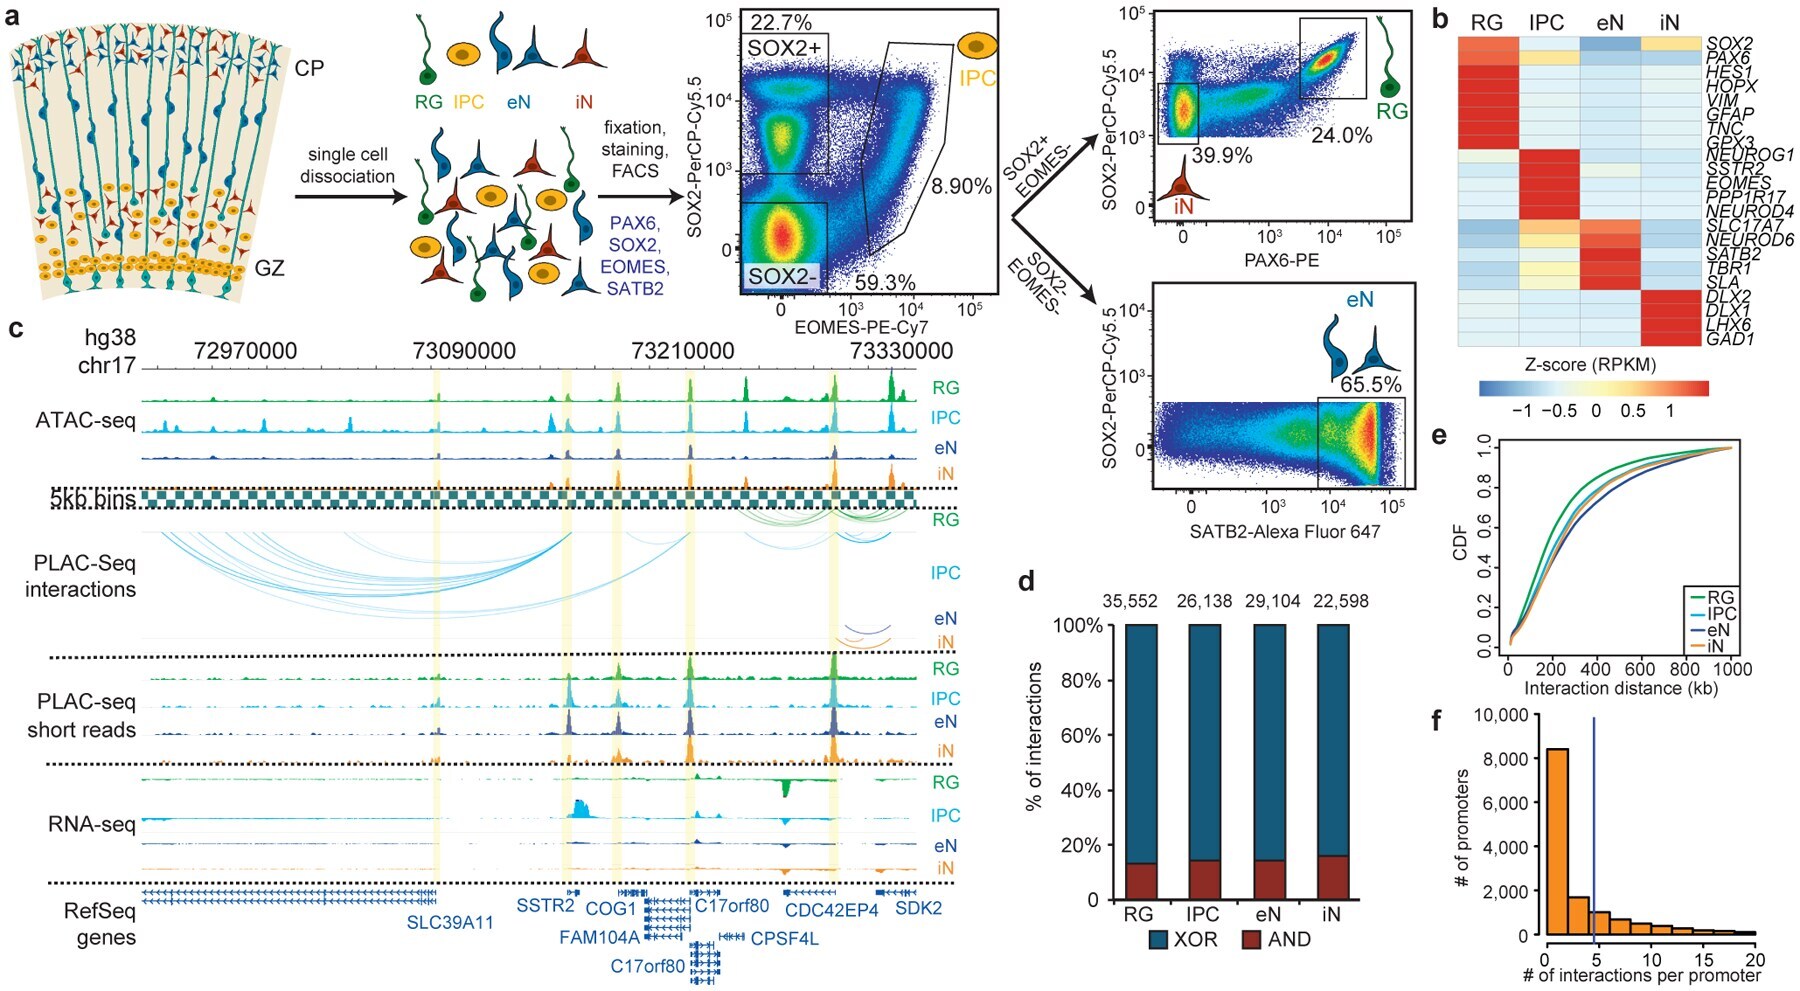
- Figure 1. Experimental design and features of 3D epigenomes during human corticogenesis. ( a ) Schematic of the sorting strategy. Microdissected GZ and CP samples were dissociated into single cells prior to being fixed, stained with antibodies for PAX6, SOX2, EOMES, and SATB2, and sorted using FACS. ( b ) Heatmap displaying the expression of key marker genes for each cell type. ( c ) WashU Epigenome Browser snapshot displaying a region (chr17: 72,970,000-73,330,000) with interactions linked to SSTR2 expression in IPCs. ( d ) Bar graph of interaction counts for each cell type, with the proportions of anchor to anchor (red) and anchor to non-anchor (blue) interactions highlighted. ( e ) Cumulative distribution function (CDF) plots of interaction distances for each cell type. ( f ) Histogram displaying the numbers of interactions for interacting promoters across all cell types.
- Conjugate
- Green dye
- Submitted by
- Invitrogen Antibodies (provider)
- Main image
- Experimental details
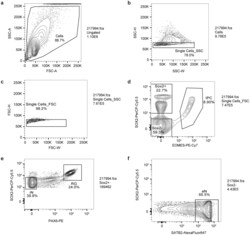
- Extended Data Figure 1. Representative contour plots depicting FACS gating strategy. ( a ) Cells were separated from debris of various sizes based on the forward scatter area (FSC-A) and side scatter area (SSC-A). Specifically, they were passed through two singlet gates using the width and height metrics of the ( b ) side scatter (SSC-H versus SSC-W) and ( c ) forward scatter (FSC-H versus FSC-W). ( d ) SOX2+, and SOX2-, and intermediate progenitor (IPC) populations were isolated by gating on EOMES-PE-Cy7 and SOX2-PerCP-Cy5.5 staining. ( e ) Radial glia (RG) and interneurons (iNs) were isolated based on high PAX6/high SOX2 and medium SOX2/low PAX6 staining, respectively. ( f ) Excitatory neurons (eNs) were isolated from the SOX2- population by gating on SATB2-Alexa Fluor 647 staining.
- Conjugate
- Green dye

- Submitted by
- Invitrogen Antibodies (provider)
- Main image
- Experimental details
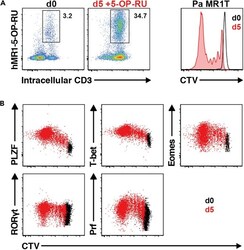
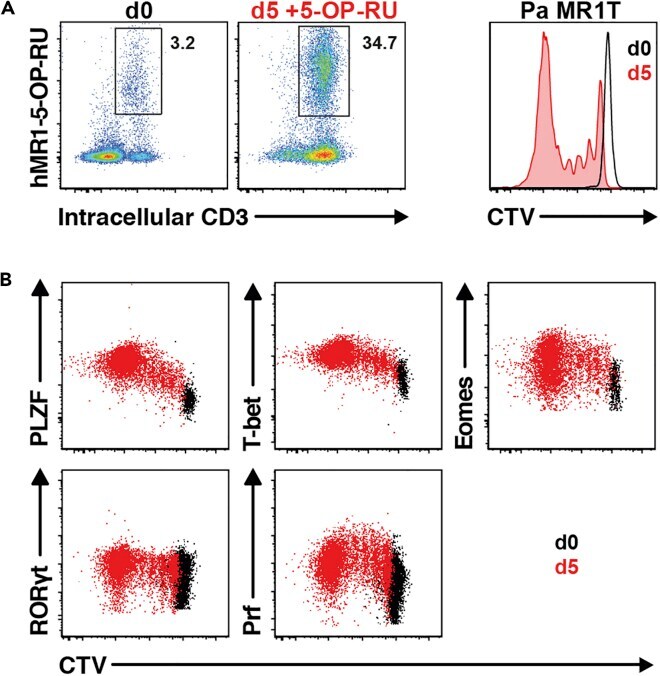
- Figure 13 Pa MR1T cell antigen-specific proliferation assay (A) Representative FACS plots showing frequencies of Pa MR1T cells (defined as CD3 + hMR1-5-OP-RU + ) and CTV dilution on day 0 and day 5 of culture with 5-OP-RU from a single Pa donor. (B) Representative FACS plots showing the expression levels of different transcription factors (PLZF, T-bet, Eomes, and RORgammat) and Perforin against CTV at the two different timepoints. Figure adapted and reprinted with permission from ().
- Conjugate
- Green dye
- Submitted by
- Invitrogen Antibodies (provider)
- Main image
- Experimental details
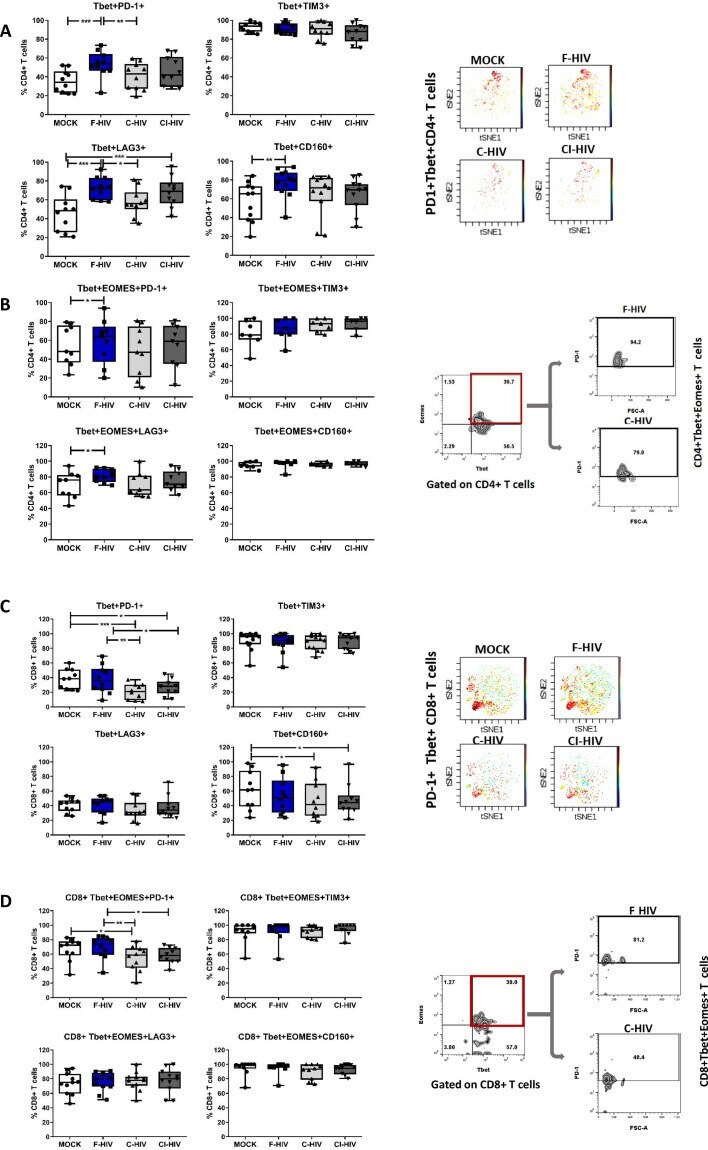
- Figure 6. HIV exposure modulated transcriptional regulation of mucosal T cells. Mucosal immune cells isolated from the colorectal tissue biopsies by enzymatic digestion were exposed to HIV-1 BaL (250 ng/mL), either free (F-HIV), complement-opsonized (C-HIV), or virions opsonized by a cocktail of complement and antibodies (CI-HIV) or mock-treated, by spinning the cultures. The effect HIV exposure had on mucosal T cells phenotype was assessed after 4 days. ( A-D ) The immune cells were stained with CD3, CD4, CD8, Tbet, EOMES, PD-1, LAG3, TIM3, and CD160 mAbs. ( A ) Percentage of unexposed, F-HIV, C-HIV, or CI-HIV exposed Tbet+CD4+ T cells expressing PD-1, TIM3, LAG3 or CD160. viSNE plot of PD-1+Tbet+CD4+ was constructed on CD4 T cells, data presented as dot plots with colored channels. Data from a donor shows CD4 T cells, subjected to tSNE algorithm, which provides cells with a unique coordinate according to its expression of PD-1+T-bet+ parameters, displayed on a two-dimensional plot (tSNE1 versus tSNE2). The heat gradient (blue to red) indicates expression level of Tbet+PD-1+ on CD4 following exposure to different conditions of viruses. ( B ) Percentage of unexposed, F-HIV, C-HIV, or CI-HIV exposed Tbet+EOMES+ CD4+ T cells expressing PD-1, TIM3, LAG3 or CD160 were assessed by flow cytometry. Flow cytometry Zebra plots for Tbet+EOMES+ CD4+ T cells expressing PD-1. ( C ) Percentage of Tbet+CD8+ T cells expressing PD-1, TIM3, LAG3 or CD160. viSNE plot of PD-1+Tbet+CD8+ was const
- Conjugate
- Green dye
- Submitted by
- Invitrogen Antibodies (provider)
- Main image
- Experimental details
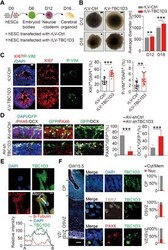
- Fig. 1 Overexpression of TBC1D3 induces human cerebral organoid expansion. ( A ) Schematic diagram for human cerebral organoid culture. ( B ) Analysis for the size of organoids (Ctrl, 6 organoids in D12 and 15 in D18; TBC1D3, 11 organoids in D12 and 17 in D18). Scale bars, 100 mum. ( C ) Analysis for the percentage of KI67 + or P-VIM + cells in D18 organoids (14 neuroepithelial rosettes from 6 control organoids; 16 rosettes from 8 TBC1D3 organoids). Scale bar, 20 mum. ( D ) Analysis for the percentage of PAX6 + (white arrowheads) or DCX + (yellow arrowheads) cells among GFP + cells in D40 organoids infected with adenovirus (AV) expressing shTBC1D3 or shCtrl. Scale bar, 20 mum. shCtrl, 23 rosettes from 15 organoids; shTBC1D3, 19 rosettes from 13 organoids. ( E ) TBC1D3 distribution in ReN cells. Scale bar, 10 mum. ( F ) Immunostaining for PAX6, TBR2, and TBC1D3 in GW15.5 fetal human cortex. Scale bars, 200 mum (left) and 5 mum (magnified). Histograms show the percentage of cells with TBC1D3 enriched in cytoplasm/membrane (Cyt/Mem; gray arrows) or nucleus (Nuc; red arrows). Five regions for cortical plate (CP) or OSVZ; six regions for VZ/ISVZ from three slices. Data are presented as means +- SD, unpaired Student's t test. ** P < 0.01; *** P < 0.001.
- Conjugate
- Green dye

- Submitted by
- Invitrogen Antibodies (provider)
- Main image

- Experimental details
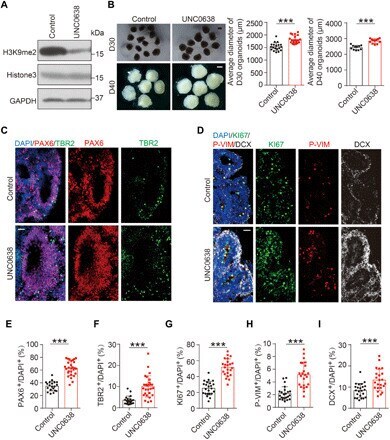
- Fig. 3 Effects of G9a inhibition on cortical expansion in human cerebral organoids. ( A ) Levels of H3K9me2 in D16 cerebral organoids treated with G9a inhibitor UNC0638 or DMSO control, determined by IB. ( B ) Representative images of D30 and D40 cerebral organoids treated with UNC0638 or vehicle control and quantification for the average diameter. Numbers of organoids analyzed: D30, 19 organoids for control and 20 organoids for UNC0638 group; D40, 11 organoids for control and 12 organoids for UNC0638 group. Scale bar, 1000 mum. ( C ) Immunostaining for signals of PAX6, TBR2, and DAPI in D30 organoids treated with UNC0638 or DMSO. Scale bar, 50 mum. ( D ) Immunostaining for signals of KI67, P-VIM, and DCX in D30 organoids treated with UNC0638 or DMSO control, with DAPI marking cell nucleus. Scale bar, 50 mum. ( E and F ) Quantification for the percentage of PAX6 + cells (E) or TBR2 + cells (F) among DAPI + cells (20 rosettes from 14 control organoids; 31 rosettes from 17 UNC0638-treated organoids). ( G to I ) Quantification for the percentage of KI67 + (G), P-VIM + (H), or DCX + cells (I). Twenty-three rosettes from 15 organoids were analyzed in each group. Data are presented as means +- SD, unpaired Student's t test. *** P < 0.001.
- Conjugate
- Green dye
- Submitted by
- Invitrogen Antibodies (provider)
- Main image

- Experimental details
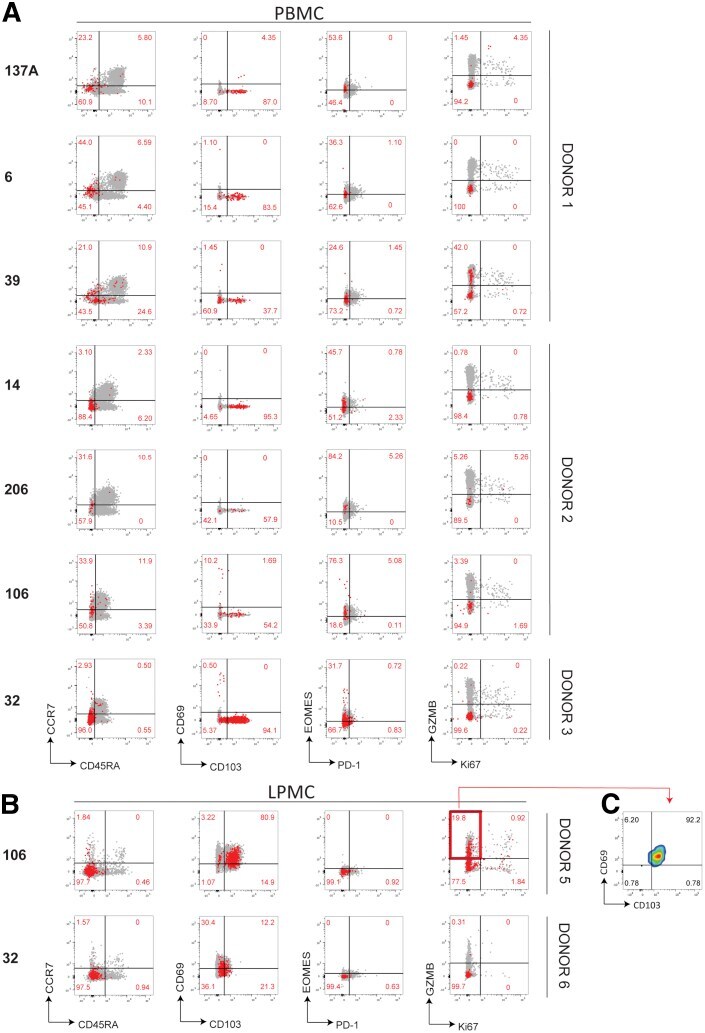
- Figure 7 Phenotypic characterization of NoV-specific CD8 + T cells. ( A ) PBMCs or ( B ) LPMCs were stained with tetramers and a panel of antibodies against memory, homing, exhaustion, proliferation, and cytotoxicity markers. Total live CD8 + T cells are shown in grey with Tet + cells overlayed in red . Representative of 3 independent experiments.
- Conjugate
- Green dye
- Submitted by
- Invitrogen Antibodies (provider)
- Main image

- Experimental details
- Figure 3 Subset defining genes of lamina propria CD8 + CD69 + CD103 - and CD8 + CD69 + CD103 + T cells. ( A ) Volcano plot of the expressed genes, with a nominal P value 0.25 and -log10 P > 10 x 10 -2.5 , green indicates genes with a log2FC >0.25 and -log10 P < 10 x 10 -2.5 . ( B ) Representative flowcytometric dotplots, including Fluorescence Minus One (FMO) control, of Itgb2, GzmK, KLRG1, and EOMES (upper row) and quantification of the respective marker (lower row) comparing lamina propria CD8 + CD69 + CD103 + and CD103 - T cells in healthy control subjects (n = 6-7; circles), CD patients from inflamed (diamonds) and noninflamed (triangles) ileum (paired, n = 4-6). Bars represent median and interquartile range. Comparison was performed with a paired 1-tailed t test. NS, not significant.
- Conjugate
- Green dye

- Submitted by
- Invitrogen Antibodies (provider)
- Main image
- Experimental details
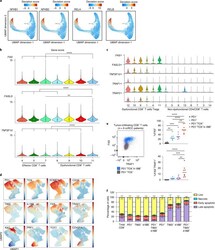
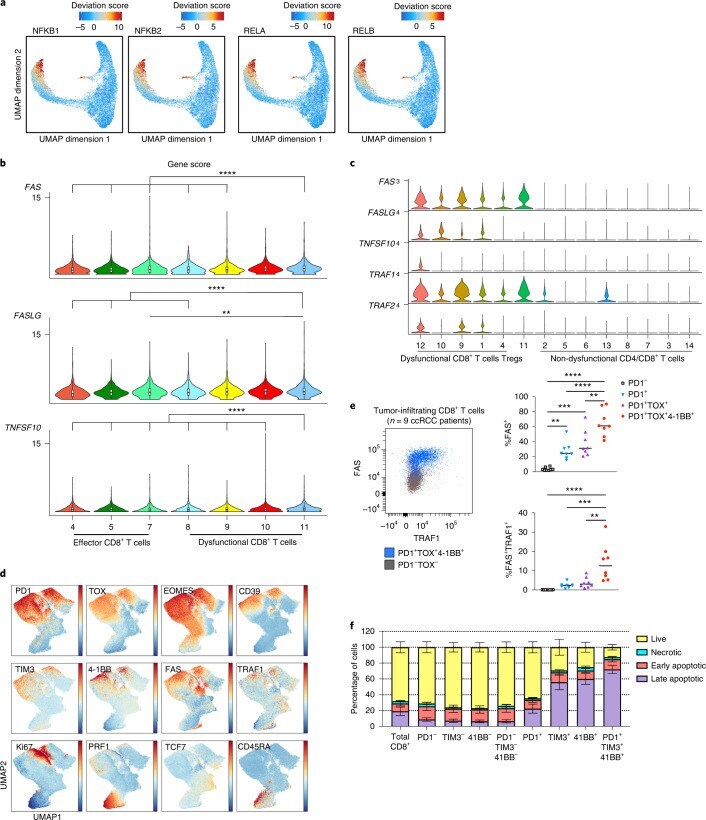
- Fig. 4 NF-kappaB drives a pro-apoptotic program in late dysfunctional CD8 + T cells infiltrating ccRCC. a , UMAP projection of scATAC-seq profiles colored by chromVAR TF motif bias-corrected deviations of the indicated TFs (NFKB1/2 and RELA/B were significantly enriched in C11_CD8 compared with the other CD8 T cell clusters; two-sided Wilcoxon rank-sum test P < 2.2 x 10 -16 , n = 18,736 cells). b , Violin plots of gene activity scores of the indicated NF-kappaB transcriptional targets for effector/nondysfunctional (C4,5,7_CD8) and dysfunctional (C8,9,10,11_CD8) T cell clusters. Pairwise comparisons of gene activity scores for the indicated gene between specified T cell clusters were determined using a two-sided Wilcoxon rank-sum test. The resulting P values underwent multi-test correction with the FDR method (**adjusted P < 0.01, ****adjusted- P < 0.0001; raw adjusted P values are listed in the source data; for clusters 4, 5, 7, 8, 9, 10, 11, n = 1,810, 1,821, 873, 924, 1,775, 2,440 and 1,613 cells, respectively). c , Violin plots showing gene expression levels of the indicated NF-kappaB transcriptional targets in CD4 + and CD8 + clusters, clustered as indicated in Fig. 3a (for clusters 1, 2, 3, 4, 5, 6, 7, 8, 9, 10, 11, 12, 13 and 14, n = 8,677, 7,423, 5,390, 5,272, 4,469, 4,160, 3,974, 3,689, 1,080, 890, 751, 669, 618 and 328 cells, respectively). d , Flow cytometry analysis of tumor-infiltrating CD8 + T cells. UMAP projection of expression of selected T cell markers in CD8
- Conjugate
- Green dye
- Submitted by
- Invitrogen Antibodies (provider)
- Main image

- Experimental details
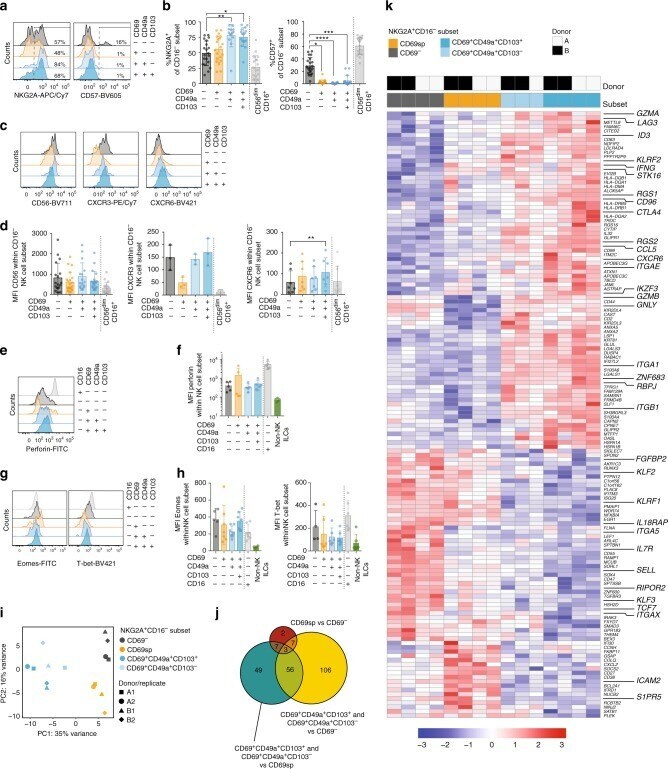
- Fig. 2 Human CD69 + CD16 - lung NK cell subsets have unique characteristics. a Representative overlays and b summary of data of expression of NKG2A and CD57 on CD16 - human lung CD69 - CD49a - CD103 - ( n = 20 for both), CD69sp ( n = 20 for both), CD69 + CD49a + CD103 - ( n = 14 and n = 13, respectively), and CD69 + CD49a + CD103 + ( n = 17 and n = 15, respectively) NK cells. CD56 dim CD16 + NK cells are shown for comparison ( n = 20 and n = 19, respectively). Numbers in a indicate %NKG2A + and %CD57 + NK cells, respectively. c Representative overlays and d summary of mean fluorescence intensity (MFI) of CD56 ( n = 18 for CD16 - CD69 - CD49a - CD103 - NKG2A + CD57 - , n = 21 for CD69 + CD49a - CD103 - CD16 - , n = 16 for CD69 + CD49a + CD103 - CD16 - , n = 19 for CD69 + CD49a + CD103 + CD16 - , and n = 20 for CD56 dim CD16 + ), CXCR3 ( n = 3) and CXCR6 ( n = 7) on human lung CD69 - CD49a - CD103 - NKG2A + CD57 - , CD69sp, CD69 + CD49a + CD103 - , and CD69 + CD49a + CD103 + NK cells within the CD16 - subset. e Representative overlay and f summary of MFI of perforin expression in CD16 - CD69 - CD49a - CD103 - NKG2A + CD57 - , CD69spCD16 - , CD69 + CD49a + CD103 - CD16 - , CD69 + CD49a + CD103 + CD16 - , and CD69 - CD49a - CD103 - CD16 + NK cells in human lung ( n = 5). CD127 + CD161 + cells from lung tissue are shown as a comparison ( n = 5). g Representative overlays and h summary of MFI of Eomes (left panel) (CD16 - CD69
- Conjugate
- Green dye
- Submitted by
- Invitrogen Antibodies (provider)
- Main image
- Experimental details
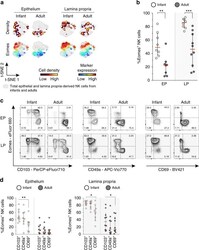
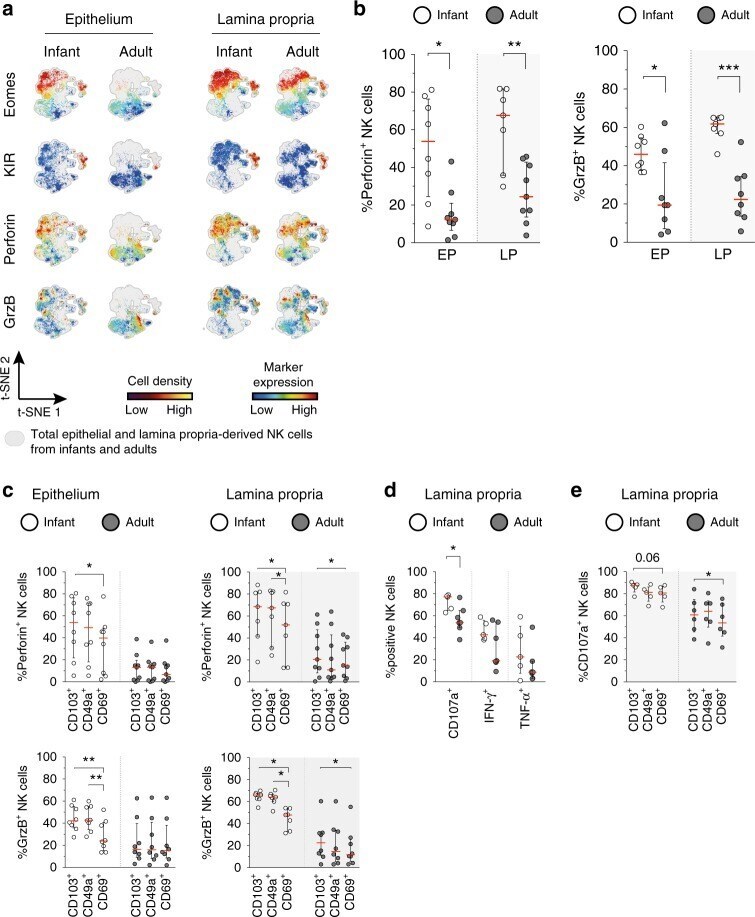
- Fig. 5 High expression of Eomes in infant intestinal NK cells. a viSNE plots of combined flow cytometric data visualizing Eomes expression of infant and adult NK cells from epithelium (EP) and lamina propria (LP) intestinal tissues. Cell density of clusters is shown in first row. Expression of Eomes is shown by color coding in relative intensity in second row. viSNE plots have been calculated from concatenated FCS files gated on NK cells (infant samples N = 7, adult samples N = 5, iterations = 7500 perplexity = 100, KL divergence = 2.62). b Frequencies of EP and LP-derived infant (white circles) and adult (dark circles) Eomes + NK cells. c Representative flow cytometric plots showing co-expression of Eomes and tissue-residency markers (CD103, CD49a, CD69) in NK cells from EP and LP of infant and adult intestines. d Frequencies of Eomes + NK cells within CD103 + , CD49a + , or CD69 + NK cell populations in EP and LP of infants (white circles) and adults (dark circles) (infant samples N = 8 (EP and LP), adult samples N = 8 (EP), and N = 10 (LP)). Median frequencies indicated by red lines. Error bars define interquartile ranges between 75th and 25th percentiles. Statistical comparisons are Mann-Whitney U comparisons ( b ) and Wilcoxon matched-pairs signed rank tests ( d ). Asterisks represent the following p -values: * p < 0.05; ** p < 0.01; and *** p < 0.001
- Conjugate
- Green dye

- Submitted by
- Invitrogen Antibodies (provider)
- Main image

- Experimental details
- Fig. 6 Infant intestinal NK cells contain high levels of cytotoxic granules. a viSNE plots of combined flow cytometric data visualizing Eomes, perforin, granzyme B, and KIR expression by epithelial (EP) and lamina propria-derived (LP) infant and adult NK cells. Expression of Eomes, KIR, perforin, and granzyme B (GrzB) is shown by color coding in relative intensity. viSNE plots have been calculated from concatenated FCS files gated on NK cells (infant samples N = 7, adult samples N = 5, iterations = 7500 perplexity = 100, KL divergence = 2.62). b Frequencies of perforin + and GrzB + NK cells in infants (white circles) and adults (dark circles) (EP infant samples ( N = 8), LP infant samples ( N = 7), EP adult samples perforin expression ( N = 9), GrzB expression ( N = 8), LP adult samples perforin expression ( N = 9), and GrzB expression ( N = 8)). c Frequencies of perforin + and granzyme B + cells within CD103 + , CD49a + , or CD69 + NK cell populations in infant (white circles) and adult intestines (dark circles) (EP infant samples ( N = 8), LP infant samples ( N = 7), EP adult samples perforin expression ( N = 9), and GrzB expression ( N = 8), LP adult samples perforin expression ( N = 9), and GrzB expression ( N = 8)). d Frequencies of LP-derived CD107a + , IFN-g + , and TNF-alpha + NK cells in infant (white circles) and adult intestines (dark circles). Cells were stimulated for 6 h with phorbol 12-myristate 13-acetate (PMA) and ionomycin (infant samples N = 5, adult sample
- Conjugate
- Green dye
- Submitted by
- Invitrogen Antibodies (provider)
- Main image

- Experimental details
- Figure 3 Characteristics of iKP-19-CAR-T cells and CD19-CAR-T cells. iKP-19-CAR-T cells or CD19-CAR-T cells were cultured for 10 days in X-VIVO media supplemented with 100 U/mL IL-2. ( A ) The expression of T cell differentiation markers in CAR-T cells was analyzed by flow cytometry using PE/Cy7-anti-human CCR7 antibody, PE-anti-human-CD45RO antibody and PE-anti-human GzmB antibody ( n = 4 different donors). ( B ) The frequency of naive (T N ; CCR7 + CD45RA + ), T CM (CCR7 + CD45RA - ), effector memory (T EM ; CCR7 - CD45RA - ) or effector (T E ; CCR7 - CD45RA + ) T cells were analyzed by flow cytometry using PE/Cy7-anti-human CCR7 antibody and FITC-anti-human CD45RA antibody ( n = 4 different donors). ( C ) The expression of transcription factor Eomes in CAR-T cells was analyzed by flow cytometry using FITC-anti-human Eomes antibody ( n = 4 different donors). ( D ) The expression of transcription factor T-bet in CAR-T cells was analyzed by flow cytometry using PE-anti-human T-bet antibody ( n = 4 different donors). ( E ) The expression of T cell exhaustion marker PD-1 in CAR-T cells was analyzed by flow cytometry using FITC-anti-human PD-1 antibody ( n = 4 different donors). All experiments were performed in triplicate manner using PBMCs from each donor and MFI or percentage was statistically analyzed. * p < 0.05, ** p < 0.01, *** p < 0.001. Error bars represent +- SD.
- Conjugate
- Green dye

- Submitted by
- Invitrogen Antibodies (provider)
- Main image
- Experimental details
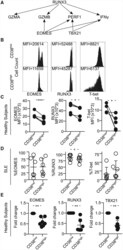
- Figure 4. CD8CD38 high T Cells Express Decreased Levels of EOMES, RUNX3, and T-bet (A) Scheme showing the transcription factors regulating various cytotoxic molecules. (B) Representative histograms showing EOMES, RUNX3, and T-bet in CD8CD38 low and CD38 high T cells from a healthy donor by flow cytometry. (C) MFI from EOMES, RUNX3, and T-bet in CD8CD38 low and CD8CD38 high T cells from by flow cytometry (healthy subjects >=3; paired t test). (D) Percentage of EOMES, RUNX3, and T-bet in CD8CD38 low and CD8CD38 high T cells by flow cytometry (SLE = 6; paired t test). (E) mRNA levels of EOMES, RUNX3, and T-bet (TBX21) in CD8CD38 low and CD8CD38 high T cells by flow cytometry (normal T cells = 10; Kolmogorov-Smirnov test). Cells were sorted by FACS aria. In all figures, average data are represented as mean +- SD.
- Conjugate
- Green dye

- Submitted by
- Invitrogen Antibodies (provider)
- Main image

- Experimental details
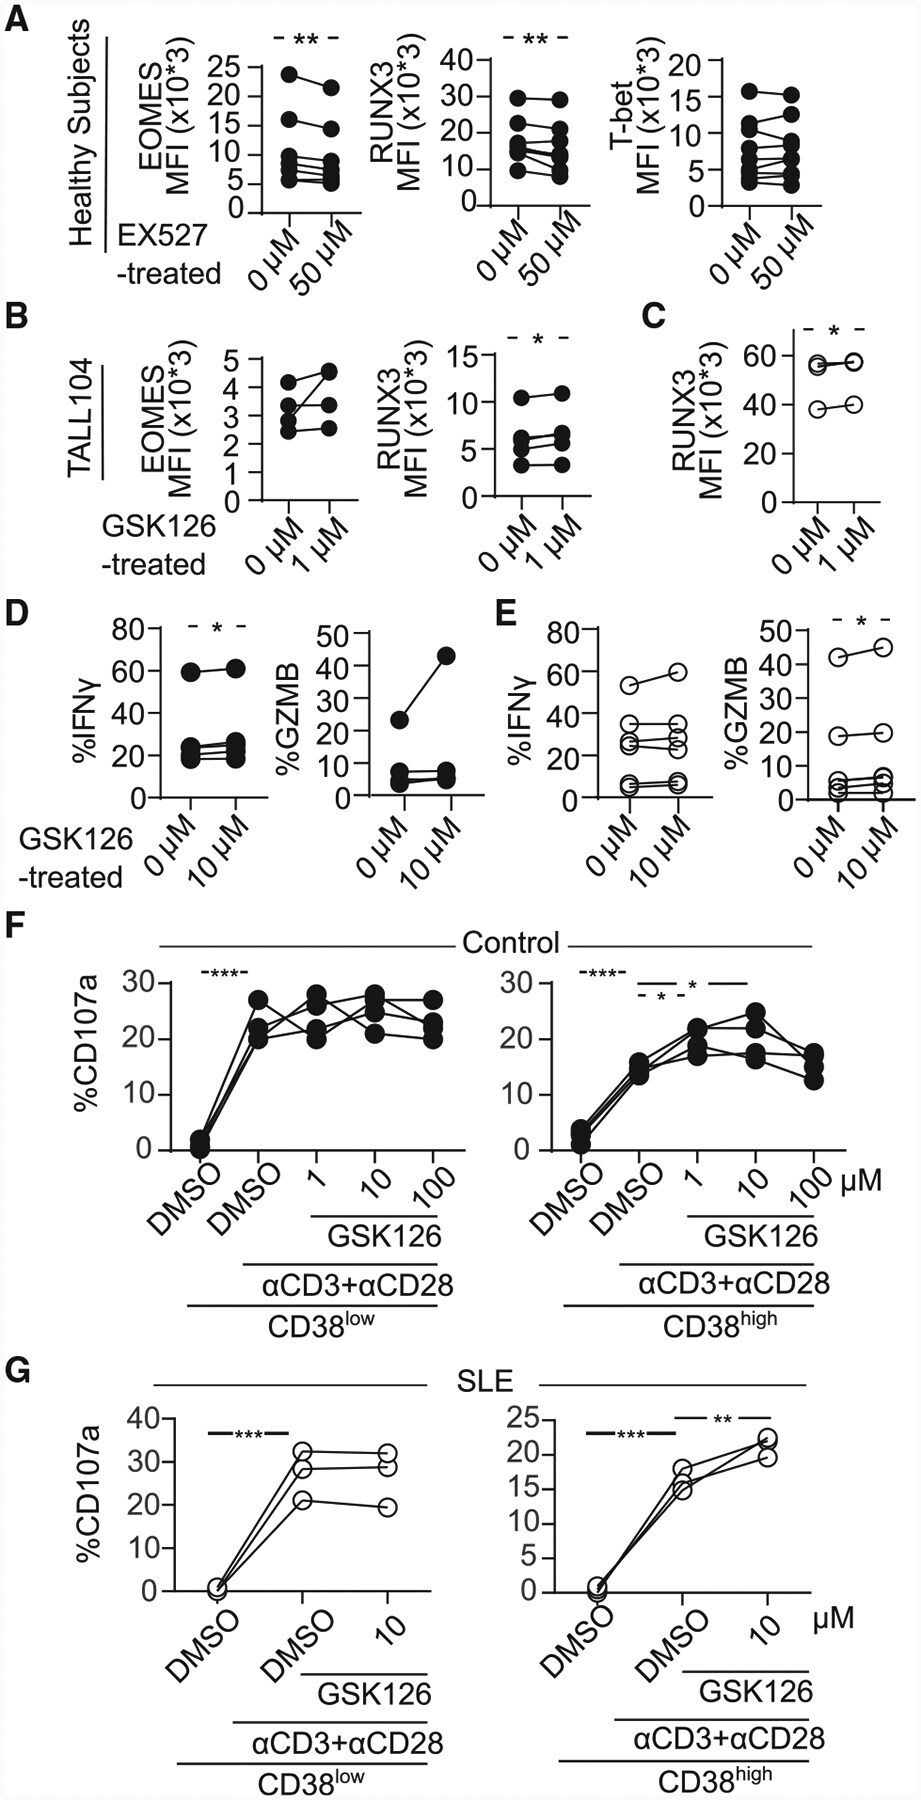
- Figure 6. Inhibition of Sirtuin1/EZH2 Axis Restores CD8 Cytotoxicity (A) MFI from EOMES, RUNX3, and T-bet in CD8 T cells pretreated with 50 muM of EX527 (SIRT1 inhibitor) overnight by flow cytometry (healthy subjects = 7; paired t test). (B) MFI from EOMES and RUNX3 in TALL104 CD8 T cells pretreated with 1 muM of GSK126 (EZH2 inhibitor) overnight by flow cytometry (n = 4, 3 independent experiments; paired t test). (C) MFI from RUNX3 in CD8 T cells in patients with SLE pretreated with 1 muM of GSK126 overnight by flow cytometry (SLE = 4; paired t test). (D and E) Percentage of IFN-gamma and GZMB in CD8CD38 low or CD8CD38 high T cells from healthy controls (D) and from patients with SLE (E) treated with 1 muM of GSK126 overnight by flow cytometry (healthy subjects = 5, shown in closed circle, SLE = 6, shown in opened circle; paired t test). (F and G) Degranulation (%CD107a) of CD8CD38 low or CD8CD38 high T cells from healthy subjects (F) and from patients with SLE (G) treated with GSK126 overnight and stimulated with plate-coated CD3/CD28 antibodies for 5 h with GSK126 at the indicated concentration (n = 4, one-way ANOVA with multiple comparisons).
- Conjugate
- Green dye