 Explore
 Validate
 Learn
Learn Flow cytometry
Antibody data
- Antibody Data
- Antigen structure
- References [14]
- Comments [0]
- Validations
- Flow cytometry [1]
- Other assay [10]
Submit
Validation data
Reference
Comment
Report error
- Product number
- 46-3249-82 - Provider product page

- Provider
- Invitrogen Antibodies
- Product name
- CD324 (E-Cadherin) Monoclonal Antibody (DECMA-1), PerCP-eFluor™ 710, eBioscience™
- Antibody type
- Monoclonal
- Antigen
- Other
- Description
- Description: The monoclonal antibody DECMA-1 recognizes mouse, human and canine CD324 also known as E-cadherin (Epithelial cadherin) or uvomorulin. Like the other cadherin family members P and N cadherin, E-cadherin is a transmembrane glycoprotein involved in intercellular adhesion. These proteins share a common basic structure. The extracellular portions of the proteins are largely composed of repeating domains, each with two consensus Ca2+-binding motifs. The cytoplasmic domain interacts with a-, b-, and g-catenins and actinins. These catenins connect E-cadherin with the cytoskeleton.
- Antibody clone number
- DECMA-1
- Concentration
- 0.2 mg/mL
Submitted references Fsp1-Mediated Lineage Tracing Fails to Detect the Majority of Disseminating Cells Undergoing EMT.
E-Cadherin Represses Anchorage-Independent Growth in Sarcomas through Both Signaling and Mechanical Mechanisms.
Pluripotency reprogramming by competent and incompetent POU factors uncovers temporal dependency for Oct4 and Sox2.
Differential requirements of androgen receptor in luminal progenitors during prostate regeneration and tumor initiation.
SOX2 regulates acinar cell development in the salivary gland.
Constitutively Active SMAD2/3 Are Broad-Scope Potentiators of Transcription-Factor-Mediated Cellular Reprogramming.
Alternative Routes to Induced Pluripotent Stem Cells Revealed by Reprogramming of the Neural Lineage.
Tumour stroma-derived lipocalin-2 promotes breast cancer metastasis.
Epithelial-to-mesenchymal transition induces cell cycle arrest and parenchymal damage in renal fibrosis.
Reprogramming Roadblocks Are System Dependent.
Human esophageal myofibroblasts secrete proinflammatory cytokines in response to acid and Toll-like receptor 4 ligands.
Single luminal epithelial progenitors can generate prostate organoids in culture.
Recruitment and activation of Rac1 by the formation of E-cadherin-mediated cell-cell adhesion sites.
Identification of a putative cell adhesion domain of uvomorulin.
Bornes L, van Scheppingen RH, Beerling E, Schelfhorst T, Ellenbroek SIJ, Seinstra D, van Rheenen J
Cell reports 2019 Nov 26;29(9):2565-2569.e3
Cell reports 2019 Nov 26;29(9):2565-2569.e3
E-Cadherin Represses Anchorage-Independent Growth in Sarcomas through Both Signaling and Mechanical Mechanisms.
Jolly MK, Ware KE, Xu S, Gilja S, Shetler S, Yang Y, Wang X, Austin RG, Runyambo D, Hish AJ, Bartholf DeWitt S, George JT, Kreulen RT, Boss MK, Lazarides AL, Kerr DL, Gerber DG, Sivaraj D, Armstrong AJ, Dewhirst MW, Eward WC, Levine H, Somarelli JA
Molecular cancer research : MCR 2019 Jun;17(6):1391-1402
Molecular cancer research : MCR 2019 Jun;17(6):1391-1402
Pluripotency reprogramming by competent and incompetent POU factors uncovers temporal dependency for Oct4 and Sox2.
Malik V, Glaser LV, Zimmer D, Velychko S, Weng M, Holzner M, Arend M, Chen Y, Srivastava Y, Veerapandian V, Shah Z, Esteban MA, Wang H, Chen J, Schöler HR, Hutchins AP, Meijsing SH, Pott S, Jauch R
Nature communications 2019 Aug 2;10(1):3477
Nature communications 2019 Aug 2;10(1):3477
Differential requirements of androgen receptor in luminal progenitors during prostate regeneration and tumor initiation.
Chua CW, Epsi NJ, Leung EY, Xuan S, Lei M, Li BI, Bergren SK, Hibshoosh H, Mitrofanova A, Shen MM
eLife 2018 Jan 15;7
eLife 2018 Jan 15;7
SOX2 regulates acinar cell development in the salivary gland.
Emmerson E, May AJ, Nathan S, Cruz-Pacheco N, Lizama CO, Maliskova L, Zovein AC, Shen Y, Muench MO, Knox SM
eLife 2017 Jun 17;6
eLife 2017 Jun 17;6
Constitutively Active SMAD2/3 Are Broad-Scope Potentiators of Transcription-Factor-Mediated Cellular Reprogramming.
Ruetz T, Pfisterer U, Di Stefano B, Ashmore J, Beniazza M, Tian TV, Kaemena DF, Tosti L, Tan W, Manning JR, Chantzoura E, Ottosson DR, Collombet S, Johnsson A, Cohen E, Yusa K, Linnarsson S, Graf T, Parmar M, Kaji K
Cell stem cell 2017 Dec 7;21(6):791-805.e9
Cell stem cell 2017 Dec 7;21(6):791-805.e9
Alternative Routes to Induced Pluripotent Stem Cells Revealed by Reprogramming of the Neural Lineage.
Jackson SA, Olufs ZP, Tran KA, Zaidan NZ, Sridharan R
Stem cell reports 2016 Mar 8;6(3):302-11
Stem cell reports 2016 Mar 8;6(3):302-11
Tumour stroma-derived lipocalin-2 promotes breast cancer metastasis.
Ören B, Urosevic J, Mertens C, Mora J, Guiu M, Gomis RR, Weigert A, Schmid T, Grein S, Brüne B, Jung M
The Journal of pathology 2016 Jul;239(3):274-85
The Journal of pathology 2016 Jul;239(3):274-85
Epithelial-to-mesenchymal transition induces cell cycle arrest and parenchymal damage in renal fibrosis.
Lovisa S, LeBleu VS, Tampe B, Sugimoto H, Vadnagara K, Carstens JL, Wu CC, Hagos Y, Burckhardt BC, Pentcheva-Hoang T, Nischal H, Allison JP, Zeisberg M, Kalluri R
Nature medicine 2015 Sep;21(9):998-1009
Nature medicine 2015 Sep;21(9):998-1009
Reprogramming Roadblocks Are System Dependent.
Chantzoura E, Skylaki S, Menendez S, Kim SI, Johnsson A, Linnarsson S, Woltjen K, Chambers I, Kaji K
Stem cell reports 2015 Sep 8;5(3):350-64
Stem cell reports 2015 Sep 8;5(3):350-64
Human esophageal myofibroblasts secrete proinflammatory cytokines in response to acid and Toll-like receptor 4 ligands.
Gargus M, Niu C, Vallone JG, Binkley J, Rubin DC, Shaker A
American journal of physiology. Gastrointestinal and liver physiology 2015 Jun 1;308(11):G904-23
American journal of physiology. Gastrointestinal and liver physiology 2015 Jun 1;308(11):G904-23
Single luminal epithelial progenitors can generate prostate organoids in culture.
Chua CW, Shibata M, Lei M, Toivanen R, Barlow LJ, Bergren SK, Badani KK, McKiernan JM, Benson MC, Hibshoosh H, Shen MM
Nature cell biology 2014 Oct;16(10):951-61, 1-4
Nature cell biology 2014 Oct;16(10):951-61, 1-4
Recruitment and activation of Rac1 by the formation of E-cadherin-mediated cell-cell adhesion sites.
Nakagawa M, Fukata M, Yamaga M, Itoh N, Kaibuchi K
Journal of cell science 2001 May;114(Pt 10):1829-38
Journal of cell science 2001 May;114(Pt 10):1829-38
Identification of a putative cell adhesion domain of uvomorulin.
Vestweber D, Kemler R
The EMBO journal 1985 Dec 16;4(13A):3393-8
The EMBO journal 1985 Dec 16;4(13A):3393-8
No comments: Submit comment
Supportive validation
- Submitted by
- Invitrogen Antibodies (provider)
- Main image
- Experimental details
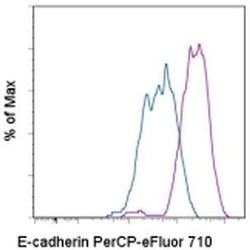
- Staining of the MDCK cell line with staining buffer (autofluorescence) (blue histogram) or 0.5 µg of Anti-Human CD324 (E-Cadherin) PerCP-eFluor® 710 (purple histogram). Total viable cells were used for analysis.

Supportive validation
- Submitted by
- Invitrogen Antibodies (provider)
- Main image
- Experimental details
- NULL

- Submitted by
- Invitrogen Antibodies (provider)
- Main image
- Experimental details
- NULL
- Submitted by
- Invitrogen Antibodies (provider)
- Main image

- Experimental details
- NULL
- Submitted by
- Invitrogen Antibodies (provider)
- Main image
- Experimental details
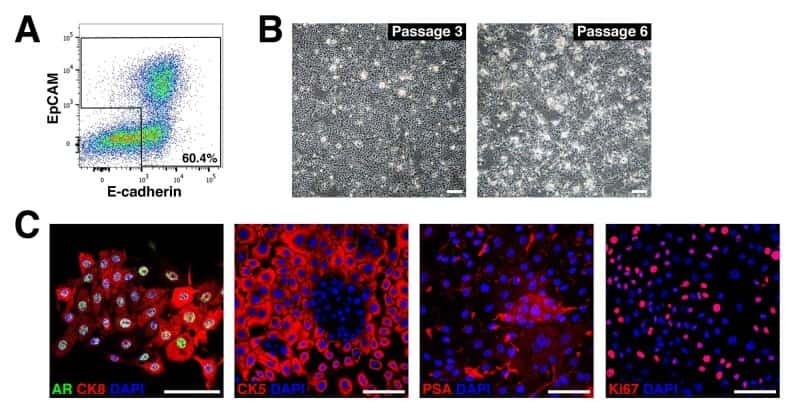
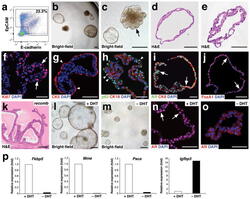
- Figure 2 Growth and androgen-responsiveness of prostate organoids from normal prostate epithelium. ( a ) Flow-sorting strategy to eliminate EpCAM - E-cadherin - cells from dissociated prostate tissue for organoid culture. ( b ) Low-power view of organoids at 20 days after plating, showing heterogeneity of phenotype. ( c ) Higher-power view showing hollow and filled budding organoid (arrow). ( d,e ) H&E staining of sections from a hollow organoid ( d ) and a multi-layered organoid ( e ). ( f ) Many proliferating cells are detectable by Ki67 immunostaining (arrows). ( g ) Organoids have an outer layer that expresses the basal marker CK5 (arrowheads). ( h ) Outer cells express the basal marker p63 (arrowheads), while interior cells are positive for the luminal marker CK18. ( i ) Nuclear immunostaining of AR (arrows) in organoids cultured in standard conditions with DHT. ( j ) Nuclear immunostaining for Foxa1 (arrows). ( k ) Tissue recombination of normal organoids with rat embryonic urogenital mesenchyme followed by renal grafting results in reconstitution of prostate tissue. ( l,m ) Organoids at passage 4 were passaged as single-cell suspensions and plated in the presence of DHT ( l ) or absence of DHT ( m ). ( n,o ) Strong nuclear AR immunostaining in the presence of DHT ( n ) and weak cytoplasmic AR immunostaining in the absence of DHT ( o ). ( p ) qPCR analysis of expression of AR downstream genes in organoids cultured in the presence or absence of DHT. Results are from a si

- Submitted by
- Invitrogen Antibodies (provider)
- Main image
- Experimental details
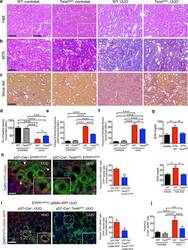
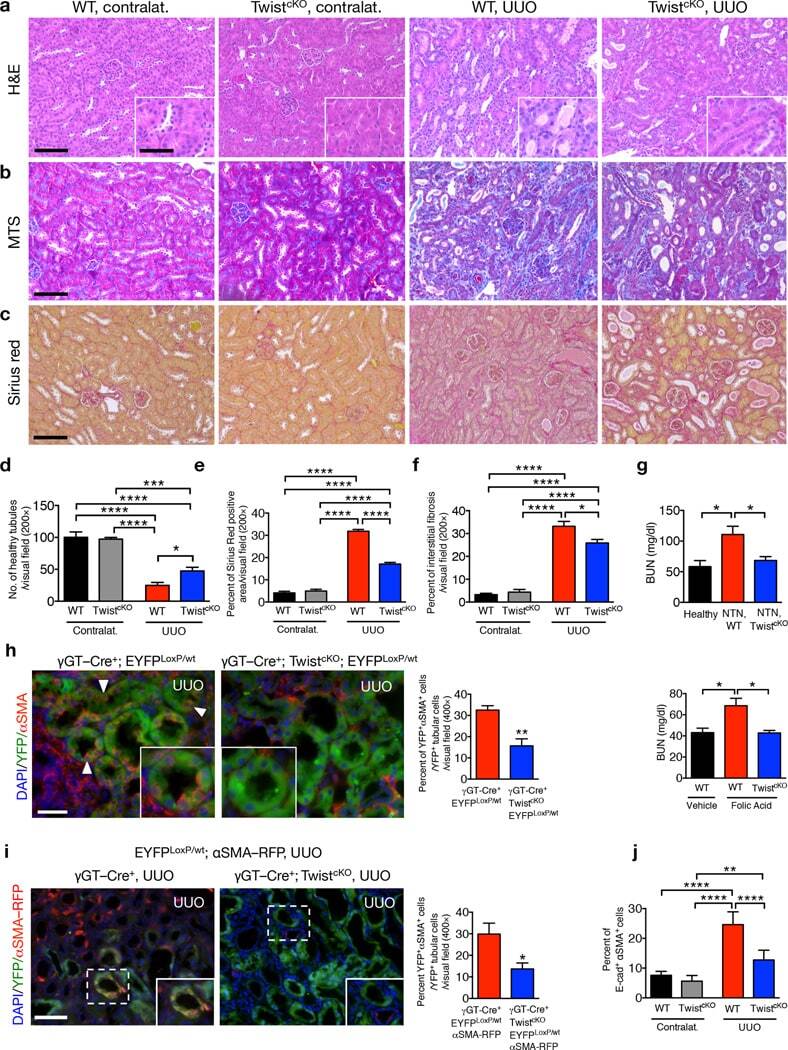
- Figure 1 Genetic targeting of EMT reduces renal fibrosis and improves tubular health. ( a-c ) Representative images (8 visual fields for each tissue analyzed) of H&E ( a ), MTS ( b ) and Sirius Red ( c ) staining of kidneys from the indicated experimental groups. Scale bar, 100 ~m; insert, 25 ~m. ( d ) Number of healthy tubules. WT contralat., n = 4; Twist cKO contralat., n = 3; WT UUO, n = 9; Twist cKO UUO, n = 9. ( e-f ) Interstitial fibrosis, based on MTS ( e ) and Sirius Red ( f ) staining. WT contralat., n = 4; Twist cKO contralat., n = 4; WT UUO, n = 9; Twist cKO UUO, n = 9. ( g ) Blood urea nitrogen (BUN) levels. Healthy, n = 3; WT NTN, n = 7; Twist cKO NTN; n = 7. WT vehicle, n = 4; WT FA, n = 4; Twist cKO FA, n = 4. ( h ) Representative images (8 visual fields for each tissue analyzed) of immunolabeling for alphaSMA and YFP (left) and quantification of the percent YFP + alphaSMA + cells per total number of YFP + tubular epithelial cells (right). WT UUO, n = 3; Twist cKO UUO, n = 4. Scale bar, 20 ~m. White arrowheads, YFP + /alphaSMA + cells. ( i ) Representative images (3 visual fields for each tissue analyzed) of YFP + proximal tubules and alphaSMA-RFP + myofibroblasts in UUO-treated mice (left) and quantification of the percent of YFP + RFP + cells (right). gammaGT-Cre; LSL -EYFP LoxP/+ ; alphaSMA-RFP, n = 3; gammaGT-Cre; LSL -EYFP LoxP/+ ; alphaSMA-RFP; Twist cKO , n = 4. Scale bar, 20 ~m. ( j ) Percent E-cadherin + alphaSMA + cells (as measured by flow cytometry)
- Submitted by
- Invitrogen Antibodies (provider)
- Main image

- Experimental details
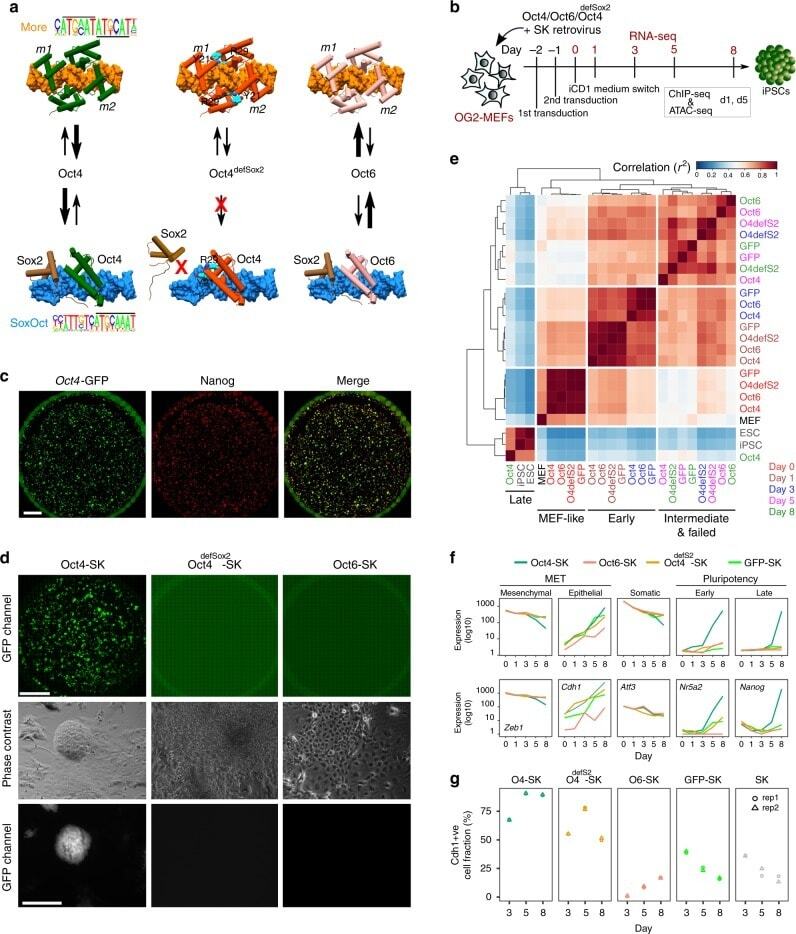
- Fig. 1 Reprogramming trajectories of cocktails containing Oct4, Oct6, Oct4 defSox2 , or GFP in chemically defined medium. a The cartoons represent the preferences of the POU proteins for the DNA-dependent homodimerization on MORE versus heterodimerization with Sox2 on SoxOct elements determined using quantitative biochemical assays . MORE DNA is shown in orange and SoxOct DNA in blue; m1 is monomer 1 and m2 is monomer2. The thickness of the arrows illustrates the DNA binding preferences. b Experimental design of reprogramming and RNA-seq, ATAC-seq, and ChIP-seq experiments. c Whole-well scans from a 6-well plate using GFP channel ( Oct4 -GFP), Nanog immunofluorescence and merged panels; for OG2-MEF cells reprogrammed with Oct4-SK at day 8; scale 5 mm. d Whole-well scans (upper panel) of wells from 12-well plate using GFP channel for three POU factors (Oct4, Oct4 defSox2 , and Oct6); scale 5 mm. Representative phase contrast (middle panel) and corresponding Oct4 -GFP fluorescence (lower panel) images of reprogramming experiments; time-point: day 8 post transduction; scale 200 mum. e Hierarchically clustered heatmap based on r2 correlation coefficients using RNA-seq reads as input. iPSCs and ESCs expression data are from GSE93029 . f Mean gene expression trajectories for indicated categories (upper panel) or a representative gene from each category (lower panel) in four reprogramming conditions. See Supplementary Fig. 1E for a larger panel of genes for each category. g Fraction
- Submitted by
- Invitrogen Antibodies (provider)
- Main image
- Experimental details
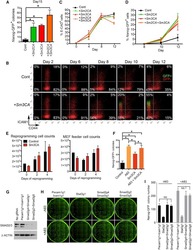
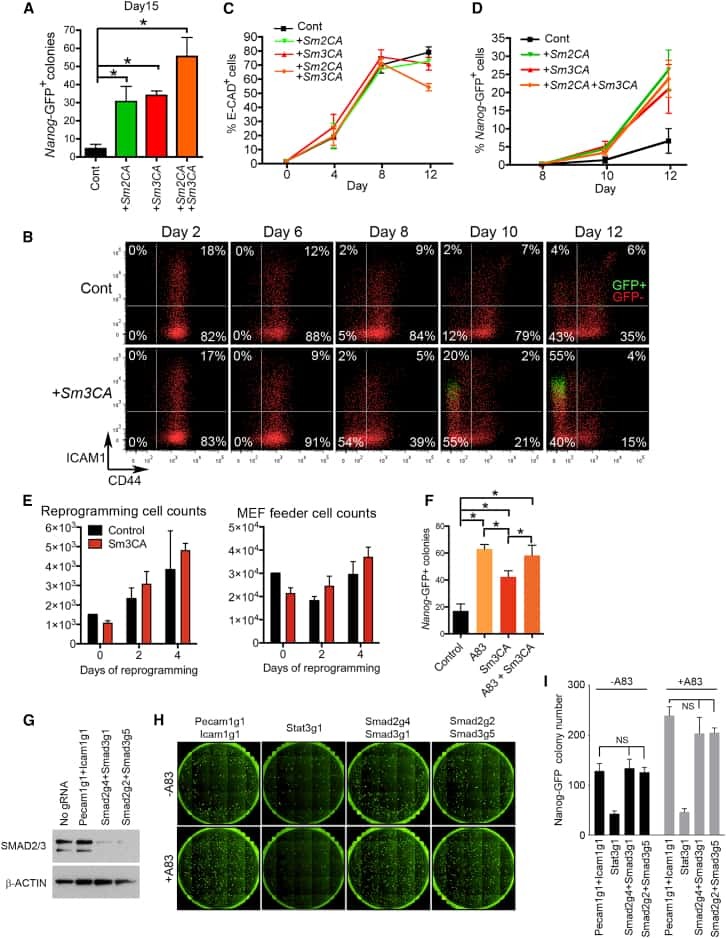
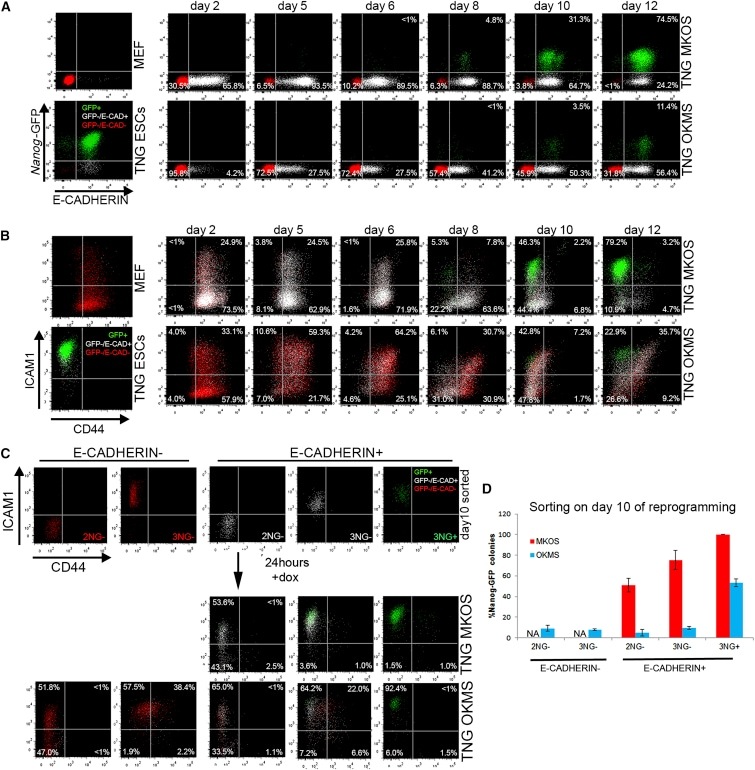
- Figure 3 Inefficient Reprogramming Progression of OKMS Reprogramming Intermediates (A) E-CAD and Nanog -GFP expression changes during TNG MKOS/OKMS reprogramming. Red indicates E-CAD - Nanog -GFP - , white indicates E-CAD + Nanog -GFP - , and green indicates E-CAD + Nanog -GFP + . (B) CD44 and ICAM1 expression changes during TNG MKOS/OKMS reprogramming with E-CAD, Nanog -GFP expression color codes in (A). (C) Flow cytometry analysis of sorted day-10 E-CAD -/+ 2NG- ( Nanog -GFP - CD44 - ICAM1 - ), 3NG - ( Nanog -GFP - CD44 - ICAM1 + ), and 3NG + ( Nanog -GFP + CD44 - ICAM1 + ) cells after a 24-hr culture. dox, doxycycline. (D) E-CAD -/+ 2NG - , 3NG - , and 3NG + ( Nanog -GFP + CD44 - ICAM1 + ) cells on day 10 were seeded at clonal density, and Nanog -GFP + iPSC colonies were counted after 10 days of further culture. The graph depicts the relative Nanog -GFP + CFA compared to that of MKOS 3NG + cells. Error bars represent SD; n = 3 independent experiments.
- Submitted by
- Invitrogen Antibodies (provider)
- Main image
- Experimental details
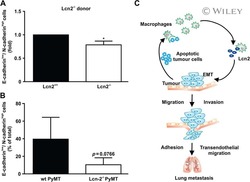
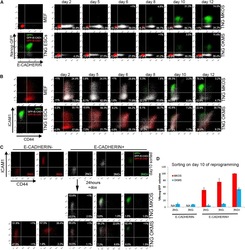
- Figure 1 Epithelial-to-Mesenchymal Transition Reported by Historical Lineage-Tracing Reporter and Current E-Cadherin Status in Murine Metastatic Mammary Carcinoma Model (A) Schematic of fluorescent transgenic mouse model, carrying polyoma middle-T (PyMT) oncogene driven by the mammary gland specific MMTV promoter, Cre recombinase under the control of the fsp1 promoter, endogenous E-cad labeled with mCFP, and ubiquitous expression from the R26 locus of membranous RFP-STOP, which is flanked by lox P sites, leading to excision and subsequent expression of membranous GFP upon Cre expression. (B) Top panel: representative multi-photon images of the fluorescent PyMT mammary tumors from recipient mice. Scale bar, 100 mum. Bottom panel: high-magnification images of the E-cad-mCFP and RFP channel of the boxed area in the top left image. Scale bar, 50 mum. (C) Representative scatterplot from flow cytometry analysis of primary tumor of recipient mice for either absence of endogenous E-cad-mCFP expression and antibody staining (E-cad LO ) or presence of high expression of E-cad and staining for Ab (E-cad HI tumor cells) or subdivision of RFP + or GFP + cells. (D) Relative mRNA expression of classical EMT marker genes (E-cad, Vimentin [Vim], fibronectin [FN], Zeb1, N-cad [N-cadherin], Slug) determined using qPCR of sorted RFP + E-cad Hi , RFP + E-cad LO , RFP + GFP + , and GFP + cells from primary tumors. Plotted mean and SD of n = 3 mice. (E) Quantification of lung metastases of all tran

- Submitted by
- Invitrogen Antibodies (provider)
- Main image

- Experimental details
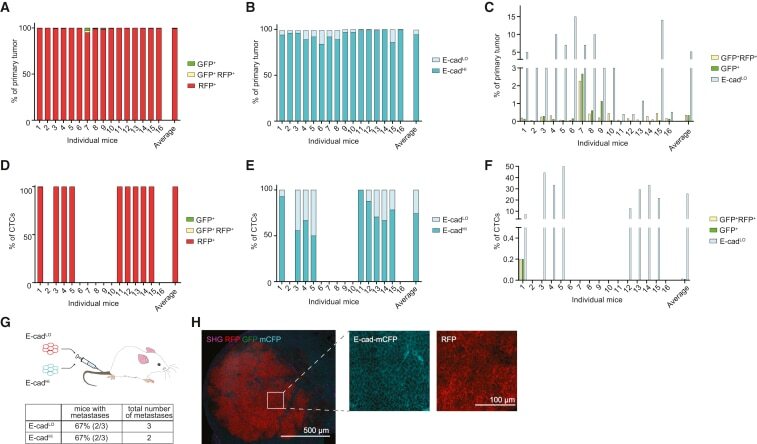
- Figure 2 Mesenchymal E-cad LO Population Exceeds fsp1 -Lineage-Traced Population in Primary Tumor and Circulation and Has Metastatic Potential (A) Percentage of GFP + (green), GFP + RFP + (yellow), and RFP + (red) tumor cells in primary tumors of recipient mice. n = 16 mice. (B) Percentage of E-cad HI (blue), E-cad LO (light blue) tumor cells in primary tumors of recipient mice. n = 16 mice. (C) Comparison of percentage of E-cad LO (light blue) with GFP + (green) and GFP + RFP + (yellow) tumor cells in primary tumors of recipient mice. n = 16 mice. (D) Percentage of GFP + (green), GFP + RFP + (yellow), and RFP + (red) circulating tumor cells collected from the right cardiac chamber of recipient mice. n = 16 mice. (E) Percentage of E-cad HI (blue), E-cad LO (light blue) circulating tumor cells collected from the right cardiac chamber of recipient mice. n = 16 mice. (F) Comparison of percentage of E-cad LO (light blue) with GFP + (green) and GFP + RFP + (yellow) circulating tumor cells collected from the right cardiac chamber of recipient mice. n = 16 mice. (G) Top panel: schematic overview of experimental setup: fluorescence-activated cell sorting (FACS)-sorted E-cad HI or E-cad LO cells of orthotopically transplanted mice were injected in the tail vein of acceptor mice. Bottom panel: quantification of lung metastases of all transplanted mice. n = 3 mice per condition. (H) Representative multi-photon image of lung metastasis from (G). Scale bar, 500 mum. Right panels: zoom of
- Submitted by
- Invitrogen Antibodies (provider)
- Main image
- Experimental details
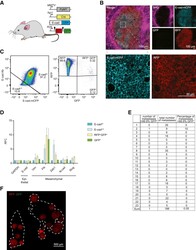
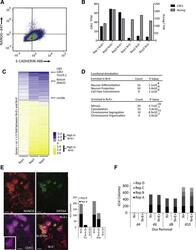
- Figure 3 Late Reprogramming Markers Are Enriched in the N+E+ Population (A) Flow cytometry plot of reprogramming culture stained with Nanog-647 and E-cadherin-488. (B) RNA-Seq read counts (transcripts per million [TPM]) for E-cadherin, labeled Cdh1 in figure, (left, Y axis) and Nanog (right, Y axis) for N+E+ and N+E- populations from three independent experiments. (C) Heatmap of genes 1.5-fold differentially expressed between N+E+ and N+E- populations (set to 1) ranked by average TPM from three independent experiments. (D) Functional annotation of gene expression in N+E+ and N+E- populations. (E) Left: Immunofluorescence images of NANOG, E-cadherin, and DPPA4 on d11 of NSC reprogramming. Right: Counts from two independent experiments of Dppa4+ colonies in N+E+ and N+E- colonies are stacked. Scale bar, 50 mum. Insets, magnification of field. (F) Comparison of d14 N+ and N+E+ colonies following withdrawal of dox on the day indicated on the X axis. Counts from four independent experiments are stacked. No significant difference between N+ and N+E+ colonies by paired two-tailed t test.
