Explore
 Validate
 Learn
Learn Western blot
 Immunoprecipitation
Antibody data
- Antibody Data
- Antigen structure
- References [11]
- Comments [0]
- Validations
- Western blot [1]
- Other assay [5]
Submit
Validation data
Reference
Comment
Report error
- Product number
- 32-6100 - Provider product page

- Provider
- Invitrogen Antibodies
- Product name
- Desmoglein 2 Monoclonal Antibody (6D8)
- Antibody type
- Monoclonal
- Antigen
- Other
- Reactivity
- Human
- Host
- Mouse
- Isotype
- IgG
- Antibody clone number
- 6D8
- Vial size
- 100 µg
- Concentration
- 0.5 mg/mL
- Storage
- -20°C
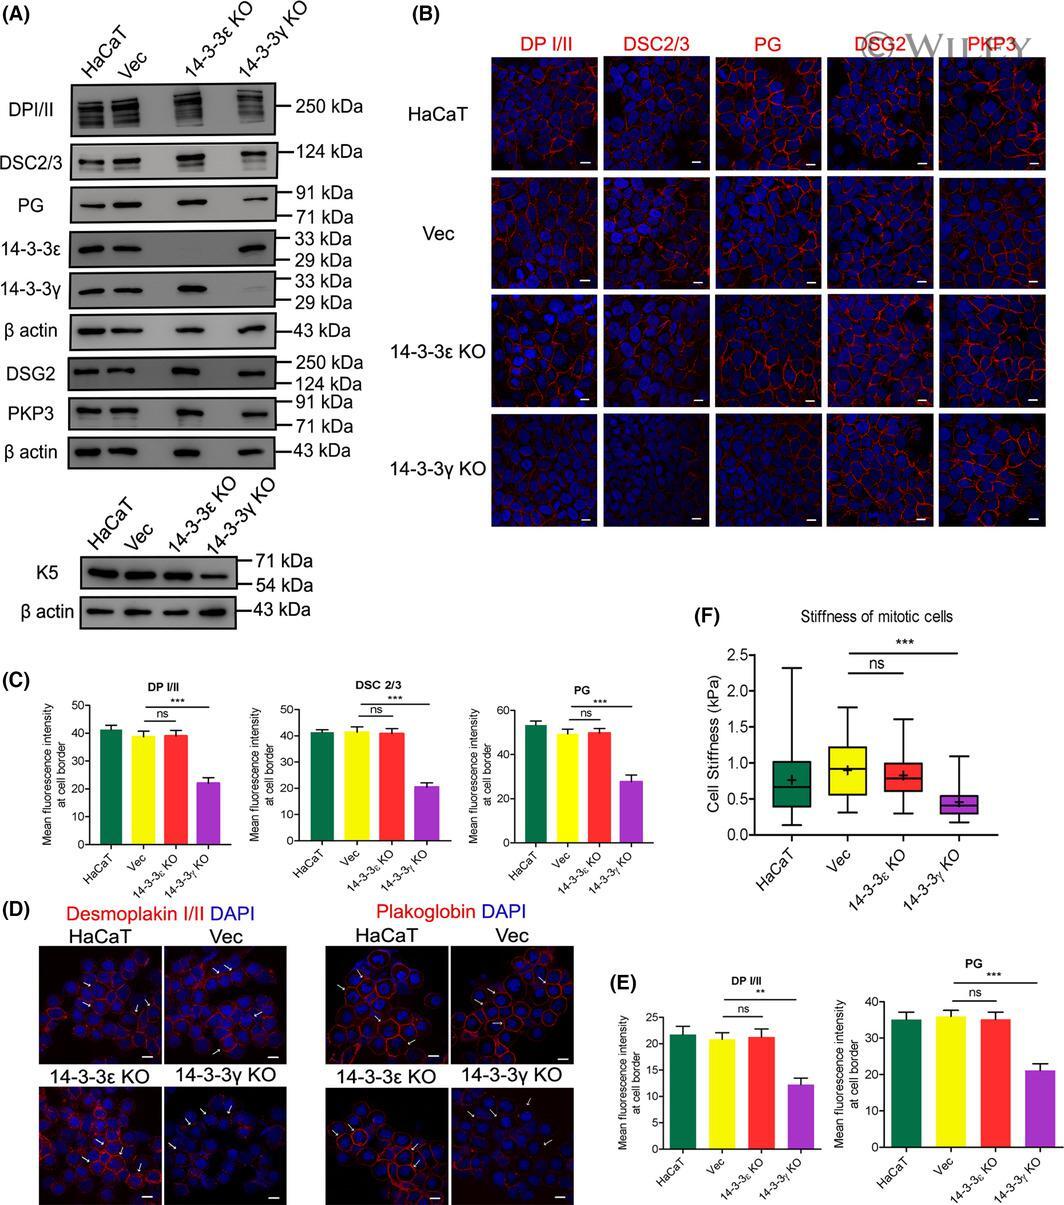
Submitted references Disruption of desmosome function leads to increased centrosome clustering in 14-3-3γ-knockout cells with supernumerary centrosomes.
Leaky Gut as a Potential Culprit for the Paradoxical Dysglycemic Response to Gastric Bypass-Associated Ileal Microbiota.
The cell-cell junctions of mammalian testes: II. The lamellar smooth muscle monolayer cells of the peritubular wall are laterally connected by vertical adherens junctions-a novel architectonic cell-cell junction system.
A non-canonical role for desmoglein-2 in endothelial cells: implications for neoangiogenesis.
Desmoglein 2 promotes vasculogenic mimicry in melanoma and is associated with poor clinical outcome.
CUB domain-containing protein 1 and the epidermal growth factor receptor cooperate to induce cell detachment.
Desmoglein 2 depletion leads to increased migration and upregulation of the chemoattractant secretoneurin in melanoma cells.
Differential downregulation of e-cadherin and desmoglein by epidermal growth factor.
Assessment of desmosomal components (desmoglein 1-3, plakoglobin) in cardia mucosa in relation to gastroesophageal reflux disease and Helicobacter pylori infection.
Gastro-oesophageal reflux disease is associated with up-regulation of desmosomal components in oesophageal mucosa.
Mispolarization of desmosomal proteins and altered intercellular adhesion in autosomal dominant polycystic kidney disease.
Tilwani S, Gandhi K, Narayan S, Ainavarapu SRK, Dalal SN
FEBS letters 2021 Nov;595(21):2675-2690
FEBS letters 2021 Nov;595(21):2675-2690
Leaky Gut as a Potential Culprit for the Paradoxical Dysglycemic Response to Gastric Bypass-Associated Ileal Microbiota.
Hankir MK, Seyfried F, Schellinger IN, Schlegel N, Arora T
Metabolites 2021 Mar 8;11(3)
Metabolites 2021 Mar 8;11(3)
The cell-cell junctions of mammalian testes: II. The lamellar smooth muscle monolayer cells of the peritubular wall are laterally connected by vertical adherens junctions-a novel architectonic cell-cell junction system.
Domke LM, Franke WW
Cell and tissue research 2019 Feb;375(2):451-482
Cell and tissue research 2019 Feb;375(2):451-482
A non-canonical role for desmoglein-2 in endothelial cells: implications for neoangiogenesis.
Ebert LM, Tan LY, Johan MZ, Min KK, Cockshell MP, Parham KA, Betterman KL, Szeto P, Boyle S, Silva L, Peng A, Zhang Y, Ruszkiewicz A, Zannettino AC, Gronthos S, Koblar S, Harvey NL, Lopez AF, Shackleton M, Bonder CS
Angiogenesis 2016 Oct;19(4):463-86
Angiogenesis 2016 Oct;19(4):463-86
Desmoglein 2 promotes vasculogenic mimicry in melanoma and is associated with poor clinical outcome.
Tan LY, Mintoff C, Johan MZ, Ebert BW, Fedele C, Zhang YF, Szeto P, Sheppard KE, McArthur GA, Foster-Smith E, Ruszkiewicz A, Brown MP, Bonder CS, Shackleton M, Ebert LM
Oncotarget 2016 Jul 19;7(29):46492-46508
Oncotarget 2016 Jul 19;7(29):46492-46508
CUB domain-containing protein 1 and the epidermal growth factor receptor cooperate to induce cell detachment.
Law ME, Ferreira RB, Davis BJ, Higgins PJ, Kim JS, Castellano RK, Chen S, Luesch H, Law BK
Breast cancer research : BCR 2016 Aug 5;18(1):80
Breast cancer research : BCR 2016 Aug 5;18(1):80
Desmoglein 2 depletion leads to increased migration and upregulation of the chemoattractant secretoneurin in melanoma cells.
Peitsch WK, Doerflinger Y, Fischer-Colbrie R, Huck V, Bauer AT, Utikal J, Goerdt S, Schneider SW
PloS one 2014;9(2):e89491
PloS one 2014;9(2):e89491
Differential downregulation of e-cadherin and desmoglein by epidermal growth factor.
Chavez MG, Buhr CA, Petrie WK, Wandinger-Ness A, Kusewitt DF, Hudson LG
Dermatology research and practice 2012;2012:309587
Dermatology research and practice 2012;2012:309587
Assessment of desmosomal components (desmoglein 1-3, plakoglobin) in cardia mucosa in relation to gastroesophageal reflux disease and Helicobacter pylori infection.
Wex T, Kuester D, Mönkemüller K, Stahr A, Fry LC, Kandulski A, Kropf S, Roessner A, Malfertheiner P
Human pathology 2012 Oct;43(10):1745-54
Human pathology 2012 Oct;43(10):1745-54
Gastro-oesophageal reflux disease is associated with up-regulation of desmosomal components in oesophageal mucosa.
Wex T, Mönkemüller K, Stahr A, Kuester D, Fry LC, Völkel S, Kandulski A, Roessner A, Malfertheiner P
Histopathology 2012 Feb;60(3):405-15
Histopathology 2012 Feb;60(3):405-15
Mispolarization of desmosomal proteins and altered intercellular adhesion in autosomal dominant polycystic kidney disease.
Silberberg M, Charron AJ, Bacallao R, Wandinger-Ness A
American journal of physiology. Renal physiology 2005 Jun;288(6):F1153-63
American journal of physiology. Renal physiology 2005 Jun;288(6):F1153-63
No comments: Submit comment
Supportive validation
- Submitted by
- Invitrogen Antibodies (provider)
- Main image
- Experimental details
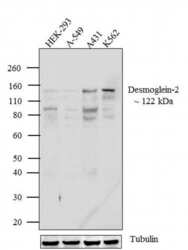
- Western blot analysis of Desmoglein-2 was performed by loading 30 µg of HEK-293 (lane1), A549 (lane2), A-431 (lane3), and K562 (lane4) cell lysate using Novex® NuPAGE® 4-12 % Bis-Tris gel (Product # NP0321BOX), XCell SureLock™ Electrophoresis System (Product # EI0002), Novex® Sharp Pre-Stained Protein Standard (LC5800), and Pierce™ Power Blotter System (22834). Proteins were transferred to a nitrocellulose membrane and blocked with 5 % skim milk for 1 hour at room temperature. Desmoglein-2 was detected at ~122 kDa using Desmoglein-2 Mouse Monoclonal Antibody (Product # 32-6100) at 1-2 µg/mL in 5 % skim milk at 4ºC overnight on a rocking platform. Goat Anti-Mouse - HRP Secondary Antibody (Product # 62-6520) at 1:4000 dilution was used and chemiluminescent detection was performed using Pierce™ ECL Western Blotting Substrate (Product # 32106).

Supportive validation
- Submitted by
- Invitrogen Antibodies (provider)
- Main image
- Experimental details
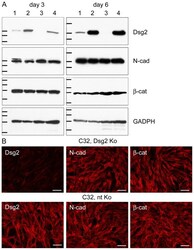
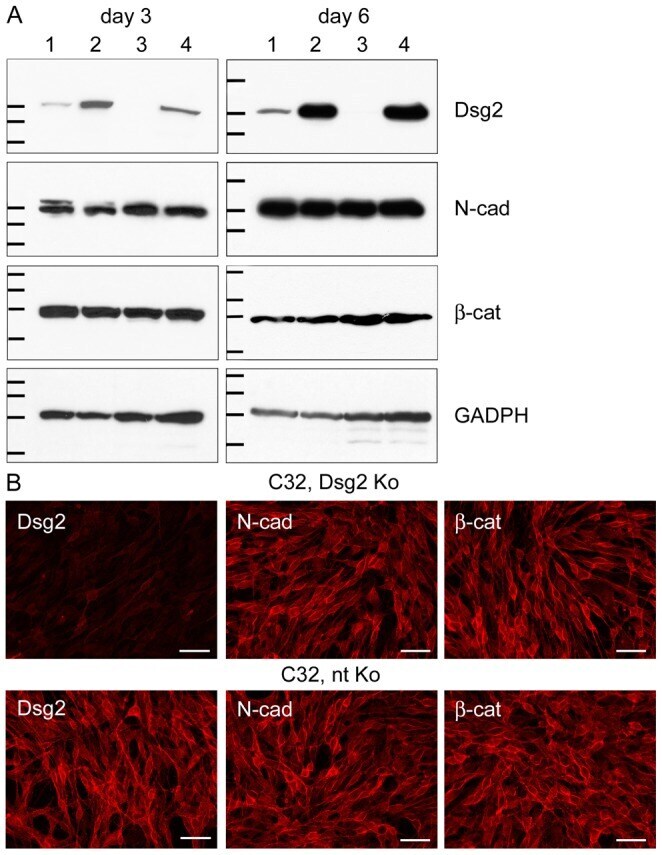
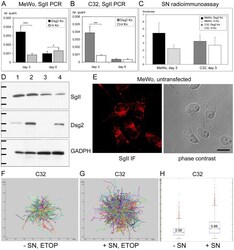
- Figure 1 No alterations in N-cadherin and beta-catenin after knockdown of Dsg2 in melanoma cells. (A) Immunoblots showing efficient Dsg2 depletion in MeWo and C32 melanoma cells. Equal amounts of proteins were loaded. 1: MeWo, Dsg2 siRNA; 2: MeWo, non-targeting (nt) siRNA; 3: C32, Dsg2 siRNA; 4: C32, nt siRNA. In MeWo, Dsg2 reduction was 7.9-fold three days after Dsg2 siRNA transfection and 5.1-fold six days thereafter when the intensity of the bands was normalized against the GADPH immunoblots serving as loading controls. In C32, Dsg2 was 12.7-fold or 122.8-fold reduced. By contrast, protein amounts of N-cadherin (N-cad) and beta-catenin (beta-cat) were virtually unchanged upon Dsg2 depletion. Molecular weight markers (from top to bottom): Dsg2 immunoblots: 158, 116 and 97.2 kDa (day 3); 212, 158 and 116 kDa (day 6); N-cad immunoblots: 116, 97.2 and 66.4 kDa (day 3); 158, 116 and 97.2 kDa (day 6); beta-cat immunoblots: 158, 116, 97.2 and 66.4 kDa (day 3 and 6); GADPH immunoblots: 55.6, 42.7, 34.6 and 27 kDa (day 3 and 6). (B) Immunofluoresence microscopy of Dsg2-depleted (upper panel) and nt siRNA-treated C32 cells (lower panel), showing virtual absence of Dsg2 three days after knockdown. In cells treated with nt siRNA Dsg2 is accumulated at the cell surface and at cell borders. Antibodies to N-cad and beta-cat react at cell-cell junctions and along cell borders, in patterns unaffected by Dsg2 contents. Bars: 200 um.
- Submitted by
- Invitrogen Antibodies (provider)
- Main image
- Experimental details
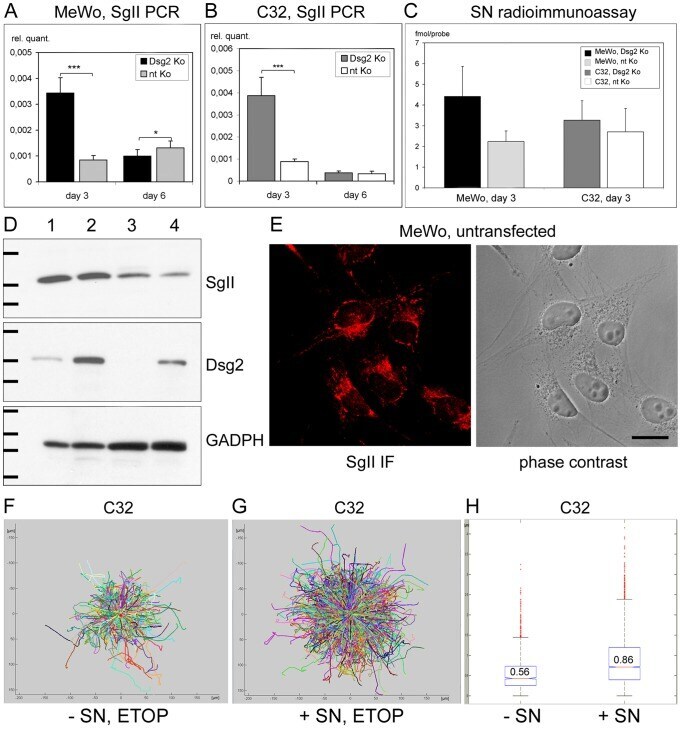
- Figure 7 Upregulation of SgII and SN upon Dsg2 depletion and increased melanoma cell migration upon stimulation with SN. (A, B) Real time PCR showing significantly increased SgII mRNA in subconfluent but not in confluent Dsg2-depleted MeWo and C32. In subconfluent cultures harvested three days after the first siRNA transfection, 4.1-fold more SgII mRNA (MeWo, A) or 4.4-fold more SgII mRNA (C32, B) was detected after Dsg2 knockdown. However, in confluent cultures harvested after six days amounts of SgII mRNA were equal in the C32 samples (B) and slightly decreased in Dsg2-depleted MeWo (1.3-fold, A). (C) RIA demonstrating marked upregulation of SN in cellular extracts of Dsg2-depleted MeWo (4.42 vs. 2.24 fmol/probe, p = 0.0704) and slight SN increase in Dsg2-depleted C32. Bars: SD; * p
- Submitted by
- Invitrogen Antibodies (provider)
- Main image

- Experimental details
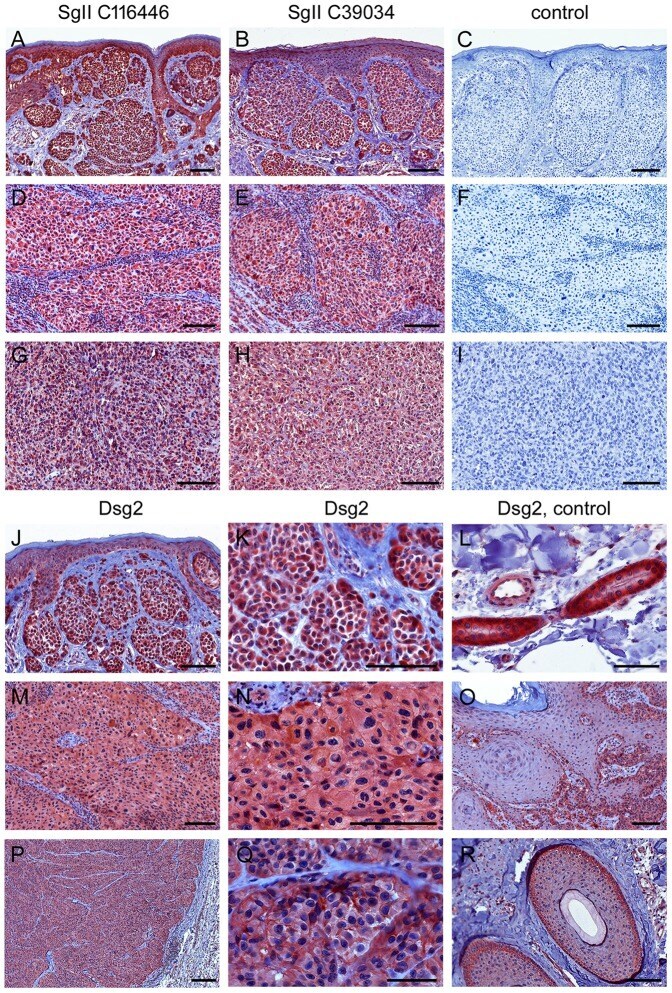
- Figure 8 Immunohistochemistry of SgII and Dsg2 on paraffin sections of primary malignant melanomas and melanoma metastases. (A-C, J-L) Primary nodular malignant melanoma (NMM) with a tumor thickness of 0.8 mm (pT1a; no. 4 in the Table S3 ). (D-F, M-O) Primary NMM of 10 mm thickness (pT4a; no. 1). (G-I) Melanoma metastasis of the mamma (no. 8). (P-R) Cutaneous melanoma metastasis of the temple (no. 15). In the upper part of the figure (A-I), tumors were immunostained with two different SgII antisera (A, D, G: GTX116446 and B, E, H: LS-C39034), or, for control, with secondary goat anti-rabbit HRP-IgG (C, F, I). Clearly positive immunoreactions are seen in the cytoplasm of the melanoma cells with both SgII antisera in all tumors examined. In the lower part (J-R), tumors were reacted with antibodies against Dsg2 (rb5). Diffuse Dsg2-positive reactions are detected in the cytoplasm and/or at the surface of the melanoma cells (J, M, P: overviews; K, N, Q: higher magnifications). In addition, Dsg2 appears to be focally enhanced at the cell-cell contacts of the primary NMM of 10 mm thickness and the cutaneous metastasis (N, Q). Dsg2-positive structures serving as internal positive controls on each slide, i.e. sweat glands (L), basal epidermis (O) and hair follicles (R) are shown on the right hand side of each row. Bars: 50 um (L, Q), 200 um (P) or 100 um (all other micrographs).
- Submitted by
- Invitrogen Antibodies (provider)
- Main image
- Experimental details
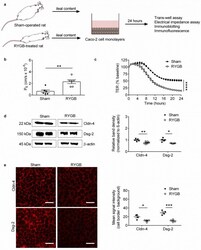
- Figure 2 Ileal Content of RYGB-Treated Rats Contains Soluble Metabolites Which Disrupt Barrier Function and Structure in Caco-2 Cells. ( a ) Schematic diagram illustrating experiments performed on Caco-2 cells. ( b ) Permeability coefficients (P E ) obtained from trans-well assays performed on Caco-2 cells treated for 24 h with ileal content from RYGB-treated and sham-operated rats. n = 6 cultures/group from 1 independent experiment. ( c ) Trans-epithelial electrical resistance (TER) values obtained from low-frequency electrical impedance assays performed on Caco-2 cells treated for 24 h with ileal content from RYGB-treated and sham-operated rats. n = 10-12 cultures/group from 2 independent experiments. ( d ) Immunoblot analysis of claudin-4 (Cldn-4) and desmoglein-2 (Dsg-2) protein expression in Caco-2 cells treated for 24 h with ileal content from RYGB-treated and sham-operated rats. n = 5-6 cultures/group from 1 independent experiment. ( e ) Immunofluorescent analysis of Cldn-4 and Dsg-2 protein levels at the cell border of Caco-2 cells treated for 24 h with ileal content RYGB-treated and sham-operated rats. Scale bar: 25 um. Data in ( b - e ) are presented as mean +- SEM. Statistical significance was determined by two-tailed, unpaired t -test with Welch''s correction in ( b , d , e ) and two-way ANOVA (main effect of treatment) in ( c ). **** p < 0.0001, *** p < 0.001, ** p < 0.01, and * p < 0.05.

- Submitted by
- Invitrogen Antibodies (provider)
- Main image
- Experimental details
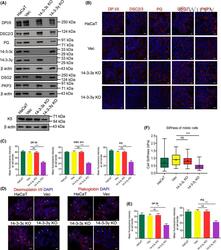
- 2 Fig. Disruption of desmosome function leads to increased centrosome clustering. (A) Western blot analysis of indicated proteins in HaCaT, Vec, 14-3-3epsilon KO, and 14-3-3gamma KO cell lines. Blots for actin served as loading controls. (B, C) The indicated cell lines were stained with antibodies to the indicated proteins. Representative immunofluorescence images are shown (B) and a bar graph showing the mean fluorescence intensity of indicated proteins at the cell border (C). (D, E) Immunofluorescence images of mitotic cells stained with antibodies to PG (red) or DPI/II (red) and DAPI (blue). Arrows indicate mitotic cells. Representative images are shown (D) and a bar graph showing the mean fluorescence intensity of PG or DPI/II at the cell border (E). (F) Box and whisker plot showing cell stiffness of mitotic cells from the indicated cell lines as determined by AFM. The mean and standard deviation from three independent experiments is plotted, and P -valueswere obtained using Student's unpaired t -test (two-tailed). ** P < 0.01, *** P < 0.005. ns indicates not significant. Scale = 10 um.