 Explore
 Validate
 Learn
Learn Western blot
 Chromatin Immunoprecipitation
Antibody data
- Antibody Data
- Antigen structure
- References [0]
- Comments [0]
- Validations
- Chromatin Immunoprecipitation [1]
Submit
Validation data
Reference
Comment
Report error
- Product number
- PA1-29162 - Provider product page

- Provider
- Invitrogen Antibodies
- Product name
- Anti-CDK7 Polyclonal Antibody
- Antibody type
- Polyclonal
- Antigen
- Synthetic peptide
- Description
- PA1-29163 detects Cullin 3 from mouse, human samples. PA1-29163 has been successfully used in ICC, IF and IP applications. The PA1-29163 immunogen is: Synthetic peptide corresponding to the N-terminus of human Cullin-3 protein.
- Reactivity
- Human
- Host
- Rabbit
- Isotype
- IgG
- Vial size
- 500 µL
- Concentration
- 1 mg/ml
- Storage
- 4° C, do not freeze
No comments: Submit comment
Supportive validation
- Submitted by
- Invitrogen Antibodies (provider)
- Main image
- Experimental details
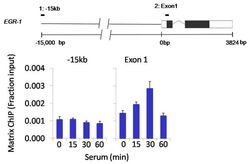
- Chromatin immunoprecipitation analysis of Cdk7 was performed using cross-linked chromatin from 1 x 10⁶ HCT116 colon carcinoma cells treated with serum for 0, 15, 30, and 60 minutes. Immunoprecipitation was performed using a multiplex microplate Matrix ChIP assay (see reference for Matrix ChIP protocol: http://www.ncbi.nlm.nih.gov/pubmed/22098709) with 1.0ul/100ul well volume of a Cdk7 polyclonal antibody (Product # PA1-29162). Chromatin aliquots from ~1 x 10⁵ cells were used per ChIP pull-down. Quantitative PCR data were done in quadruplicate using 1ul of eluted DNA in 2ul SYBR real-time PCR reactions containing primers to amplify -15kb upstream of the Egr1 gene or exon-1 of Egr1. PCR calibration curves were generated for each primer pair from a dilution series of sheared total genomic DNA. Quantitation of immunoprecipitated chromatin is presented as signal relative to the total amount of input chromatin. Results represent the mean +/- SEM for three experiments. A schematic representation of the Egr-1 locus is shown above the data where boxes represent exons (black boxes = translated regions, white boxes = untranslated regions); the zigzag line represents an intron; and the straight line represents upstream sequence. Regions amplified by Egr-1 primers are represented by black bars. Data courtesy of the Innovators Program.
