Explore
 Validate
 Learn
Learn Western blot
 Immunocytochemistry
Antibody data
- Antibody Data
- Antigen structure
- References [4]
- Comments [0]
- Validations
- Immunocytochemistry [1]
- Other assay [1]
Submit
Validation data
Reference
Comment
Report error
- Product number
- 44-962G - Provider product page

- Provider
- Invitrogen Antibodies
- Product name
- Phospho-PKC alpha (Thr638) Polyclonal Antibody
- Antibody type
- Polyclonal
- Antigen
- Synthetic peptide
- Reactivity
- Human, Mouse, Rat
- Host
- Rabbit
- Isotype
- IgG
- Vial size
- 100 µL
- Storage
- -20°C
Submitted references The human WNT5A isoforms display similar patterns of expression but distinct and overlapping activities in normal human osteoblasts.
Basement membrane ligands initiate distinct signalling networks to direct cell shape.
Mesoglycan induces keratinocyte activation by triggering syndecan-4 pathway and the formation of the annexin A1/S100A11 complex.
Intrinsic cellular chirality regulates left-right symmetry breaking during cardiac looping.
Bhandari D, Elshaarrawi A, Katula KS
Journal of cellular biochemistry 2021 Oct;122(10):1262-1276
Journal of cellular biochemistry 2021 Oct;122(10):1262-1276
Basement membrane ligands initiate distinct signalling networks to direct cell shape.
Randles MJ, Lausecker F, Humphries JD, Byron A, Clark SJ, Miner JH, Zent R, Humphries MJ, Lennon R
Matrix biology : journal of the International Society for Matrix Biology 2020 Aug;90:61-78
Matrix biology : journal of the International Society for Matrix Biology 2020 Aug;90:61-78
Mesoglycan induces keratinocyte activation by triggering syndecan-4 pathway and the formation of the annexin A1/S100A11 complex.
Bizzarro V, Belvedere R, Pessolano E, Parente L, Petrella F, Perretti M, Petrella A
Journal of cellular physiology 2019 Nov;234(11):20174-20192
Journal of cellular physiology 2019 Nov;234(11):20174-20192
Intrinsic cellular chirality regulates left-right symmetry breaking during cardiac looping.
Ray P, Chin AS, Worley KE, Fan J, Kaur G, Wu M, Wan LQ
Proceedings of the National Academy of Sciences of the United States of America 2018 Dec 11;115(50):E11568-E11577
Proceedings of the National Academy of Sciences of the United States of America 2018 Dec 11;115(50):E11568-E11577
No comments: Submit comment
Supportive validation
- Submitted by
- Invitrogen Antibodies (provider)
- Main image

- Experimental details
- Immunofluorescence analysis of Phospho-PKC alpha (Thr638) was performed using 70 % confluent log phase MCF7 cells treated with 100 nM PMA for 1hr. The cells were fixed with 4% paraformaldehyde for 10 minutes, permeabilized with 0.1% Triton X-100 for 10 minutes, and blocked with 1% BSA for 1 hour at room temperature. The cells were labeled with Phospho-PKC alpha (Thr638) Rabbit Polyclonal antibody (Product # 44-962G) at 1:250 dilution in 0.1% BSA and incubated for 3 hours at room temperature and then labeled with Goat anti-Rabbit IgG (H+L) Superclonal Secondary Antibody, Alexa Fluor® 488 conjugate (Product # A27034) at a dilution of 1:2000 for 45 minutes at room temperature (Panel a: green). Nuclei (Panel b: blue) were stained with SlowFade® Gold Antifade Mountant with DAPI (Product # S36938). F-actin (Panel c: red) was stained with Rhodamine Phalloidin (Product # R415, 1:300). Panel d represents the merged image showing punctated cytoplasmic and membranous localization. Panel e shows the untreated control with no signal. Panel f shows the no primary antibody control. The images were captured at 60X magnification.

Supportive validation
- Submitted by
- Invitrogen Antibodies (provider)
- Main image

- Experimental details
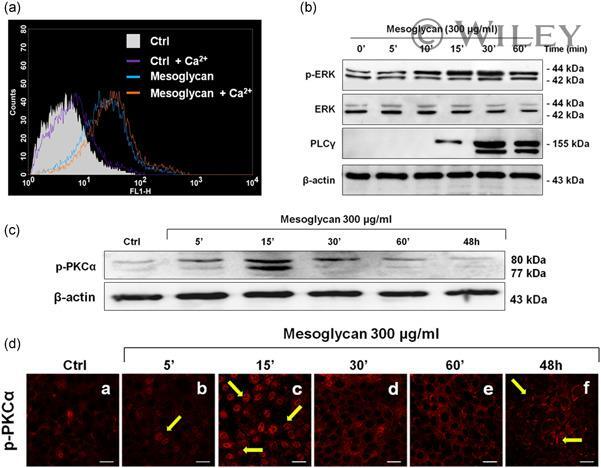
- 1 Mesoglycan effects on Ca 2+ homeostasis and PKCalpha activation. (a) Changes in intracellular Ca 2+ concentration were monitored using the fluorescent probe Fluo-4 a.m. as described in Materials and Methods Section. The fluorescence in each sample was analyzed by a BD FACSCalibur cytometer using the 530/30 filter. The Ca 2+ levels of HaCaT cells in buffers with or without 0.1 mM Ca 2+ were recorded and considered as the baseline of Ca 2+ concentrations. The light gray area in the plot is relative to Ca 2+ concentration baseline of untreated cells in 0.1 mM Ca 2+ buffer whereas the violet bend is relative to Ca 2+ concentration baseline of untreated cells in the buffer without Ca 2+ . The light blue and orange bends are relative to mesoglycan (300 mug/ml) treated cells resuspended in buffers with or without Ca 2+ , respectively. The data are representative of n = 3 independent experiments. (b) Western blot analysis of total protein extracts from cells treated or not with mesoglycan (300 mug/ml) at different times (from 5 to 60 min) to detect ERK and PLCgamma activation. Cropped blots from full-length gels are representative of n = 3 independent experiments with similar results using antibodies against p-ERK, ERK, and PLCgamma. The blots were exposed to Las4000 (GE Healthcare Life Sciences) and normalized on beta-actin levels. (c) Western blot analysis of total protein extracts from cells treated or not with mesoglycan (300 mug/ml) at different times (from 5 min to 48 hr) to