Explore
 Validate
 Learn
Learn Flow cytometry
Antibody data
- Antibody Data
- Antigen structure
- References [27]
- Comments [0]
- Validations
- Flow cytometry [1]
- Other assay [27]
Submit
Validation data
Reference
Comment
Report error
- Product number
- 64-1057-42 - Provider product page

- Provider
- Invitrogen Antibodies
- Product name
- CD105 (Endoglin) Monoclonal Antibody (SN6), Super Bright™ 645, eBioscience™
- Antibody type
- Monoclonal
- Antigen
- Other
- Description
- Description: The SN6 monoclonal antibody reacts with human CD105, also known as Endoglin. CD105, an approximately 90 kDa disulfide-linked homodimer is expressed by vascular endothelial cells and some bone marrow cells and activated macrophages. It is suggested that CD105 functions in adhesion and embryonic angiogenesis.
- Antibody clone number
- SN6
- Concentration
- 5 µL/Test
Submitted references Mesenchymal stem cells derived from patients with premature aging syndromes display hallmarks of physiological aging.
Exosomes derived from stem cells of human deciduous exfoliated teeth inhibit angiogenesis in vivo and in vitro via the transfer of miR-100-5p and miR-1246.
Induced Neurodifferentiation of hBM-MSCs through Activation of the ERK/CREB Pathway via Pulsed Electromagnetic Fields and Physical Stimulation Promotes Neurogenesis in Cerebral Ischemic Models.
Aberrant Expression of COX-2 and FOXG1 in Infrapatellar Fat Pad-Derived ASCs from Pre-Diabetic Donors.
The Effect of Different Doses of Melatonin on in Vitro Maturation of Human Follicular Fluid-Derived Oocyte-Like Cells.
Human Amniotic Mesenchymal Stem Cells Inhibit aGVHD by Regulating Balance of Treg and T Effector Cells.
Development, characterization, and hematopoietic differentiation of Griscelli syndrome type 2 induced pluripotent stem cells.
Therapeutic potential of human umbilical cord mesenchymal stem cells on aortic atherosclerotic plaque in a high-fat diet rabbit model.
TRPA1 triggers hyperalgesia and inflammation after tooth bleaching.
Down-Regulated Exosomal MicroRNA-221 - 3p Derived From Senescent Mesenchymal Stem Cells Impairs Heart Repair.
Differentiation Potential of Early- and Late-Passage Adipose-Derived Mesenchymal Stem Cells Cultured under Hypoxia and Normoxia.
Vasculogenesis from Human Dental Pulp Stem Cells Grown in Matrigel with Fully Defined Serum-Free Culture Media.
Apoptotic bodies derived from mesenchymal stem cells promote cutaneous wound healing via regulating the functions of macrophages.
The Effect of Angiotensin II, Retinoic Acid, EGCG, and Vitamin C on the Cardiomyogenic Differentiation Induction of Human Amniotic Fluid-Derived Mesenchymal Stem Cells.
Resveratrol rescues TNF‑α‑induced inhibition of osteogenesis in human periodontal ligament stem cells via the ERK1/2 pathway.
Chondrogenic Differentiation from Induced Pluripotent Stem Cells Using Non-Viral Minicircle Vectors.
ZKSCAN3 counteracts cellular senescence by stabilizing heterochromatin.
Rescue of premature aging defects in Cockayne syndrome stem cells by CRISPR/Cas9-mediated gene correction.
PF-127 hydrogel plus sodium ascorbyl phosphate improves Wharton's jelly mesenchymal stem cell-mediated skin wound healing in mice.
Visfatin Mediates Malignant Behaviors through Adipose-Derived Stem Cells Intermediary in Breast Cancer.
Up-regulation of FOXD1 by YAP alleviates senescence and osteoarthritis.
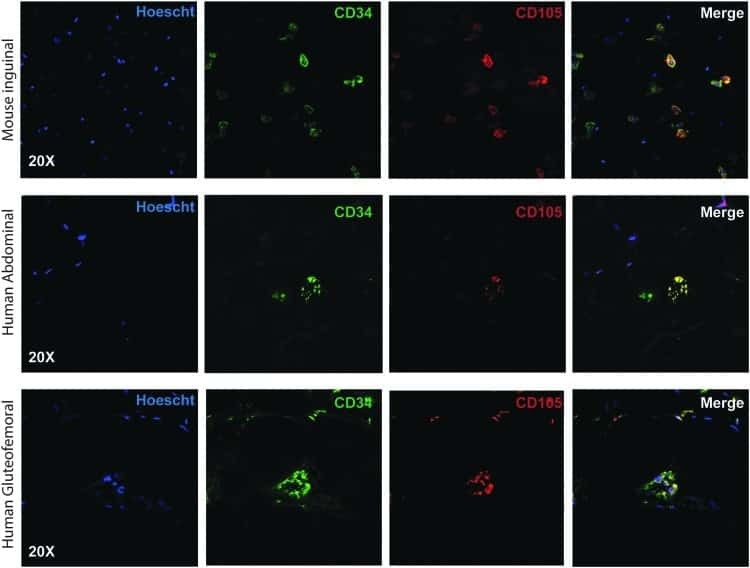
Utilizing Confocal Microscopy to Characterize Human and Mouse Adipose Tissue.
Antagonizing CD105 enhances radiation sensitivity in prostate cancer.
Differential stem cell aging kinetics in Hutchinson-Gilford progeria syndrome and Werner syndrome.
The Improvement of Respiratory Performance After Phototherapy-Induced EPC Mobilization in Preterm Infants With RDS.
Circulation Enrichment of Functional Endothelial Progenitor Cells by Infantile Phototherapy.
CRISPR/Cas9-based genetic correction for recessive dystrophic epidermolysis bullosa.
Trani JP, Chevalier R, Caron L, El Yazidi C, Broucqsault N, Toury L, Thomas M, Annab K, Binetruy B, De Sandre-Giovannoli A, Levy N, Magdinier F, Robin JD
Life science alliance 2022 Sep 14;5(12)
Life science alliance 2022 Sep 14;5(12)
Exosomes derived from stem cells of human deciduous exfoliated teeth inhibit angiogenesis in vivo and in vitro via the transfer of miR-100-5p and miR-1246.
Liu P, Zhang Q, Mi J, Wang S, Xu Q, Zhuang D, Chen W, Liu C, Zhang L, Guo J, Wu X
Stem cell research & therapy 2022 Mar 3;13(1):89
Stem cell research & therapy 2022 Mar 3;13(1):89
Induced Neurodifferentiation of hBM-MSCs through Activation of the ERK/CREB Pathway via Pulsed Electromagnetic Fields and Physical Stimulation Promotes Neurogenesis in Cerebral Ischemic Models.
Park HJ, Choi JH, Nam MH, Seo YK
International journal of molecular sciences 2022 Jan 21;23(3)
International journal of molecular sciences 2022 Jan 21;23(3)
Aberrant Expression of COX-2 and FOXG1 in Infrapatellar Fat Pad-Derived ASCs from Pre-Diabetic Donors.
O'Donnell BT, Monjure TA, Al-Ghadban S, Ives CJ, L'Ecuyer MP, Rhee C, Romero-Lopez M, Li Z, Goodman SB, Lin H, Tuan RS, Bunnell BA
Cells 2022 Aug 1;11(15)
Cells 2022 Aug 1;11(15)
The Effect of Different Doses of Melatonin on in Vitro Maturation of Human Follicular Fluid-Derived Oocyte-Like Cells.
Azandeh S, Moghadam MT, Rashno M, Zargar M, Zadeh PA
JBRA assisted reproduction 2022 Apr 17;26(2):288-298
JBRA assisted reproduction 2022 Apr 17;26(2):288-298
Human Amniotic Mesenchymal Stem Cells Inhibit aGVHD by Regulating Balance of Treg and T Effector Cells.
Gao Y, Li W, Bu X, Xu Y, Cai S, Zhong J, Du M, Sun H, Huang L, He Y, Hu X, Liu Q, Jin H, Wang Q, Ping B
Journal of inflammation research 2021;14:3985-3999
Journal of inflammation research 2021;14:3985-3999
Development, characterization, and hematopoietic differentiation of Griscelli syndrome type 2 induced pluripotent stem cells.
Güney-Esken G, Erol ÖD, Pervin B, Gürhan Sevinç G, Önder T, Bilgiç E, Korkusuz P, Günel-Özcan A, Uçkan-Çetinkaya D, Aerts-Kaya F
Stem cell research & therapy 2021 May 13;12(1):287
Stem cell research & therapy 2021 May 13;12(1):287
Therapeutic potential of human umbilical cord mesenchymal stem cells on aortic atherosclerotic plaque in a high-fat diet rabbit model.
Li Y, Shi G, Han Y, Shang H, Li H, Liang W, Zhao W, Bai L, Qin C
Stem cell research & therapy 2021 Jul 15;12(1):407
Stem cell research & therapy 2021 Jul 15;12(1):407
TRPA1 triggers hyperalgesia and inflammation after tooth bleaching.
Chen C, Huang X, Zhu W, Ding C, Huang P, Li R
Scientific reports 2021 Aug 31;11(1):17418
Scientific reports 2021 Aug 31;11(1):17418
Down-Regulated Exosomal MicroRNA-221 - 3p Derived From Senescent Mesenchymal Stem Cells Impairs Heart Repair.
Sun L, Zhu W, Zhao P, Zhang J, Lu Y, Zhu Y, Zhao W, Liu Y, Chen Q, Zhang F
Frontiers in cell and developmental biology 2020;8:263
Frontiers in cell and developmental biology 2020;8:263
Differentiation Potential of Early- and Late-Passage Adipose-Derived Mesenchymal Stem Cells Cultured under Hypoxia and Normoxia.
Zhao AG, Shah K, Freitag J, Cromer B, Sumer H
Stem cells international 2020;2020:8898221
Stem cells international 2020;2020:8898221
Vasculogenesis from Human Dental Pulp Stem Cells Grown in Matrigel with Fully Defined Serum-Free Culture Media.
Luzuriaga J, Irurzun J, Irastorza I, Unda F, Ibarretxe G, Pineda JR
Biomedicines 2020 Nov 9;8(11)
Biomedicines 2020 Nov 9;8(11)
Apoptotic bodies derived from mesenchymal stem cells promote cutaneous wound healing via regulating the functions of macrophages.
Liu J, Qiu X, Lv Y, Zheng C, Dong Y, Dou G, Zhu B, Liu A, Wang W, Zhou J, Liu S, Liu S, Gao B, Jin Y
Stem cell research & therapy 2020 Nov 27;11(1):507
Stem cell research & therapy 2020 Nov 27;11(1):507
The Effect of Angiotensin II, Retinoic Acid, EGCG, and Vitamin C on the Cardiomyogenic Differentiation Induction of Human Amniotic Fluid-Derived Mesenchymal Stem Cells.
Gasiūnienė M, Valatkaitė E, Navakauskaitė A, Navakauskienė R
International journal of molecular sciences 2020 Nov 19;21(22)
International journal of molecular sciences 2020 Nov 19;21(22)
Resveratrol rescues TNF‑α‑induced inhibition of osteogenesis in human periodontal ligament stem cells via the ERK1/2 pathway.
Yuan J, Wang X, Ma D, Gao H, Zheng D, Zhang J
Molecular medicine reports 2020 May;21(5):2085-2094
Molecular medicine reports 2020 May;21(5):2085-2094
Chondrogenic Differentiation from Induced Pluripotent Stem Cells Using Non-Viral Minicircle Vectors.
Rim YA, Nam Y, Park N, Jung H, Lee K, Lee J, Ju JH
Cells 2020 Mar 1;9(3)
Cells 2020 Mar 1;9(3)
ZKSCAN3 counteracts cellular senescence by stabilizing heterochromatin.
Hu H, Ji Q, Song M, Ren J, Liu Z, Wang Z, Liu X, Yan K, Hu J, Jing Y, Wang S, Zhang W, Liu GH, Qu J
Nucleic acids research 2020 Jun 19;48(11):6001-6018
Nucleic acids research 2020 Jun 19;48(11):6001-6018
Rescue of premature aging defects in Cockayne syndrome stem cells by CRISPR/Cas9-mediated gene correction.
Wang S, Min Z, Ji Q, Geng L, Su Y, Liu Z, Hu H, Wang L, Zhang W, Suzuiki K, Huang Y, Zhang P, Tang TS, Qu J, Yu Y, Liu GH, Qiao J
Protein & cell 2020 Jan;11(1):1-22
Protein & cell 2020 Jan;11(1):1-22
PF-127 hydrogel plus sodium ascorbyl phosphate improves Wharton's jelly mesenchymal stem cell-mediated skin wound healing in mice.
Deng Q, Huang S, Wen J, Jiao Y, Su X, Shi G, Huang J
Stem cell research & therapy 2020 Apr 3;11(1):143
Stem cell research & therapy 2020 Apr 3;11(1):143
Visfatin Mediates Malignant Behaviors through Adipose-Derived Stem Cells Intermediary in Breast Cancer.
Huang JY, Wang YY, Lo S, Tseng LM, Chen DR, Wu YC, Hou MF, Yuan SF
Cancers 2019 Dec 20;12(1)
Cancers 2019 Dec 20;12(1)
Up-regulation of FOXD1 by YAP alleviates senescence and osteoarthritis.
Fu L, Hu Y, Song M, Liu Z, Zhang W, Yu FX, Wu J, Wang S, Izpisua Belmonte JC, Chan P, Qu J, Tang F, Liu GH
PLoS biology 2019 Apr;17(4):e3000201
PLoS biology 2019 Apr;17(4):e3000201
Utilizing Confocal Microscopy to Characterize Human and Mouse Adipose Tissue.
Blackshear CP, Borrelli MR, Shen EZ, Ransom RC, Chung NN, Vistnes SM, Irizarry D, Nazerali R, Momeni A, Longaker MT, Wan DC
Tissue engineering. Part C, Methods 2018 Oct;24(10):566-577
Tissue engineering. Part C, Methods 2018 Oct;24(10):566-577
Antagonizing CD105 enhances radiation sensitivity in prostate cancer.
Madhav A, Andres A, Duong F, Mishra R, Haldar S, Liu Z, Angara B, Gottlieb R, Zumsteg ZS, Bhowmick NA
Oncogene 2018 Aug;37(32):4385-4397
Oncogene 2018 Aug;37(32):4385-4397
Differential stem cell aging kinetics in Hutchinson-Gilford progeria syndrome and Werner syndrome.
Wu Z, Zhang W, Song M, Wang W, Wei G, Li W, Lei J, Huang Y, Sang Y, Chan P, Chen C, Qu J, Suzuki K, Belmonte JCI, Liu GH
Protein & cell 2018 Apr;9(4):333-350
Protein & cell 2018 Apr;9(4):333-350
The Improvement of Respiratory Performance After Phototherapy-Induced EPC Mobilization in Preterm Infants With RDS.
Siavashi V, Asadian S, Taheri-Asl M, Babaei H, Keshavarz S, Bazaei M, Nassiri SM
Journal of cellular biochemistry 2017 Mar;118(3):594-604
Journal of cellular biochemistry 2017 Mar;118(3):594-604
Circulation Enrichment of Functional Endothelial Progenitor Cells by Infantile Phototherapy.
Siavashi V, Asadian S, Sharifi A, Esmaeilivand M, Norouzinia R, Azadbakht M, Nassiri SM
Journal of cellular biochemistry 2017 Feb;118(2):330-340
Journal of cellular biochemistry 2017 Feb;118(2):330-340
CRISPR/Cas9-based genetic correction for recessive dystrophic epidermolysis bullosa.
Webber BR, Osborn MJ, McElroy AN, Twaroski K, Lonetree CL, DeFeo AP, Xia L, Eide C, Lees CJ, McElmurry RT, Riddle MJ, Kim CJ, Patel DD, Blazar BR, Tolar J
NPJ Regenerative medicine 2016;1:16014-
NPJ Regenerative medicine 2016;1:16014-
No comments: Submit comment
Supportive validation
- Submitted by
- Invitrogen Antibodies (provider)
- Main image
- Experimental details
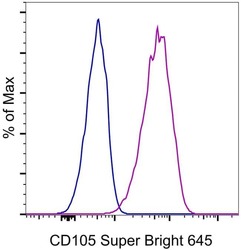
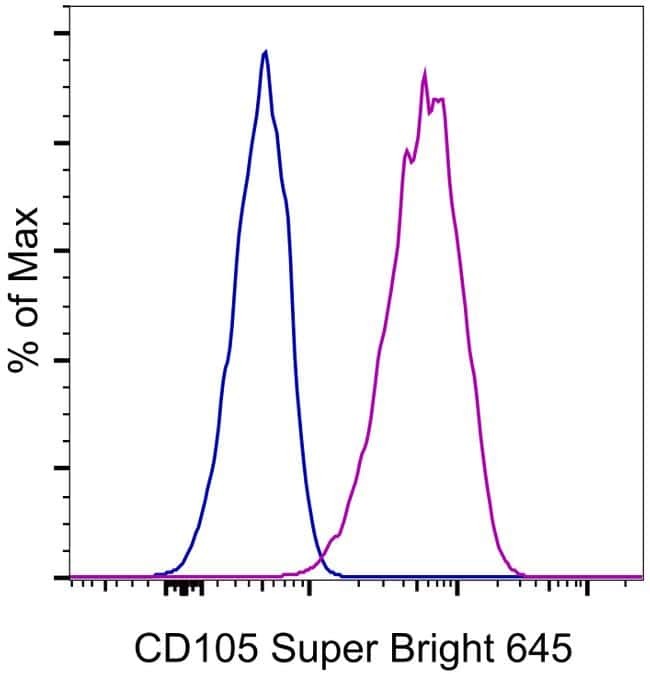
- Staining of U937 cells with Mouse IgG1 K Isotype Control Super Bright 645 (Product # 64-4714-82) (blue histogram) or CD105 (Endoglin) Monoclonal Antibody, Super Bright 645 (purple histogram). Total viable cells were used for analysis.
Supportive validation
- Submitted by
- Invitrogen Antibodies (provider)
- Main image
- Experimental details
- NULL
- Submitted by
- Invitrogen Antibodies (provider)
- Main image
- Experimental details
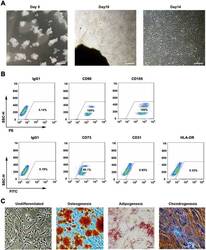
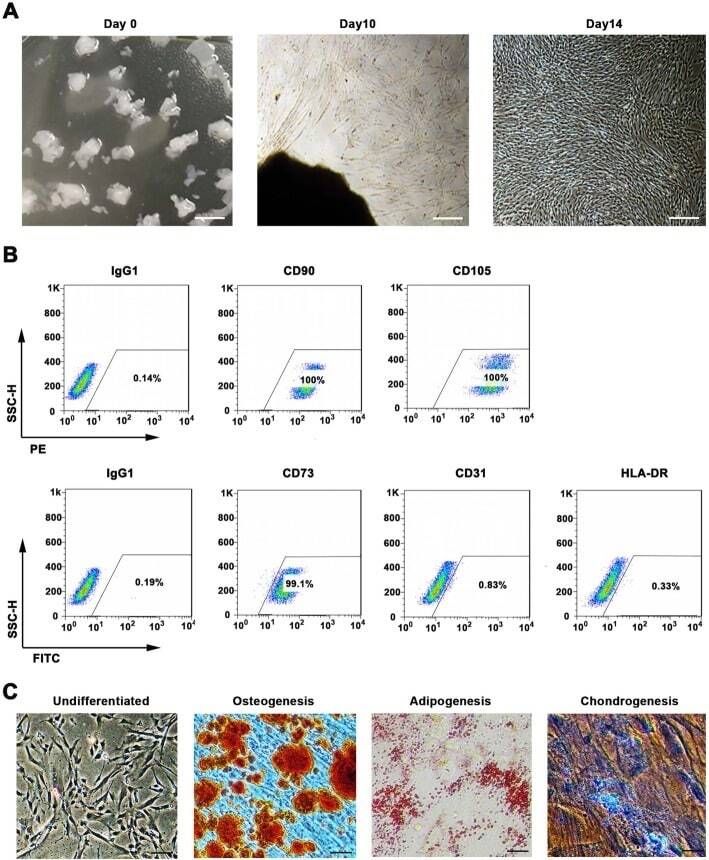
- Fig. 1 WJMSCs isolation and characterization. a Primary cell isolation procedure from Wharton''s jelly tissue. The migrated cells exhibited typical fibroblast-like morphology. Scale bar, 500 mum. b Flow cytometry analysis of P4 cells using mesenchymal stem cell markers (CD90, CD105, CD73), endothelial cell marker (CD31), and MHC class II protein HLA-DR. Isotypic antibodies (IgG1-PE and IgG1-FITC) were used as negative controls. c Representative stained images show that the fourth passage WJMSCs could differentiate into osteocytes (Alizarin Red S), adipocytes (Oil Red O), and chondrocytes (Alcian blue). Scale bar, 100 mum
- Submitted by
- Invitrogen Antibodies (provider)
- Main image
- Experimental details
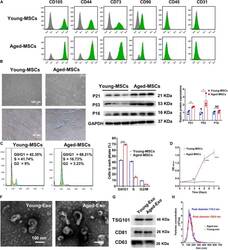
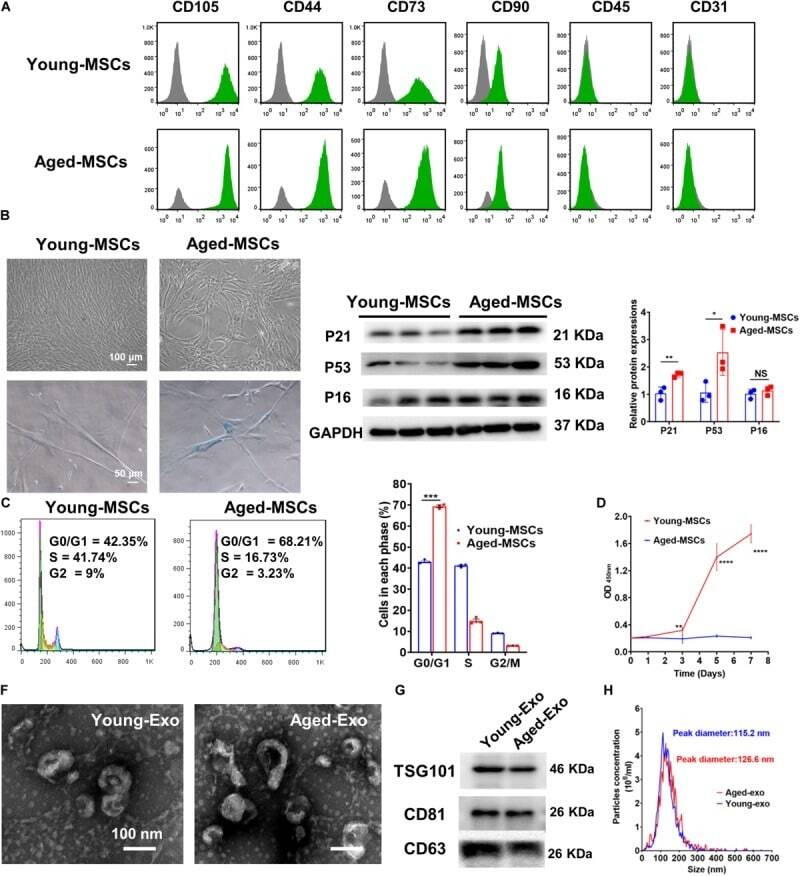
- FIGURE 1 Characterization of young and aged MSCs and exosomes. (A) Surface marker profiling of young-MSCs and aged-MSCs. (B) SA-beta-Gal staining showed that senescence increased significantly in aged MSCs. (C) Representative immunoblot images and quantitative analysis of p21, p53, and p16 protein level in young and aged-MSCs. ( n = 3). (D) Quantitation of cell cycle phases by propidium iodide staining. ( n = 3). (E) The CCK-8 assay showed that aged MSCs grew more slowly than young MSCs. ( n = 6). (F) Young and aged exosomes were observed using TEM. (G) The exosome surface markers were analyzed by Western blot. (H) Nanoparticle tracking analysis was used to analyze the particle size and concentration of Young-Exo and Aged-Exo. * p < 0.05; ** p < 0.01; *** p < 0.001; **** p < 0.0001; NS, not significant.
- Submitted by
- Invitrogen Antibodies (provider)
- Main image
- Experimental details
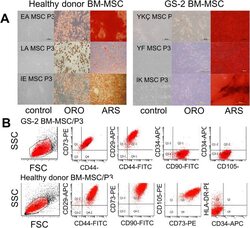
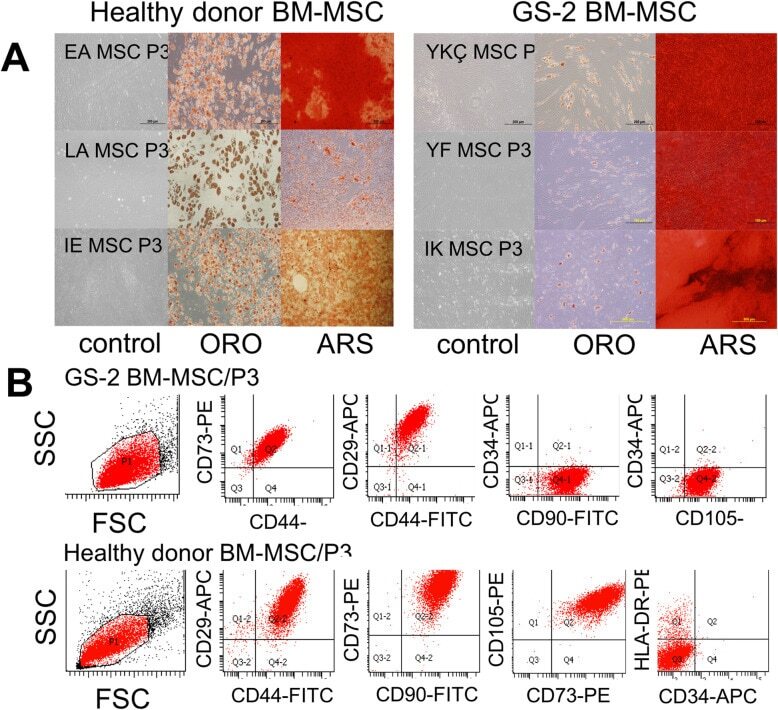
- Fig. 1 Characterization of a healthy donor and GS-2 BM-MSCs. a Morphology before and after differentiation of healthy donor (left, n =3) and GS-2 (right, n =3) BM-MSCs. MSCs were cultured in control medium (left lines) or adipogenic and osteogenic differentiation media for 21 days and were stained with Oil Red O (midline, ORO) for adipogenic differentiation and Alizarin Red S (right lines, ARS) for osteogenic differentiation. b Immunophenotype of a healthy donor and GS-2 BM-MSCs. Dot plots from representative BM-MSC samples of passage 3 GS-2 (upper lane) and healthy control (lower lane) BM-MSCs
- Submitted by
- Invitrogen Antibodies (provider)
- Main image
- Experimental details
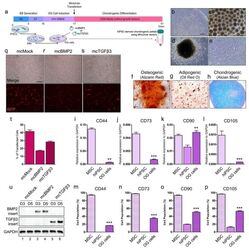
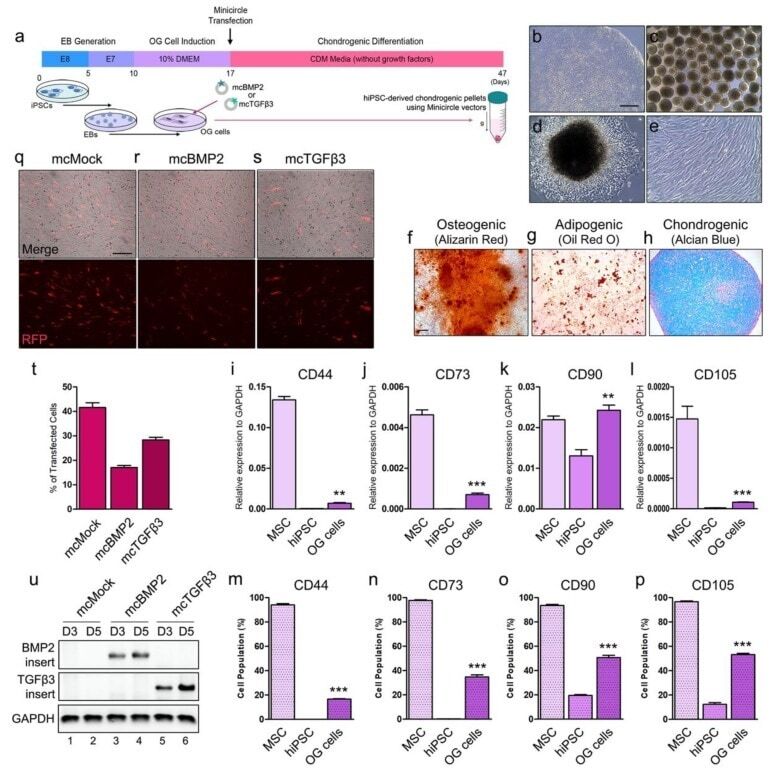
- Figure 2 Chondrogenesis using minicircle-transfected hiPSC-derived OG cells. ( a ) Scheme of chondrogenic differentiation process from hiPSCs. Minicircles were transfected after OG cells were induced. ( b ) Morphology of the hiPSC colony. ( c ) Morphology of the generated EBs. ( d ) Image of outgrowth cells derived from EBs attached to a gelatin-coated culture dish. ( e ) Morphology of OG cells before transfection. ( f ) Alizarin red-stained osteogenic cells differentiated from OG cells. ( g ) Oil red O staining image of adipogenic cells differentiated from OG cells. ( h ) Chondrogenic pellet generated from OG cells stained with alcian blue. Relative gene expression of ( i ) CD44, ( j ) CD73, ( k ) CD90, and ( l ) CD105 in OG cells. Percentage of ( m ) CD44, ( n ) CD73, ( o ) CD90, and ( p ) CD105 positive cells. ( q ) Fluorescence microscopy of mcMock-transfected OG cells. ( r ) Fluorescence microscopy of mcBMP2-transfected OG cells. ( s ) Fluorescence microscopy of mcTGFbeta3-transfected OG cells. ( t ) Percentage of OG cells transfected with each minicircle vectors. ( u ) Gel image of the PCR results against the insert of mcBMP2 and mcTGFbeta3 in transfected OG cells. Data are presented as mean +- standard deviation from three independent sets of experiments. Scale bars represents 200 mum. ** p < 0.01 and *** p < 0.001 indicate statistical significance. EB: embryonic body; OG: outgrowth; CDM: chondrogenic differentiation media; RFP: red fluorescence protein; MSC: mesenchym
- Submitted by
- Invitrogen Antibodies (provider)
- Main image
- Experimental details
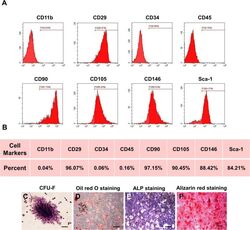
- Fig. 1 Characterization of murine BMMSCs. a , b Flow cytometric analysis of the surface markers showed positive expression of CD29, CD90, CD105, CD146, and Sca-1, and negative expression of hematopoietic markers CD11b, CD34, and CD45. c Representative image of colony formation of murine BMMSCs. d Representative image of Oil Red O staining of murine BMMSCs. e Representative image of ALP staining of murine BMMSCs. f Representative image of Alizarin red staining of murine BMMSCs. Scale bar, 500 mum

- Submitted by
- Invitrogen Antibodies (provider)
- Main image
- Experimental details
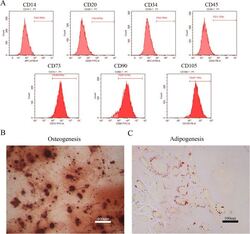
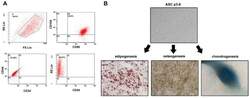
- Figure 1 Identification of dental pulp stem cells (DPSCs). Human DPSCs were positive for the cell surface antigens CD73, CD90, and CD105, as well as negative for CD14, CD20, CD34, and CD45 demonstrated by flow cytometry ( A ). DPSCs were cultured under osteogenic ( B , 14 days) or adipogenic ( C , 21 days) conditions, and showed mineralized nodules and lipid clusters as revealed by alizarin red and oil red staining, respectively. Scale bar = 400 ( B ) or 100 ( C ) mum.
- Submitted by
- Invitrogen Antibodies (provider)
- Main image
- Experimental details
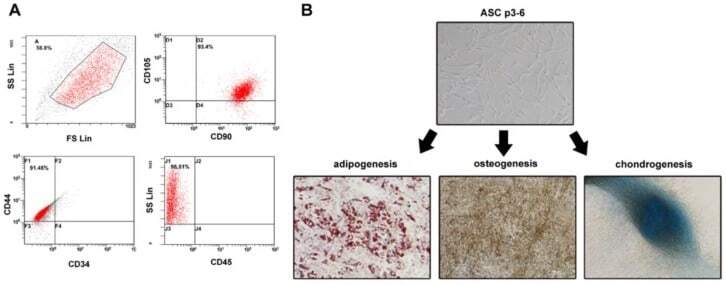
- Figure 1 Identification of ADSCs. ( A ) ADSCs were isolated from the adipose tissue of breast tumors. After two to three passages, the expressions of ADSCs markers (CD90FITC, CD105PE, and CD44FITC) and the lack of CD34PE and CD45FITC were confirmed by flow cytometry. ( B ) The differentiation ability of ADSCs was tested by adipogenesis, osteogenesis, and chondrogenesis.
- Submitted by
- Invitrogen Antibodies (provider)
- Main image

- Experimental details
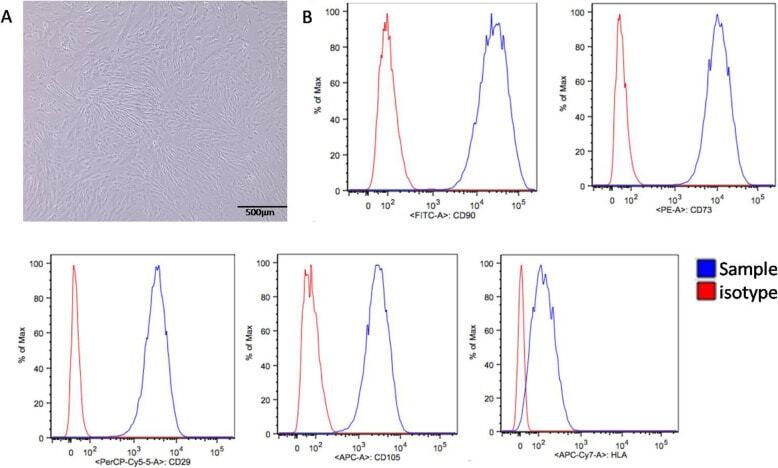
- Fig. 1 Characterization of UCSCs. A UCSCs display a spindle shaped and fibroblast-like morphology. B High UCSCs expression of CD90, CD29, CD73, and CD105, and low expression of HLA using flow cytometry
- Submitted by
- Invitrogen Antibodies (provider)
- Main image
- Experimental details
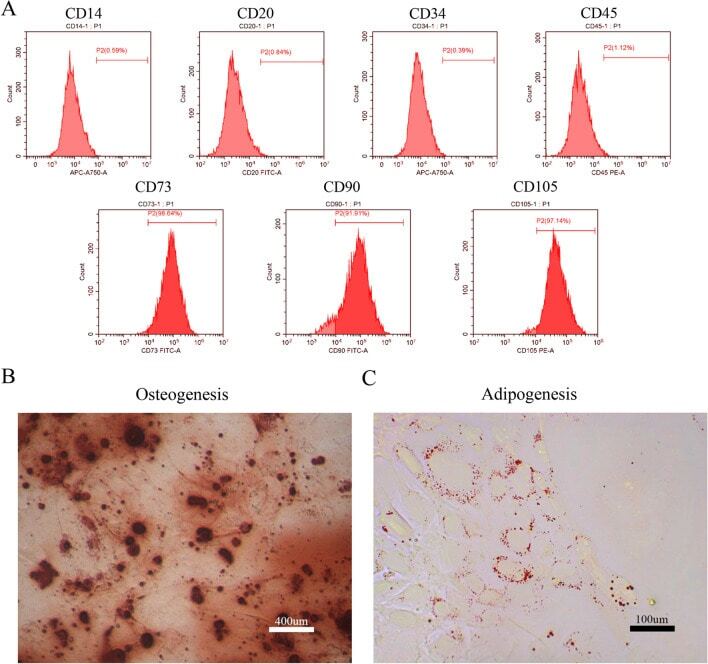
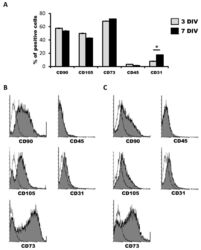
- Figure 1 Characterization of human dental pulp stem cells (hDPSCs) cultured in Neurocult(tm) proliferation medium by flow cytometry. ( A ) Data quantification as representative histograms at 3 days in vitro (DIV) (gray) and 7DIV (black) for CD90, CD105 and CD73 mesenchymal stromal cell (MSC) markers, CD45 hematopoietic and CD31 endothelial markers ( n = 3). Data are represented as the average percentage and standard error of the mean (SEM+-), with respect to the total cell population. ( B ) Representative cytometry of CD90, CD105 and CD73 mesenchymal, CD45 hematopoietic and CD31 endothelial markers in hDPSCs cultured in Neurocult proliferation medium at 3DIV (gray filling), with respect to negative controls (no filling). ( C ) Representative cytometry of CD90, CD105 and CD73 mesenchymal, CD45 hematopoietic and CD31 endothelial markers in hDPSCs cultured in Neurocult proliferation medium at 7DIV (gray filling), with respect to negative controls (no filling). *: p < 0.05. Kruskal-Wallis with Dunn's post hoc test.

- Submitted by
- Invitrogen Antibodies (provider)
- Main image

- Experimental details
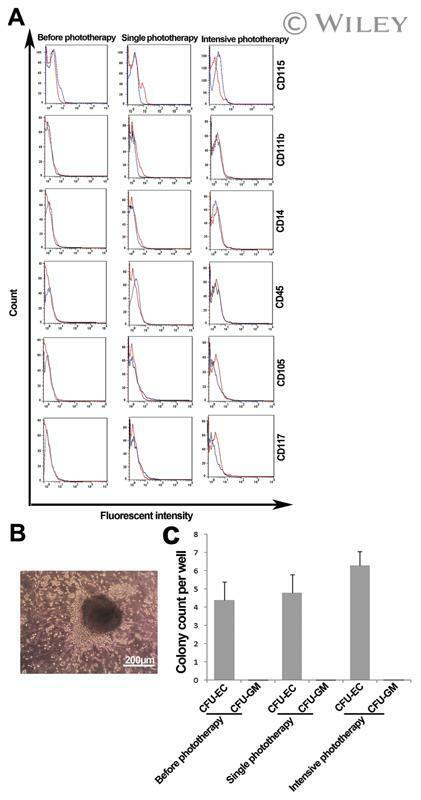
- Cell characteristics. Flow cytometric analysis of cEPCs for CD11b, CD14, CD45, CD105, CD115, and CD117 (A). Red line, isotype control; blue line, CD marker. Outgrowth of colony forming unit of endothelial cells (CFU-EC) after seeding of cEPCs on the methylcellulose medium containing VEGF and GM-CSF. The colony consisted of spindle-shaped cells with sprouting from the cluster center (B). Number of CFU-EC developed by cEPCs on the methylcellulose medium in each group (C). cEPCs did not give rise to CFU-GM.
- Submitted by
- Invitrogen Antibodies (provider)
- Main image

- Experimental details
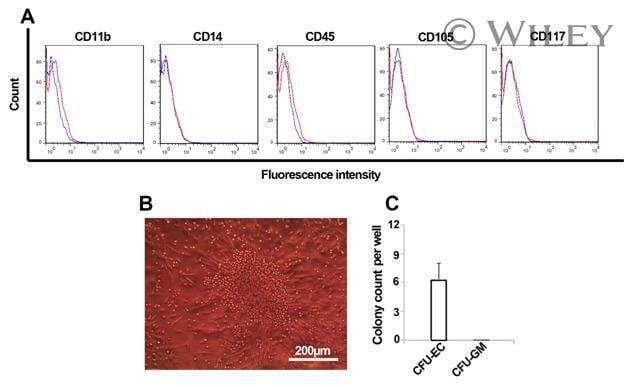
- Cell characteristics. Flow cytometric analysis of cEPCs expanded on the fibronectin matrix for CD11b, CD14, CD45, CD105, and CD117 (A). Red line, isotype control; blue line, CD marker. Outgrowth of colony forming unit of endothelial cells (CFU-EC) after seeding of cEPCs on the methylcellulose medium containing VEGF and GM-CSF (B). Number of CFU-EC developed by cEPCs on the methylcellulose medium (C) (n = 6).
- Submitted by
- Invitrogen Antibodies (provider)
- Main image
- Experimental details
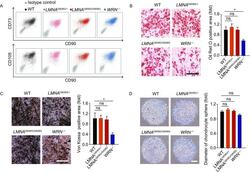
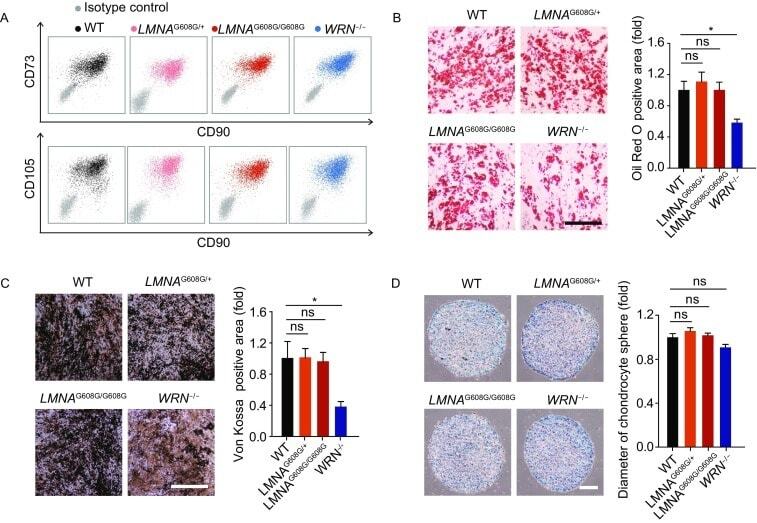
- Figure 3 Acquisition and characterization of HGPS-MSCs and WS-MSCs . (A) FACS analysis of MSC-specific markers (CD73, CD90, CD105) in WT, heterozygous ( LMNA G608G/+ ), homozygous ( LMNA G608G/G608G ) and WRN -/- MSCs. (B) Left: characterization of adipogenesis potential of MSCs by Oil Red O staining. Right: Oil Red O positive areas were calculated by Image J. Data were presented as mean +- SEM, n = 3. * P < 0.05; ns, not significant. Scale bar, 100 mum. (C) Left: characterization of osteogenesis potential of MSCs by Von Kossa staining. Right: Von Kossa positive areas were calculated by Image J. Data were presented as mean +- SEM, n = 3. * P < 0.05; ns, not significant. Scale bar, 100 mum. (D) Left: characterization of chondrogenesis potential of MSCs by Toluidine Blue O staining. Right: the diameters of chondrocyte spheres were measured. Data were presented as mean +- SEM, n = 11. ns, not significant. Scale bar, 100 mum
- Submitted by
- Invitrogen Antibodies (provider)
- Main image
- Experimental details
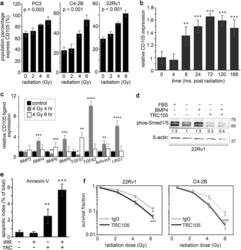
- Fig. 1 Radiation-induced CD105 expression in prostate cancer cells supports radio-resistance. a Cell surface CD105 expression was measured in cell lines at 72 h following a dose range of irradiation (0, 2, 4, or 6 Gy). b The durability of cell surface CD105 expression in 22Rv1 was determined 0, 0.5, 4, 8, 24, 48, 72, 120, and 168 h following 4 Gy irradiation. CD105 cell surface expression fold change was normalized to levels expressed prior to irradiation. c The mRNA expression of CD105 ligands was measured at 0, 4, and 8 h post radiation by rtPCR. Expression was normalized to GAPDH and to the 0 h time point. d Western blot for phosphorylated Smad1/5 was measured in 22Rv1 cells in the presence or absence of serum starvation and treatment with 50 ng/ml BMP4 or TRC105. beta-actin expression served as the loading control. Molecular weight (kDa) is indicated. e Annexin-V expression was measured in 22Rv1 cells by FACS analysis 5 days following 4 Gy irradiation and treatment of IgG or TRC105. f Clonogenic assay was measured 10 days following irradiation of 22Rv1 and C4-2B cells in a dose range of 0-6 Gy in the presence of IgG or TRC105. Data are reported as a mean +- S.D. of three independent experiments (* p < 0.05, ** p < 0.01, *** p < 0.001 compared to control, unless otherwise indicated)

- Submitted by
- Invitrogen Antibodies (provider)
- Main image
- Experimental details
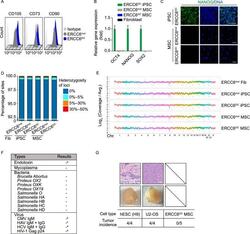
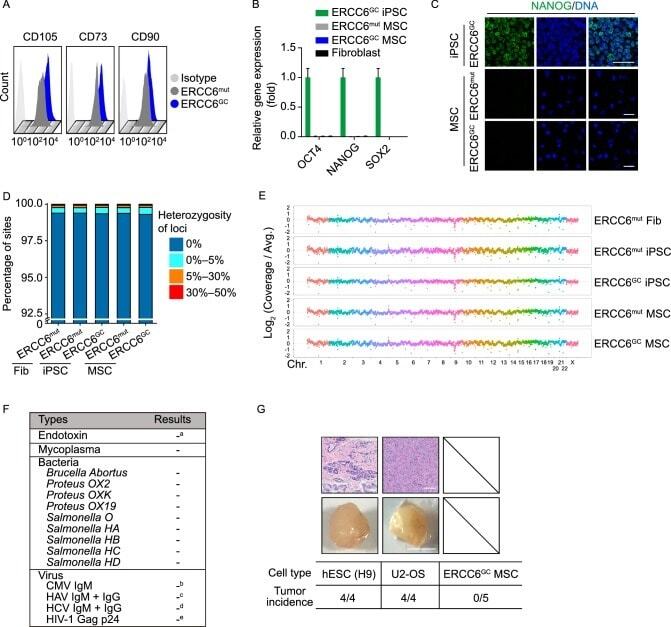
- Figure 7 Safety analysis of gene-corrected CS-MSCs obtained under a cGMP-compliant condition . (A) FACS analysis indicated the expression of the cell surface markers CD73, CD90 and CD105 in CS-MSCs and GC-MSCs. (B) RT-qPCR analysis of the expression of pluripotency markers OCT4 , NANOG , and SOX2 in CS-MSCs and GC-MSCs. GC-iPSCs and CS-fibroblasts were used as positive and negative controls, respectively. Data are presented as the mean +- SEM, n = 3. (C) Immunostaining of the pluripotency marker NANOG in CS-MSCs and GC-MSCs. GC-iPSCs were used as a positive control, Scale bar, 50 mum. (D) Whole-genome sequencing of single-nucleotide variants (SNVs) in CS-fibroblasts, CS-iPSCs, GC-iPSCs, CS-MSCs and GC-MSCs. Sites with a heterozygosity percentage ranging between 0% and 30% were considered as SNV sites, and sites with a heterozygosity of >30% were considered as single-nucleotide polymorphisms (SNPs). (E) Whole-genome sequencing of copy number variations (CNVs) in CS-fibroblasts, CS-iPSCs, GC-iPSCs, CS-MSCs and GC-MSCs. Each point represents normalized coverage depth of each 500-kb genomic region of each chromosome. (F) Sterility and pathogen testing of the conditioned medium of GC-MSCs. a Endotoxin was identified as negative when the concentration was < 0.25 EU/mL. b CMV was identified as negative when the ratio of the OD 450 value of sample to the cut-off value (S/Co) was < 1.0. c HAV was identified as negative when the ratio of the cut-off value to the OD450 nm value of the s
- Submitted by
- Invitrogen Antibodies (provider)
- Main image
- Experimental details
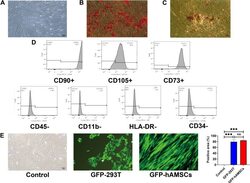
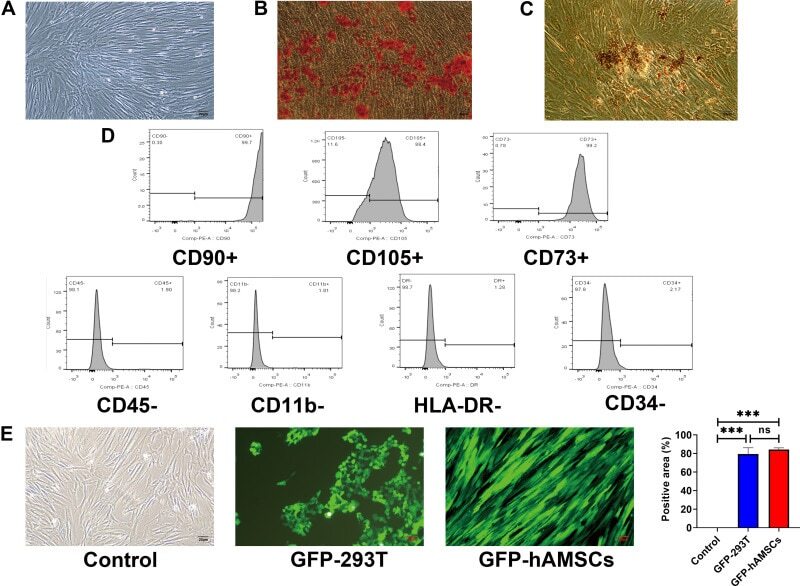
- Figure 2 Identification of human amnion mesenchymal stem cells. ( A ) Characteristics of passage three hAMSCs. ( B ) Osteogenic differentiation of hAMSCs indicated by Alizarin Red S. 100x. ( C ) Adipogenic differentiation of hAMSCs indicated by Oil Red O staining. 100x. ( D ) Surface antigens of hAMSCs were detected by flow cytometry. Cells were positive for CD90, CD105, and CD73 and negative for CD45, CD11b, CD34, and HLA-DR. ( E ) GFP-labeled hAMSCs and 293T cells were detected by fluorescence microscopy at day 3 following transfection with GFP-pseudovirion. 100x. ***p < 0.001.
- Submitted by
- Invitrogen Antibodies (provider)
- Main image
- Experimental details
- Figure 1. Identification and characteristics of hPDLSCs. Morphological characterization of hPDLSCs in (A) primary culture and (B) culture at passage 3. A periodontal membrane fragment is present and shown in A. Flow cytometry analysis of surface markers expressed on hPDLSCs, showing that they were positive for (D) 0CD44, (F) CD90 and (G) CD105, and negative for (C) CD34 and (E) CD45. (H) Following 3 weeks of culture in osteogenic induction medium, the cells were stained with alizarin red. Mineralized nodules are shown. (I) Following 3 weeks of culture in adipogenic induction medium, the cells were stained with Oil Red O. Lipid globules are shown (black arrow). hPDLSCs, human periodontal ligament stem cells; PE, phycoerythrin.

- Submitted by
- Invitrogen Antibodies (provider)
- Main image

- Experimental details
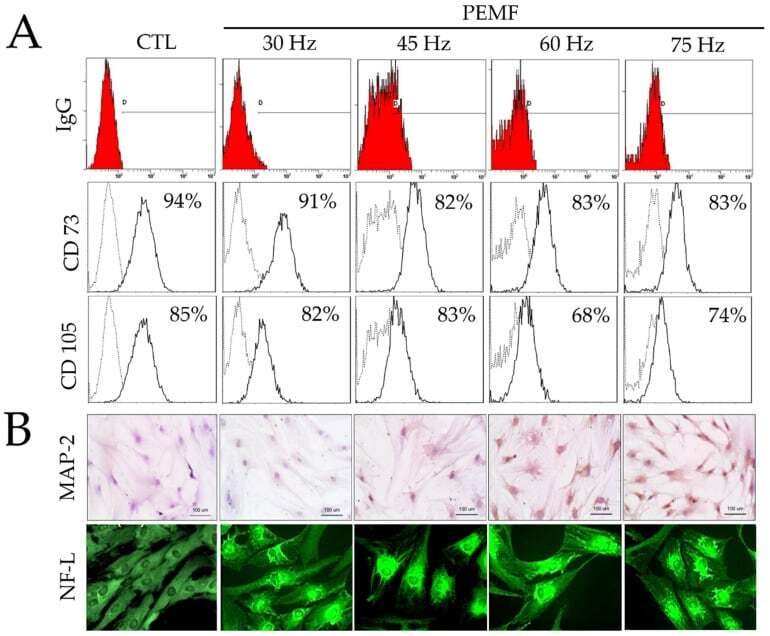
- Figure 2 ( A ) Results of fluorescence-activated cell sorting (FACS) analysis on hBM-MSCs surface markers (CD73 and CD105) and IgG control after PEMF for three days. ( B ) Immunohistochemical analysis of MAP-2 antibodies on hBM-MSCs cultured after PEMF for three days (original magnification: 100x); and immunofluorescence staining of NF-L antibodies on hBM-MSCs after PEMF for three days (original magnification: 400x).
- Submitted by
- Invitrogen Antibodies (provider)
- Main image
- Experimental details
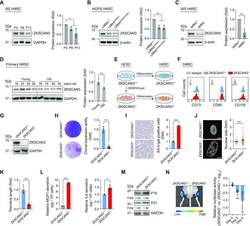
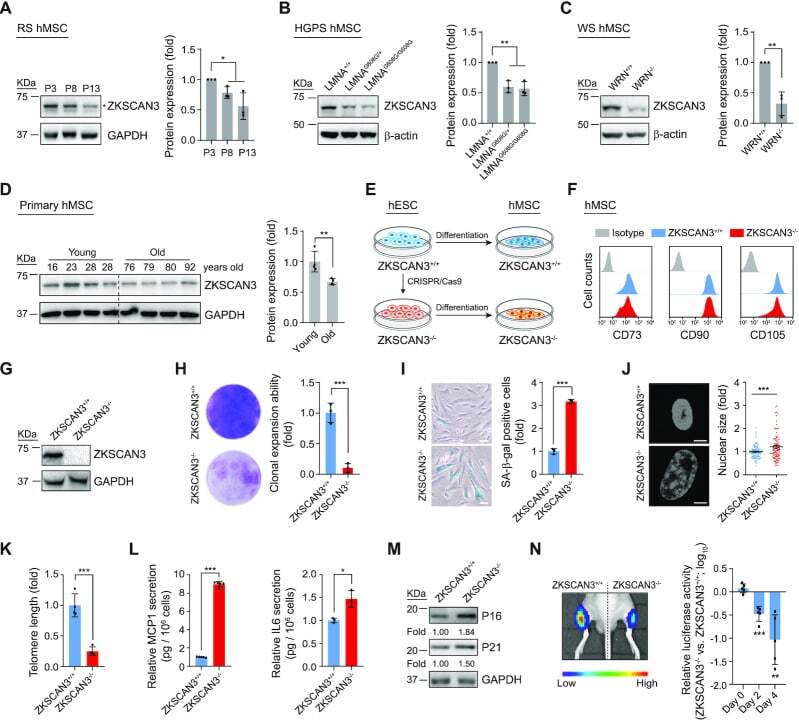
- Figure 1. Absence of ZKSCAN3 results in premature cellular senescence in hMSCs. ( A ) Western blot analysis of ZKSCAN3 protein in early-, middle- and late-passage (P3, P8, P13) hMSCs. Representative western blot images are shown on the left, and the statistical analysis of relative protein expression levels of ZKSCAN3 is on the right. GAPDH was used as the loading control. Data are presented as the mean +- SEMs, n = 3. * P < 0.05 (two tailed t -test). The asterisk indicates the band of ZKSCAN3 and P indicates passage. ( B ) Western blot analysis of ZKSCAN3 protein in LMNA +/+ , LMNA G608G/+ and LMNA G608G/G608G hMSCs (P7). Representative western blot images are shown on the left, and the statistical analysis of the relative protein expression levels of ZKSCAN3 is on the right. beta-actin was used as the loading control. Data are presented as the mean +- SEMs, n = 3. * P < 0.05, ** P < 0.01 (two tailed t -test). ( C ) Western blot analysis of ZKSCAN3 protein in WRN +/+ and WRN -/- hMSCs (P7). Representative western blot images are shown to the left, and the statistical analysis of the relative protein expression levels of ZKSCAN3 is on the right. beta-actin was used as the loading control. Data are presented as the mean +- SEMs, n = 3. ** P < 0.01 (two tailed t -test). ( D ) Western blot analysis of ZKSCAN3 protein in young and physiologically aged hMSCs (P7). Representative western blot images are shown on the left, and the statistical analysis of the relative protein express
- Submitted by
- Invitrogen Antibodies (provider)
- Main image
- Experimental details
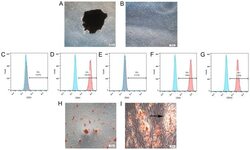
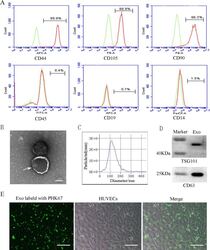
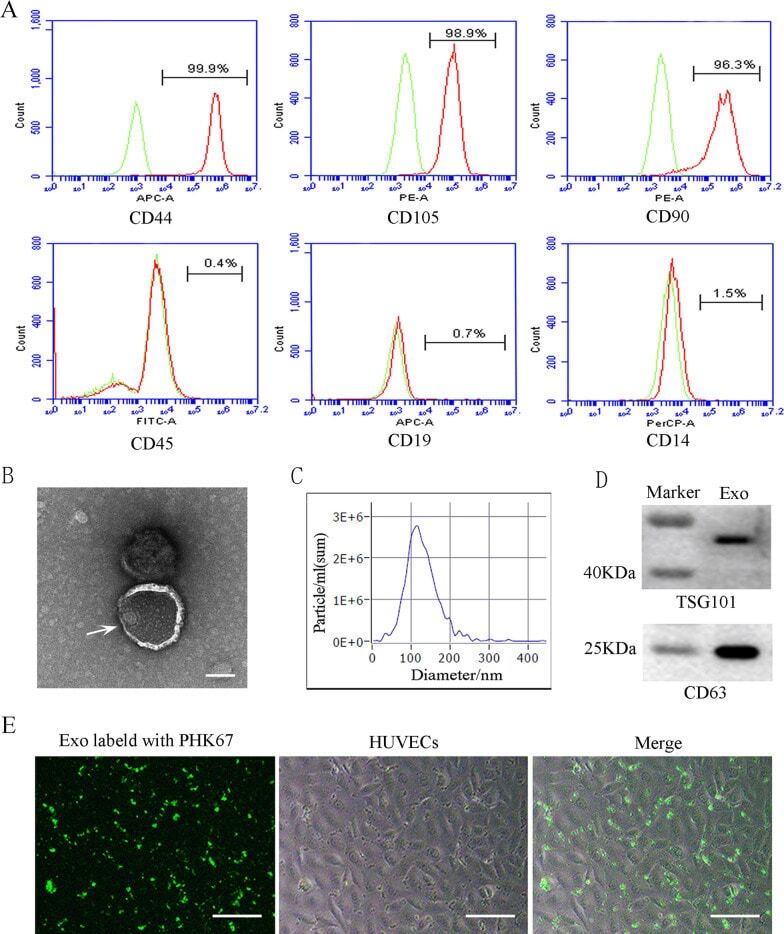
- Characterization and uptake of SHED-Exos. A Surface markers of SHED cells were analyzed by flow cytometry (FACS) and were positive for mesenchymal markers (CD44, CD105 and CD90) and negative for endothelial markers (CD45, CD19 and CD14). B The morphology of exosomes (indicated by arrows) was observed using a transmission electron microscope (TEM). Scale bar = 100 nm. C Particle size distribution of SHED-Exos assessed by nanoparticle tracking analysis (NTA). D Expression of exosome-specific CD63 and TSG101 validated using western blotting. E Efficient uptake of PKH67-labeled exosomes by HUVECs was detected at 24 h. Scale bars = 100 mum
- Submitted by
- Invitrogen Antibodies (provider)
- Main image

- Experimental details
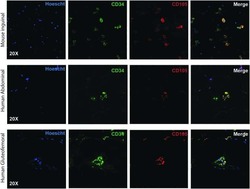
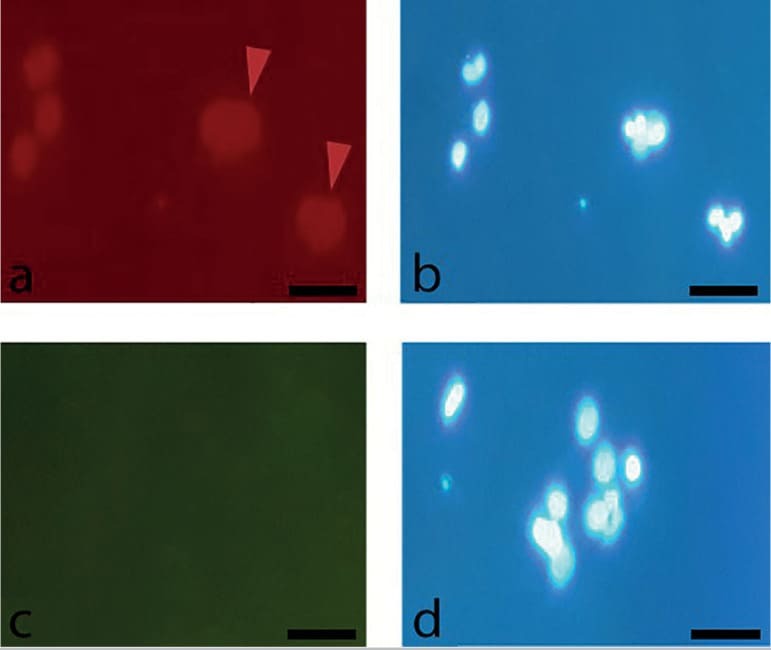
- Immunostaining of human FF cells for specific cell surface markers after 48h. (a) Red arrows show cells low positive expression of CD105, (c) negative expression of CD34. Cell nuclei were counterstained by DAPI (b, d); 20X.
- Submitted by
- Invitrogen Antibodies (provider)
- Main image
- Experimental details
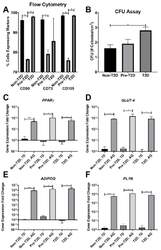
- Decreased expression of CD90, CD73, and CD105 on Pre-T2D IPFP-ASCs. ( A ) Flow cytometry for CD90 and CD105 demonstrated decreased expression in Pre-T2D IPFP-ASCs compared to those from Non-T2D and T2D groups ( n = 3, * p < 0.05). ( B ) CFU assay illustrated increased self-renewal properties in T2D IPFP-ASCs compared to Non-T2D ( n = 3, * p < 0.05). ( C - F ) RT-qPCR for common adipokines in ASCs and adipocyte differentiated ASCs demonstrated no significant difference in adipogenic potential between Non-T2D, Pre-T2D, and T2D IPFP-ASCs ( n = 3, * p < 0.05, *** p < 0.001, **** p < 0.0001). Non-T2D IPFP ASCs 7-Day is the control Group set as 1. Non-T2D: IPFP-ASCs from donors without Type II diabetes mellitus, Pre-T2D: IPFP-ASCs from donors with pre-Type II diabetes mellitus, T2D: IPFP-ASCs from donors with type II diabetes mellitus, 7D: Confluent ASCs, AQ: Adipocyte Differentiated ASCs.
- Submitted by
- Invitrogen Antibodies (provider)
- Main image
- Experimental details
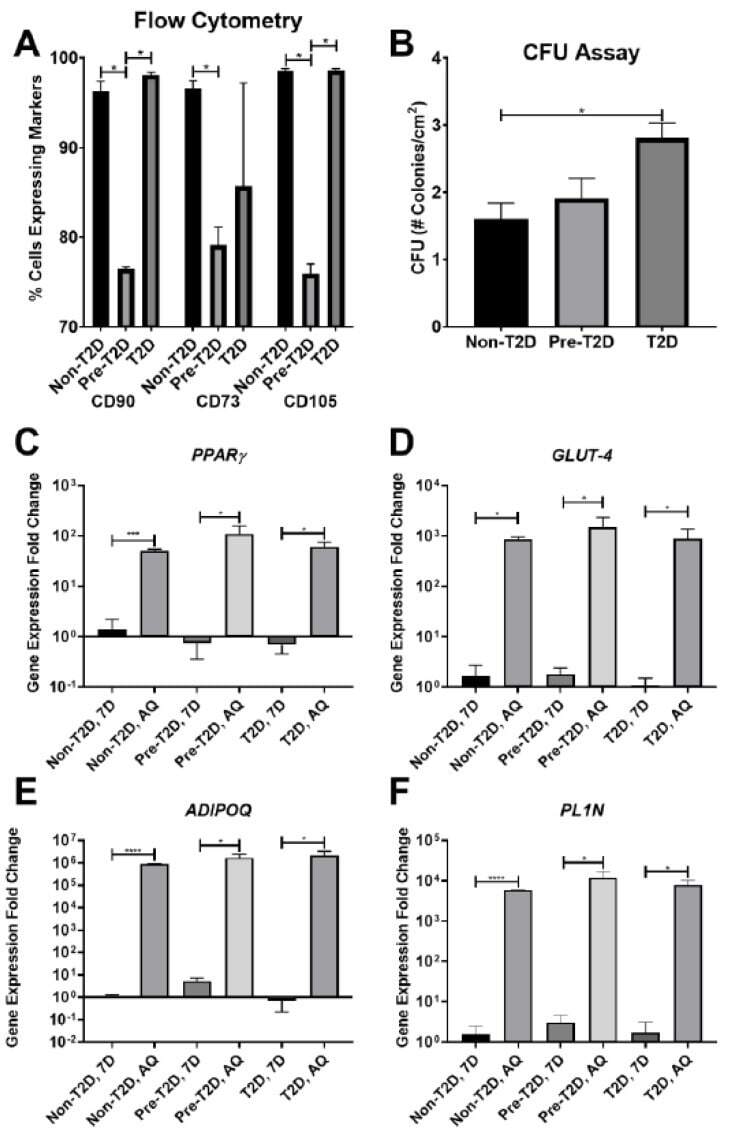
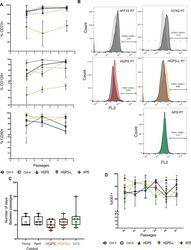
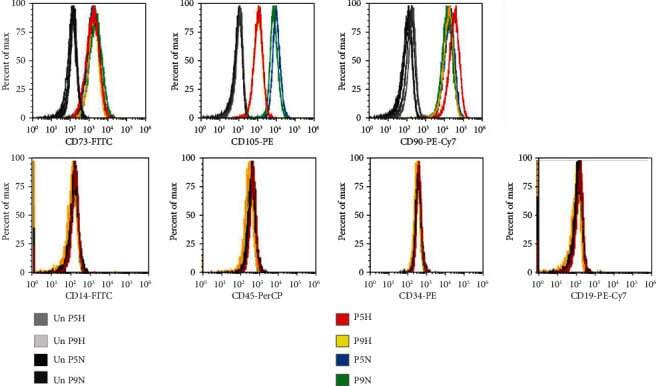
- Figure S2. Characterization of hiPSC-derived mesenchymal stem cells (MSCs). (A) The percentage of MSCs was determined at different time points by flow cytometry by detection of CD73 (ecto 5' nucleotidase), CD90 (Thy1), CD105 (Endoglin). (B) Representative flow cytometry analysis across samples to validate the absence of hematopoietic cell lineage markers CD34 and CD45. (C) After the first differentiation step, cells at 80% confluence were divided and expanded. The time between each passage is indicated. Cells were collected at P7, 40 d after differentiation for Hutchinson-Gilford progeria syndrome cells and 47 d for cells from the aged healthy donor. (D) The percentage of proliferating cells was monitored by flow cytometry at each passage using Ki67 staining. We observed a similar proliferation rate between the different conditions. Between each passage, measurements were made at three time points: 12, 24 and 48 h.
- Submitted by
- Invitrogen Antibodies (provider)
- Main image
- Experimental details
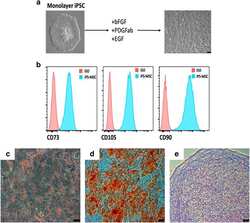
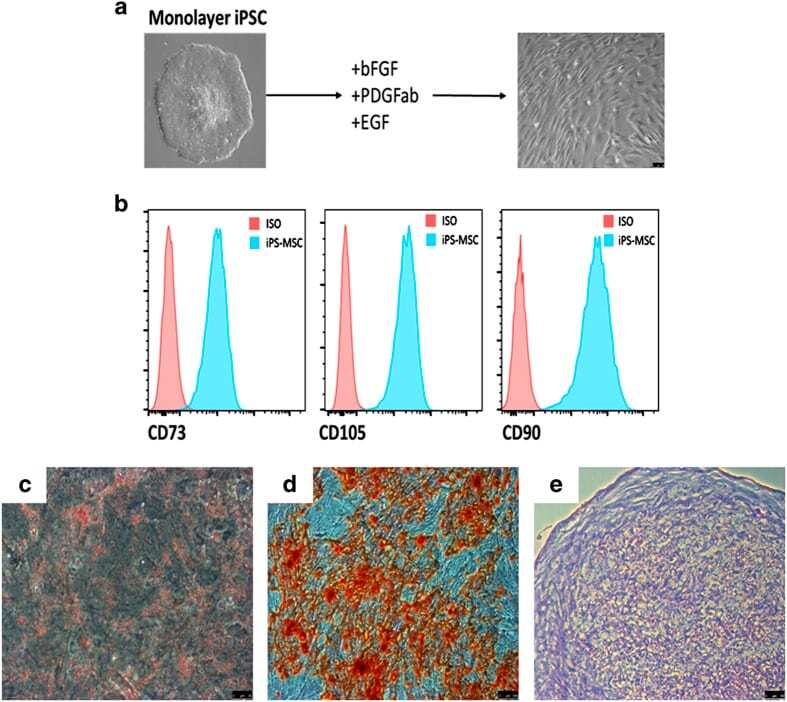
- Figure 3 Mesenchymal stem cell derivation. ( a ) MSC differentiation. Mono-layer iPSCs were subjected to bFGF, PDGFab and EGF resulting in differentiation to a cell population with spindle-shaped morphology (right). ( b ) FACS analysis. Passage 3 MSCs were analysed for cell surface expression of CD73, CD105, and CD90 ( n =3 experiments), and histogram analysis is shown in blue. Isotype antibody control FACS histograms are shown in pink. ( c , d ) Tri-lineage differentiation. ( c ) Oil red-O staining demonstrating the ability of iPSC-derived MSCs to form adipose cells. ( d ) Alizarin red staining of osteogenic progeny. ( e ) Toluidine blue staining of chondrogenic cells from MSCs. ( c - e ) Representative images of at least two different MSC pools and n =3-4 replicates. FACS, fluorescence-activated cell sorting.
- Submitted by
- Invitrogen Antibodies (provider)
- Main image
- Experimental details
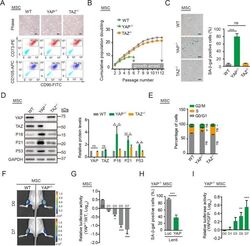
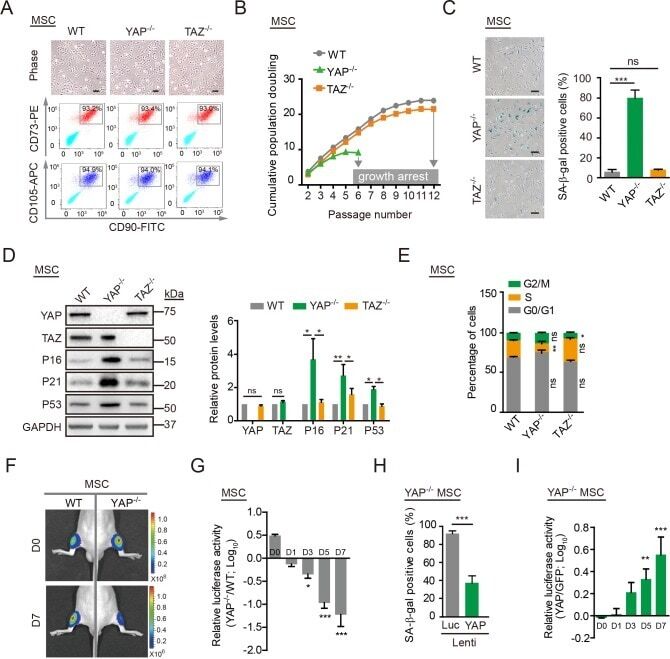
- 10.1371/journal.pbio.3000201.g002 Fig 2 YAP -/- hMSCs exhibit accelerated senescence. (A) Brightfield micrographs and FACS analysis of the surface markers CD105, CD73, and CD90 in WT, YAP -/- , and TAZ -/- hMSCs. Scale bar, 50 mum. (B) Cell growth curves of WT, YAP -/- , and TAZ -/- hMSCs. Data are presented as the mean +- SD, n = 3. (C) SA-beta-gal staining of WT, YAP -/- , and TAZ -/- hMSCs at passage 4. Scale bar, 100 mum. Data are presented as the mean +- SD, n = 3, *** P < 0.001. (D) Western blot analysis of YAP, TAZ, P16, P21, and P53 in WT, YAP -/- , and TAZ -/- hMSCs. GAPDH was used as a loading control (left). The protein levels normalized with GAPDH were shown as fold change relative to WT hMSCs (right). Data are presented as the mean +- SD, n = 3, * P < 0.05, ** P < 0.01. (E) Cell cycle analysis of WT, YAP -/- , and TAZ -/- hMSCs. Data are presented as the mean +- SD, n = 3, * P < 0.05, ** P < 0.01. (F) WT and YAP -/- hMSCs transduced with a lentivirus expressing Luc were injected into the TA muscle of immunodeficient mice. Luc activities were imaged at day (D)0, D1, D3, D5, and D7 after cell implantation. Representative images at D0 and D7 are shown. (G) Data are presented as the ratios of YAP -/- to WT cells (log 10 (fold)), mean +- SD, n = 5, * P < 0.05, *** P < 0.001. (H) SA-beta-gal staining of YAP -/- hMSCs transduced with lentiviruses expressing Luc or YAP. Data are presented as the mean +- SD, n = 3, *** P < 0. 001. (I) YAP -/- hMSCs overexpressing GFP plus
- Submitted by
- Invitrogen Antibodies (provider)
- Main image
- Experimental details
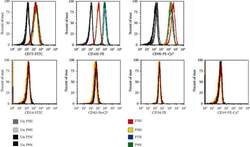
- Figure 2 Flow cytometry of CD cell surface markers for cells cultured under hypoxia and normoxia. The positive CD markers for MSCs as detected by the fluorescent antibodies anti-CD73 FITC, anti-CD105 PE, and anti-CD90 PE Cy7. The negative markers of MSCs were detected using anti-CD14 FITC, anti-CD45 PerCP, anti-CD34-R-PE, and anti-CD19 PE-Cy7 antibodies. Unstained cell for each condition was used as negative controls.
- Submitted by
- Invitrogen Antibodies (provider)
- Main image
- Experimental details
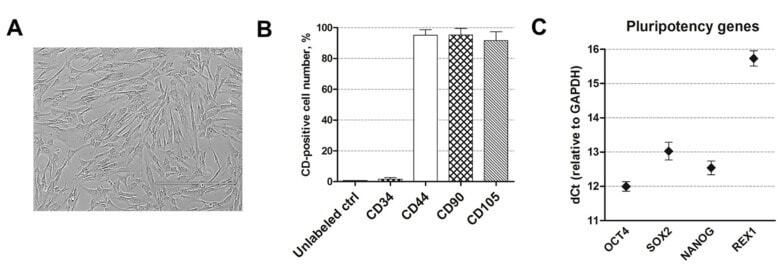
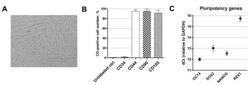
- Figure 1 Human amniotic fluid-derived mesenchymal stem cells (AF-MSCs) characterization. ( A ) The typical morphology of human amniotic fluid-derived mesenchymal stem cells, grown in cell culture. Scale bar = 400 um. ( B ) The expression of the main cell surface markers CD44, CD90, CD105, and CD34 as detected by flow cytometry. Unlabeled ctrl: unlabeled, undifferentiated control cells. Results are presented as the mean +- SD ( n = 3). ( C ) The relative expression of pluripotency gene markers, namely, OCT4, SOX2, NANOG, and REX1, as determined by RT-qPCR. Data, relative to GAPDH, are presented as the mean +- SD ( n = 3).