 Explore
 Validate
 Learn
Learn Western blot
Antibody data
- Antibody Data
- Antigen structure
- References [1]
- Comments [0]
- Validations
- Western blot [5]
- Other assay [3]
Submit
Validation data
Reference
Comment
Report error
- Product number
- PA5-27073 - Provider product page

- Provider
- Invitrogen Antibodies
- Product name
- GRPR Polyclonal Antibody
- Antibody type
- Polyclonal
- Antigen
- Synthetic peptide
- Description
- Recommended positive controls: HeLaS3, Molt-4, mouse pancreas, mouse brain, rat brain, rat pancreas.
- Concentration
- 1 mg/mL
Submitted references NFAT5 Is Involved in GRP-Enhanced Secretion of GLP-1 by Sodium.
Fan C, Asico LD, Villar VAM, Hunt J, Cuevas S, Armando I, Jose PA, Konkalmatt PR
International journal of molecular sciences 2021 Apr 12;22(8)
International journal of molecular sciences 2021 Apr 12;22(8)
No comments: Submit comment
Supportive validation
- Submitted by
- Invitrogen Antibodies (provider)
- Main image
- Experimental details
- Western blot analysis of GRPR using 30 µg of NIH-3T3 lysate. Samples were loaded onto a 10% SDS-PAGE gel and probed with a GRPR polyclonal antibody (Product # PA5-27073) at a dilution of 1:1000.
- Submitted by
- Invitrogen Antibodies (provider)
- Main image
- Experimental details
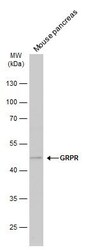
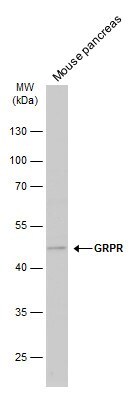
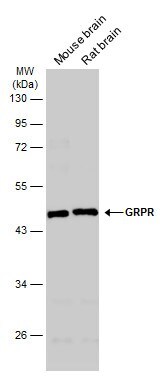
- Western blot analysis of GRPR was performed by separating 50 µg of mouse tissue extract by 10% SDS-PAGE. Proteins were transferred to a membrane and probed with a GRPR Polyclonal Antibody (Product # PA5-27073) at a dilution of 1:1000. The HRP-conjugated anti-rabbit IgG antibody was used to detect the primary antibody.
- Submitted by
- Invitrogen Antibodies (provider)
- Main image
- Experimental details
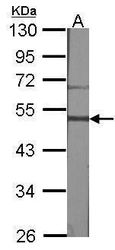
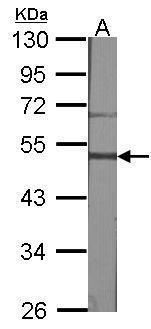
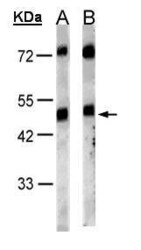
- Western Blot using GRPR Polyclonal Antibody (Product # PA5-27073). Sample (30 µg of whole cell lysate). A: HeLa S3. B: MOLT4SDS PAGE. Z. 10% SDS PAGE. GRPR Polyclonal Antibody (Product # PA5-27073) diluted at 1:1,000.

- Submitted by
- Invitrogen Antibodies (provider)
- Main image
- Experimental details
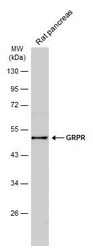
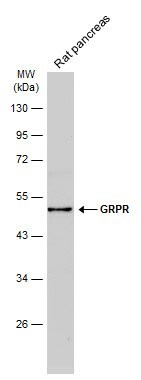
- Western blot analysis of GRPR was performed by separating 50 µg of rat tissue extract by 10% SDS-PAGE. Proteins were transferred to a membrane and probed with a GRPR Polyclonal Antibody (Product # PA5-27073) at a dilution of 1:1000. The HRP-conjugated anti-rabbit IgG antibody was used to detect the primary antibody.
- Submitted by
- Invitrogen Antibodies (provider)
- Main image
- Experimental details
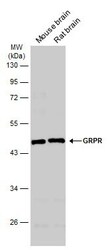
- Western blot analysis of GRPR was performed by separating 50 µg of various tissue extracts by 10% SDS-PAGE. Proteins were transferred to a membrane and probed with a GRPR Polyclonal Antibody (Product # PA5-27073) at a dilution of 1:1000. The HRP-conjugated anti-rabbit IgG antibody was used to detect the primary antibody.
Supportive validation
- Submitted by
- Invitrogen Antibodies (provider)
- Main image
- Experimental details
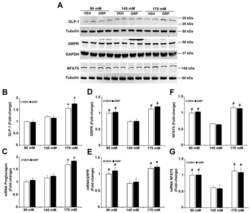
- Figure 3 Expressions of GLP-1, GRPR, and NFAT5 in L-cells exposed to varying NaCl concentrations with or without GRP treatment. The same quantities of L-cells were exposed to 90 mM, 145 mM, or 170 mM NaCl, and treated with vehicle (VEH) or GRP (1000 nM) for 4 h. Expressions of GLP-1, GRPR, NFAT5, and proglucagon in L-cells were measured by immunoblotting and RT-qPCR. ( A ), 1 set of blots from 3 independent experiments. ( B , D , F ), quantifications of GLP-1, GRPR, and NFAT5 protein levels in L-cells after 4-h treatment. GAPDH or tubulin protein was used for normalization of the data. * p < 0.05 vs. 90 mM or 145 mM. # p < 0.05 vs. 145 mM. One-way ANOVA, Holm-Sidak test, n = 3/group. ( C , E , G ), quantifications of proglucagon, GRPR, and NFAT mRNA in L-cells after treatment for 4 h. GAPDH or tubulin mRNA was used for normalization of the data. Quantifications were finally expressed as fold-change, relative to the 90 mM group. * p < 0.05 vs. 90 mM or 145 mM. # p < 0.05 vs. 145 mM. One-way ANOVA, Holm-Sidak test, n = 3/group.

- Submitted by
- Invitrogen Antibodies (provider)
- Main image
- Experimental details
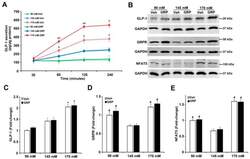
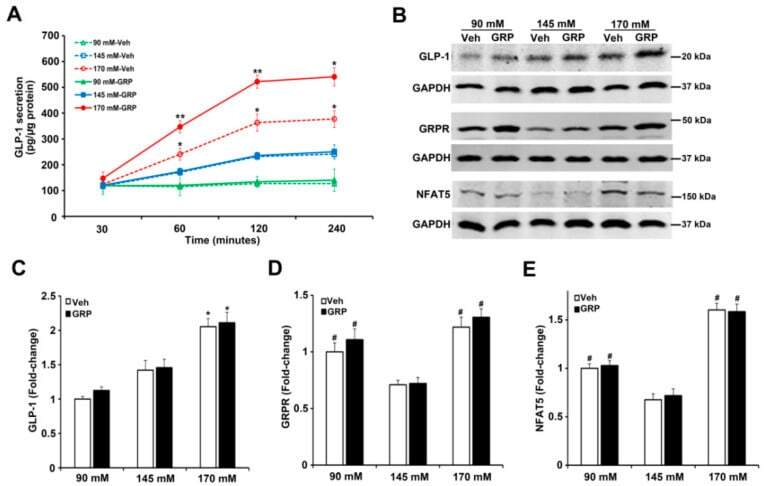
- Figure 4 Effect of different concentrations of sodium and GRP on GLP-1 secretion and expressions of GLP-1, GRPR, and NFAT5 in ileum from BALB/c mice. ( A ) The effect of 90 mM, 145 mM, and 170 mM NaCl on GLP-1 secretion in ileal slices. The ileal slices were exposed to 90 mM, 145 mM, or 170 mM NaCl, and treated with 1000 nM GRP at 30, 60, 120, and 240 min. n = 3/group, * p < 0.05 ** p < 0.01 vs. all others at the same time point, Two-way ANOVA (F = 14.56; p < 0.0001), followed by a Bonferroni multiple comparison test, n = 5/treatment. ( B ) At the end of the treatment, the tissues were collected and subjected to immunoblotting for GLP-1, GRPR, and NFAT5 protein. One set of blots from three independent experiments is shown. ( C - E ) quantifications of GLP-1,GRPR, and NFAT5 protein in ileal slices after treatment for 4 h. GAPDH protein was used for normalization of the data. Quantifications were finally expressed as fold-change, relative to the 90 mM NaCl. n = 3/group, * p < 0.05 vs. 90 mM or 145 mM. # p < 0.05 vs. 145 mM. One-way ANOVA, Holm-Sidak test. VEH = vehicle.
- Submitted by
- Invitrogen Antibodies (provider)
- Main image
- Experimental details
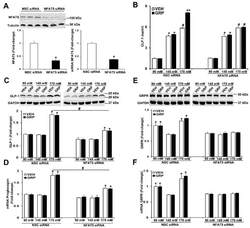
- Figure 5 Silencing NFAT5 minimizes the high sodium-induced increase in GLP-1 secretion and blocks the sodium-induced increase in GRPR expression in human L-cells. ( A ) The same quantity of L-cells was transfected with NFAT5 siRNA or non-silencing (NSC) siRNA. Forty-eight hours after transfection, NFAT5 protein or NFAT5 mRNA was quantified by immunoblotting or RT-qPCR, respectively. Tubulin was used for normalization of the data. Quantifications were finally expressed as fold-change over the NSC siRNA group. n = 3/group, * p < 0.05 vs. NSC siRNA, t -test ( B ) the secretion of GLP-1 was quantified by ELISA in the incubation medium of L-cells. n = 3/group, * p < 0.05 vs. 90 mM. # p < 0.05 vs. 90 mM or 145 mM, ** p < 0.05 vs. others. ( C ) Protein or ( D ) mRNA expression of GLP-1 in human L-cells was quantified by immunoblotting or RT-qPCR, respectively. GAPDH was used for normalization of the data. Quantifications were finally expressed as fold-change over the NSC siRNA 90 mM group. n = 3/group. * p < 0.05 vs. 90 mM or 145 mM. # p < 0.05 NSC siRNA 170 mM vs. NFAT5 siRNA 170 mM. ( E ) Protein or ( F ) mRNA expression of GRPR in human L-cells was quantified by immunoblotting or by RT-qPCR, respectively. GAPDH was used for normalization of the data. Quantifications were finally expressed as fold-change over the NSC siRNA 90 mM group. n = 3/group. * p < 0.05 vs. 145 mM. One-way ANOVA, Holm-Sidak test. VEH = vehicle.
