Explore
 Validate
 Learn
Learn16-5983-203
antibody from Invitrogen Antibodies
Targeting: CD274
B7-H, B7-H1, B7H1, PD-L1, PDCD1LG1, PDL1
 Flow cytometry
Antibody data
- Antibody Data
- Antigen structure
- References [68]
- Comments [0]
- Validations
- Flow cytometry [1]
- Other assay [43]
Submit
Validation data
Reference
Comment
Report error
- Product number
- 16-5983-203 - Provider product page

- Provider
- Invitrogen Antibodies
- Product name
- CD274 (PD-L1, B7-H1) Monoclonal Antibody (MIH1), Functional Grade, eBioscience™
- Antibody type
- Monoclonal
- Antigen
- Other
- Description
- Description: The MIH1 monoclonal antibody reacts with human B7-H1, also known as PD-L1. B7-H1, a member of the B7 family, has a predicted molecular weight of approximately 40 kDa and belongs to the Ig superfamily. B7-H1 is expressed on a majority of leukocytes. B7-H1 is a ligand for PD-1. Interaction of PD-1 with either PD-L1 (B7-H1) or PD-L2 (B7-DC) results in inhibition of T and B cell responses. MIH1 is reported to be a blocking antibody.
- Antibody clone number
- MIH1
- Concentration
- 1 mg/mL
Submitted references Active PD-L1 incorporation within HIV virions functionally impairs T follicular helper cells.
Interleukin 6 regulates the expression of programmed cell death ligand 1 in thyroid cancer.
CD19-targeted CAR regulatory T cells suppress B cell pathology without GvHD.
MicroRNA-200a induces immunosuppression by promoting PTEN-mediated PD-L1 upregulation in osteosarcoma.
Elevated Soluble PD-L1 in Pregnant Women's Serum Suppresses the Immune Reaction.
EBV-associated gastric cancer evades T-cell immunity by PD-1/PD-L1 interactions.
Disruption of PD-1 Enhanced the Anti-tumor Activity of Chimeric Antigen Receptor T Cells Against Hepatocellular Carcinoma.
Poly(I:C) primes primary human glioblastoma cells for an immune response invigorated by PD-L1 blockade.
The PD-L1- and IL6-mediated dampening of the IL27/STAT1 anticancer responses are prevented by α-PD-L1 or α-IL6 antibodies.
Specific expression of PD-L1 in RELA-fusion supratentorial ependymoma: Implications for PD-1-targeted therapy.
ATM‑JAK‑PD‑L1 signaling pathway inhibition decreases EMT and metastasis of androgen‑independent prostate cancer.
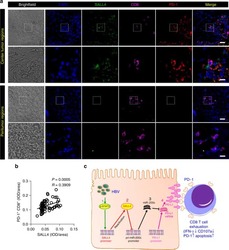
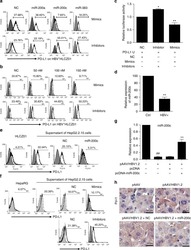
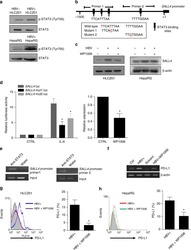
Oncofetal gene SALL4 reactivation by hepatitis B virus counteracts miR-200c in PD-L1-induced T cell exhaustion.
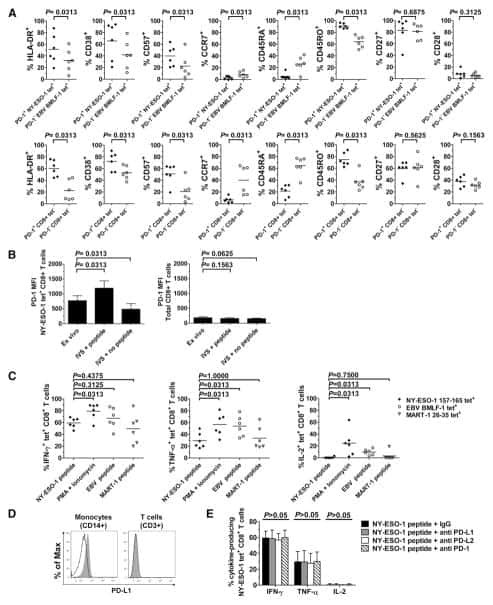
A versatile T cell-based assay to assess therapeutic antigen-specific PD-1-targeted approaches.
Antigen-Presenting Cell-Intrinsic PD-1 Neutralizes PD-L1 in cis to Attenuate PD-1 Signaling in T Cells.
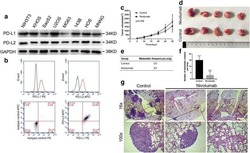
PD-1 axis expression in musculoskeletal tumors and antitumor effect of nivolumab in osteosarcoma model of humanized mouse.
Similarities and differences between helminth parasites and cancer cell lines in shaping human monocytes: Insights into parallel mechanisms of immune evasion.
PD-L1 expression in medulloblastoma: an evaluation by subgroup.
Mesenchymal Stromal Cell Secretion of Programmed Death-1 Ligands Regulates T Cell Mediated Immunosuppression.
Structure-guided development of a high-affinity human Programmed Cell Death-1: Implications for tumor immunotherapy.
Retroviral Replicating Vector Delivery of miR-PDL1 Inhibits Immune Checkpoint PDL1 and Enhances Immune Responses In Vitro.
Oncogenic RAS Signaling Promotes Tumor Immunoresistance by Stabilizing PD-L1 mRNA.
PD-L1/PD-1 expression and tumor-infiltrating lymphocytes in conjunctival melanoma.
PD-L1 expression in human cancers and its association with clinical outcomes.
Regulation of Gag- and Env-Specific CD8+ T Cell Responses in ART-Naïve HIV-Infected Patients: Potential Implications for Individualized Immunotherapy.
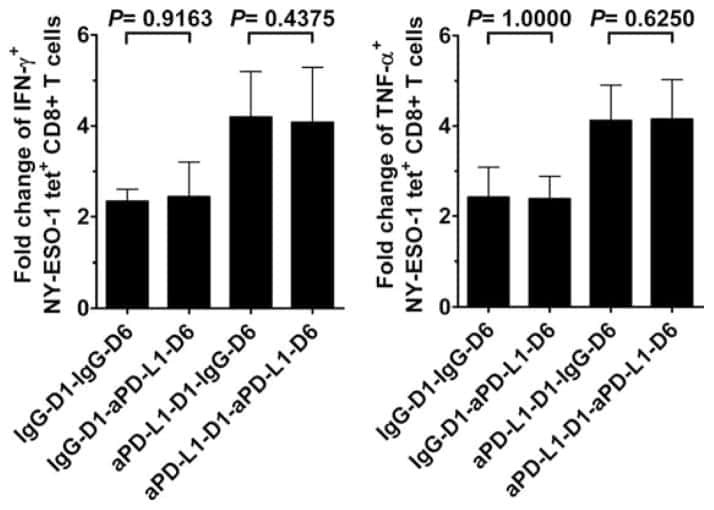
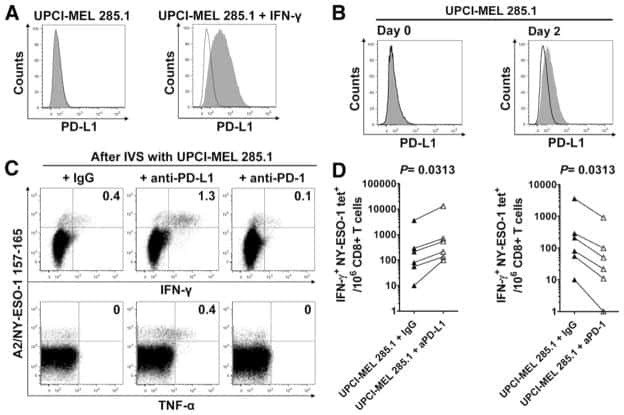
A fully human IgG1 anti-PD-L1 MAb in an in vitro assay enhances antigen-specific T-cell responses.
Polyfunctional Melan-A-specific tumor-reactive CD8(+) T cells elicited by dacarbazine treatment before peptide-vaccination depends on AKT activation sustained by ICOS.
Expression of programmed death 1 ligand 1 on periodontal tissue cells as a possible protective feedback mechanism against periodontal tissue destruction.
CD28 family of receptors on T cells in chronic HBV infection: Expression characteristics, clinical significance and correlations with PD-1 blockade.
Psoriasis is characterized by deficient negative immune regulation compared to transient delayed-type hypersensitivity reactions.
Upregulation of Programmed Death-1 and Its Ligand in Cardiac Injury Models: Interaction with GADD153.
Interleukin-25 Mediates Transcriptional Control of PD-L1 via STAT3 in Multipotent Human Mesenchymal Stromal Cells (hMSCs) to Suppress Th17 Responses.
Lenalidomide Enhances Immune Checkpoint Blockade-Induced Immune Response in Multiple Myeloma.
Manipulating the tumor microenvironment ex vivo for enhanced expansion of tumor-infiltrating lymphocytes for adoptive cell therapy.
Paucity of PD-L1 expression in prostate cancer: innate and adaptive immune resistance.
IL-27 induces the expression of IDO and PD-L1 in human cancer cells.
The upregulation of LAG-3 on T cells defines a subpopulation with functional exhaustion and correlates with disease progression in HIV-infected subjects.
Adoptive TIL transfer in the adjuvant setting for melanoma: long-term patient survival.
B7-H3 and B7-H1 expression in cerebral spinal fluid and tumor tissue correlates with the malignancy grade of glioma patients.
Blockade of the programmed death-1 pathway restores sarcoidosis CD4(+) T-cell proliferative capacity.
Role of programmed death ligands in effective T-cell interactions in extranodal natural killer/T-cell lymphoma.
Synergistic effects of IL-4 and TNFα on the induction of B7-H1 in renal cell carcinoma cells inhibiting allogeneic T cell proliferation.
Staphylococcus aureus convert neonatal conventional CD4(+) T cells into FOXP3(+) CD25(+) CD127(low) T cells via the PD-1/PD-L1 axis.
Immune-escape markers in relation to clinical outcome of advanced melanoma patients following immunotherapy.
NF-κB plays a key role in inducing CD274 expression in human monocytes after lipopolysaccharide treatment.
SHP-1 phosphatase activity counteracts increased T cell receptor affinity.
Monocytes regulate the mechanism of T-cell death by inducing Fas-mediated apoptosis during bacterial infection.
B7-H1, which represses EBV-immortalized B cell killing by autologous T and NK cells, is oppositely regulated by c-Myc and EBV latency III program at both mRNA and secretory lysosome levels.
Upregulation of programmed death-1 on T cells and programmed death ligand-1 on monocytes in septic shock patients.
Phagocytosis, a potential mechanism for myeloid-derived suppressor cell regulation of CD8+ T cell function mediated through programmed cell death-1 and programmed cell death-1 ligand interaction.
T-cell immune function in tumor, skin, and peripheral blood of advanced stage melanoma patients: implications for immunotherapy.
Dual function of the NK cell receptor 2B4 (CD244) in the regulation of HCV-specific CD8+ T cells.
Ex vivo expanded hematopoietic stem cells overcome the MHC barrier in allogeneic transplantation.
Impaired hepatitis B vaccine responses during chronic hepatitis C infection: involvement of the PD-1 pathway in regulating CD4(+) T cell responses.
Identification of a soluble form of B7-H1 that retains immunosuppressive activity and is associated with aggressive renal cell carcinoma.
The PD-1/PD-L1 axis modulates the natural killer cell versus multiple myeloma effect: a therapeutic target for CT-011, a novel monoclonal anti-PD-1 antibody.
Upregulation of Tim-3 and PD-1 expression is associated with tumor antigen-specific CD8+ T cell dysfunction in melanoma patients.
Programmed Death-1 expression on Epstein Barr virus specific CD8+ T cells varies by stage of infection, epitope specificity, and T-cell receptor usage.
Cytokine induced expression of programmed death ligands in human neutrophils.
Regulatory T cells differentially modulate the maturation and apoptosis of human CD8+ T-cell subsets.
PD-1 is a regulator of NY-ESO-1-specific CD8+ T cell expansion in melanoma patients.
PD-L1 expression on human ocular cells and its possible role in regulating immune-mediated ocular inflammation.
B7-H1 is correlated with malignancy-grade gliomas but is not expressed exclusively on tumor stem-like cells.
Profile of tumor antigen-specific CD8 T cells in patients with hepatitis B virus-related hepatocellular carcinoma.
Neuron-interacting satellite glial cells in human trigeminal ganglia have an APC phenotype.
PD-L1: PD-1 interaction contributes to the functional suppression of T-cell responses to human uveal melanoma cells in vitro.
Expression of B7-H1 in inflammatory renal tubular epithelial cells.
PD-1 is a regulator of virus-specific CD8+ T cell survival in HIV infection.
Clinical significance of programmed death-1 ligand-1 and programmed death-1 ligand-2 expression in human esophageal cancer.
Munoz O, Banga R, Schelling R, Procopio FA, Mastrangelo A, Nortier P, Ohmiti K, Daraspe J, Cavassini M, Fenwick C, Perez L, Perreau M
PLoS pathogens 2022 Jul;18(7):e1010673
PLoS pathogens 2022 Jul;18(7):e1010673
Interleukin 6 regulates the expression of programmed cell death ligand 1 in thyroid cancer.
Zhang GQ, Jiao Q, Shen CT, Song HJ, Zhang HZ, Qiu ZL, Luo QY
Cancer science 2021 Mar;112(3):997-1010
Cancer science 2021 Mar;112(3):997-1010
CD19-targeted CAR regulatory T cells suppress B cell pathology without GvHD.
Imura Y, Ando M, Kondo T, Ito M, Yoshimura A
JCI insight 2020 Jul 23;5(14)
JCI insight 2020 Jul 23;5(14)
MicroRNA-200a induces immunosuppression by promoting PTEN-mediated PD-L1 upregulation in osteosarcoma.
Liu Z, Wen J, Wu C, Hu C, Wang J, Bao Q, Wang H, Wang J, Zhou Q, Wei L, Shen Y, Zhang W
Aging 2020 Jan 24;12(2):1213-1236
Aging 2020 Jan 24;12(2):1213-1236
Elevated Soluble PD-L1 in Pregnant Women's Serum Suppresses the Immune Reaction.
Okuyama M, Mezawa H, Kawai T, Urashima M
Frontiers in immunology 2019;10:86
Frontiers in immunology 2019;10:86
EBV-associated gastric cancer evades T-cell immunity by PD-1/PD-L1 interactions.
Sasaki S, Nishikawa J, Sakai K, Iizasa H, Yoshiyama H, Yanagihara M, Shuto T, Shimokuri K, Kanda T, Suehiro Y, Yamasaki T, Sakaida I
Gastric cancer : official journal of the International Gastric Cancer Association and the Japanese Gastric Cancer Association 2019 May;22(3):486-496
Gastric cancer : official journal of the International Gastric Cancer Association and the Japanese Gastric Cancer Association 2019 May;22(3):486-496
Disruption of PD-1 Enhanced the Anti-tumor Activity of Chimeric Antigen Receptor T Cells Against Hepatocellular Carcinoma.
Guo X, Jiang H, Shi B, Zhou M, Zhang H, Shi Z, Du G, Luo H, Wu X, Wang Y, Sun R, Li Z
Frontiers in pharmacology 2018;9:1118
Frontiers in pharmacology 2018;9:1118
Poly(I:C) primes primary human glioblastoma cells for an immune response invigorated by PD-L1 blockade.
De Waele J, Marcq E, Van Audenaerde JR, Van Loenhout J, Deben C, Zwaenepoel K, Van de Kelft E, Van der Planken D, Menovsky T, Van den Bergh JM, Willemen Y, Pauwels P, Berneman ZN, Lardon F, Peeters M, Wouters A, Smits EL
Oncoimmunology 2018;7(3):e1407899
Oncoimmunology 2018;7(3):e1407899
The PD-L1- and IL6-mediated dampening of the IL27/STAT1 anticancer responses are prevented by α-PD-L1 or α-IL6 antibodies.
Rolvering C, Zimmer AD, Ginolhac A, Margue C, Kirchmeyer M, Servais F, Hermanns HM, Hergovits S, Nazarov PV, Nicot N, Kreis S, Haan S, Behrmann I, Haan C
Journal of leukocyte biology 2018 Nov;104(5):969-985
Journal of leukocyte biology 2018 Nov;104(5):969-985
Specific expression of PD-L1 in RELA-fusion supratentorial ependymoma: Implications for PD-1-targeted therapy.
Witt DA, Donson AM, Amani V, Moreira DC, Sanford B, Hoffman LM, Handler MH, Levy JMM, Jones KL, Nellan A, Foreman NK, Griesinger AM
Pediatric blood & cancer 2018 May;65(5):e26960
Pediatric blood & cancer 2018 May;65(5):e26960
ATM‑JAK‑PD‑L1 signaling pathway inhibition decreases EMT and metastasis of androgen‑independent prostate cancer.
Zhang L, Xu LJ, Zhu J, Li J, Xue BX, Gao J, Sun CY, Zang YC, Zhou YB, Yang DR, Shan YX
Molecular medicine reports 2018 May;17(5):7045-7054
Molecular medicine reports 2018 May;17(5):7045-7054
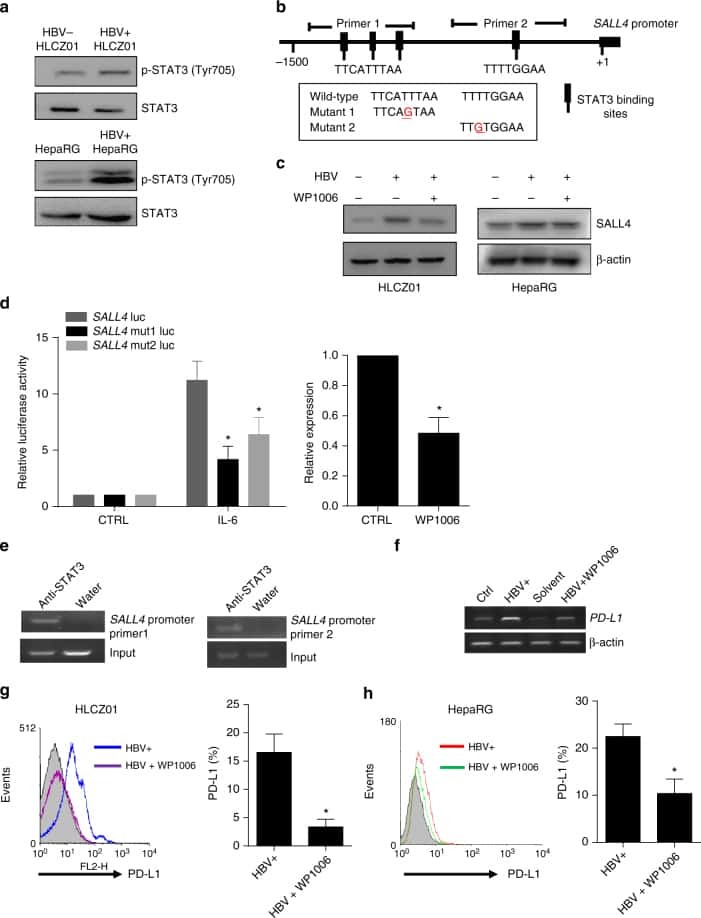
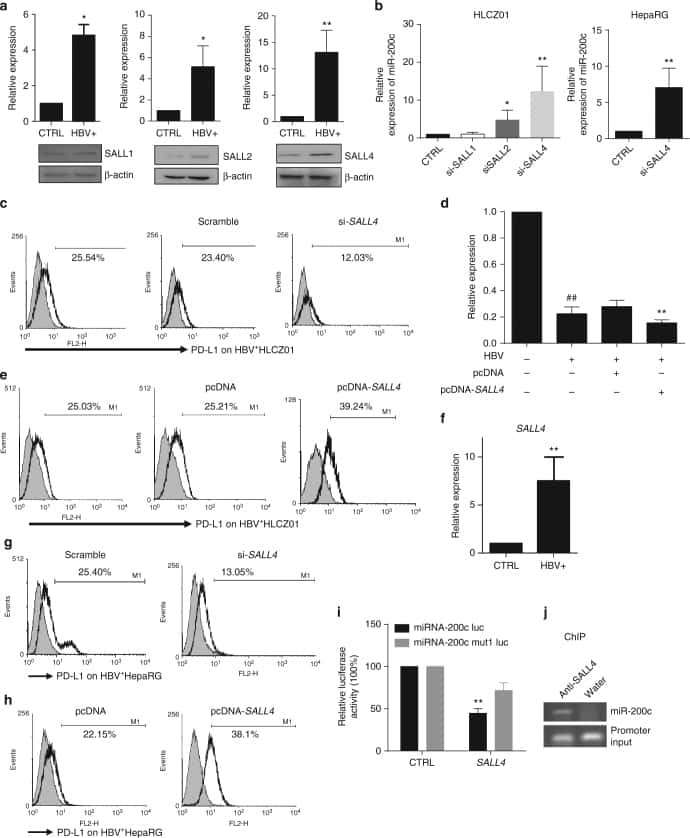
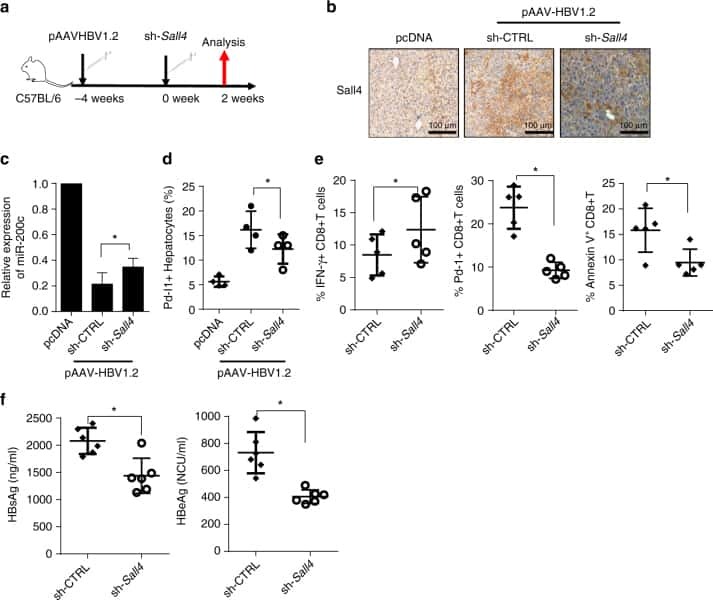
Oncofetal gene SALL4 reactivation by hepatitis B virus counteracts miR-200c in PD-L1-induced T cell exhaustion.
Sun C, Lan P, Han Q, Huang M, Zhang Z, Xu G, Song J, Wang J, Wei H, Zhang J, Sun R, Zhang C, Tian Z
Nature communications 2018 Mar 28;9(1):1241
Nature communications 2018 Mar 28;9(1):1241
A versatile T cell-based assay to assess therapeutic antigen-specific PD-1-targeted approaches.
Versteven M, Van den Bergh JMJ, Broos K, Fujiki F, Campillo-Davo D, De Reu H, Morimoto S, Lecocq Q, Keyaerts M, Berneman Z, Sugiyama H, Van Tendeloo VFI, Breckpot K, Lion E
Oncotarget 2018 Jun 12;9(45):27797-27808
Oncotarget 2018 Jun 12;9(45):27797-27808
Antigen-Presenting Cell-Intrinsic PD-1 Neutralizes PD-L1 in cis to Attenuate PD-1 Signaling in T Cells.
Zhao Y, Harrison DL, Song Y, Ji J, Huang J, Hui E
Cell reports 2018 Jul 10;24(2):379-390.e6
Cell reports 2018 Jul 10;24(2):379-390.e6
PD-1 axis expression in musculoskeletal tumors and antitumor effect of nivolumab in osteosarcoma model of humanized mouse.
Zheng B, Ren T, Huang Y, Sun K, Wang S, Bao X, Liu K, Guo W
Journal of hematology & oncology 2018 Feb 6;11(1):16
Journal of hematology & oncology 2018 Feb 6;11(1):16
Similarities and differences between helminth parasites and cancer cell lines in shaping human monocytes: Insights into parallel mechanisms of immune evasion.
Narasimhan PB, Akabas L, Tariq S, Huda N, Bennuru S, Sabzevari H, Hofmeister R, Nutman TB, Tolouei Semnani R
PLoS neglected tropical diseases 2018 Apr;12(4):e0006404
PLoS neglected tropical diseases 2018 Apr;12(4):e0006404
PD-L1 expression in medulloblastoma: an evaluation by subgroup.
Martin AM, Nirschl CJ, Polanczyk MJ, Bell WR, Nirschl TR, Harris-Bookman S, Phallen J, Hicks J, Martinez D, Ogurtsova A, Xu H, Sullivan LM, Meeker AK, Raabe EH, Cohen KJ, Eberhart CG, Burger PC, Santi M, Taube JM, Pardoll DM, Drake CG, Lim M
Oncotarget 2018 Apr 10;9(27):19177-19191
Oncotarget 2018 Apr 10;9(27):19177-19191
Mesenchymal Stromal Cell Secretion of Programmed Death-1 Ligands Regulates T Cell Mediated Immunosuppression.
Davies LC, Heldring N, Kadri N, Le Blanc K
Stem cells (Dayton, Ohio) 2017 Mar;35(3):766-776
Stem cells (Dayton, Ohio) 2017 Mar;35(3):766-776
Structure-guided development of a high-affinity human Programmed Cell Death-1: Implications for tumor immunotherapy.
Lázár-Molnár E, Scandiuzzi L, Basu I, Quinn T, Sylvestre E, Palmieri E, Ramagopal UA, Nathenson SG, Guha C, Almo SC
EBioMedicine 2017 Mar;17:30-44
EBioMedicine 2017 Mar;17:30-44
Retroviral Replicating Vector Delivery of miR-PDL1 Inhibits Immune Checkpoint PDL1 and Enhances Immune Responses In Vitro.
Lin AH, Twitty CG, Burnett R, Hofacre A, Mitchell LA, Espinoza FL, Gruber HE, Jolly DJ
Molecular therapy. Nucleic acids 2017 Mar 17;6:221-232
Molecular therapy. Nucleic acids 2017 Mar 17;6:221-232
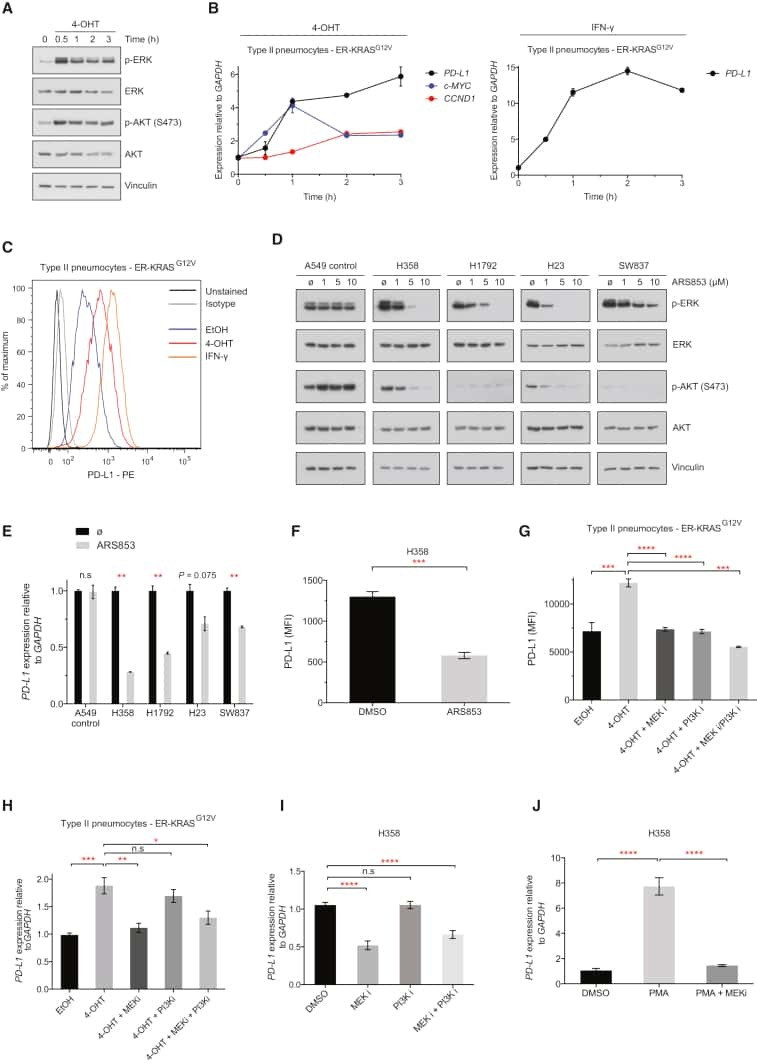
Oncogenic RAS Signaling Promotes Tumor Immunoresistance by Stabilizing PD-L1 mRNA.
Coelho MA, de Carné Trécesson S, Rana S, Zecchin D, Moore C, Molina-Arcas M, East P, Spencer-Dene B, Nye E, Barnouin K, Snijders AP, Lai WS, Blackshear PJ, Downward J
Immunity 2017 Dec 19;47(6):1083-1099.e6
Immunity 2017 Dec 19;47(6):1083-1099.e6
PD-L1/PD-1 expression and tumor-infiltrating lymphocytes in conjunctival melanoma.
Cao J, Brouwer NJ, Richards KE, Marinkovic M, van Duinen S, Hurkmans D, Verdegaal EME, Jordanova ES, Jager MJ
Oncotarget 2017 Aug 15;8(33):54722-54734
Oncotarget 2017 Aug 15;8(33):54722-54734
PD-L1 expression in human cancers and its association with clinical outcomes.
Wang X, Teng F, Kong L, Yu J
OncoTargets and therapy 2016;9:5023-39
OncoTargets and therapy 2016;9:5023-39
Regulation of Gag- and Env-Specific CD8+ T Cell Responses in ART-Naïve HIV-Infected Patients: Potential Implications for Individualized Immunotherapy.
Prebensen C, Lind A, Dyrhol-Riise AM, Kvale D
PloS one 2016;11(4):e0153849
PloS one 2016;11(4):e0153849
A fully human IgG1 anti-PD-L1 MAb in an in vitro assay enhances antigen-specific T-cell responses.
Grenga I, Donahue RN, Lepone LM, Richards J, Schlom J
Clinical & translational immunology 2016 May;5(5):e83
Clinical & translational immunology 2016 May;5(5):e83
Polyfunctional Melan-A-specific tumor-reactive CD8(+) T cells elicited by dacarbazine treatment before peptide-vaccination depends on AKT activation sustained by ICOS.
Franzese O, Palermo B, Di Donna C, Sperduti I, Ferraresi V, Stabile H, Gismondi A, Santoni A, Nisticò P
Oncoimmunology 2016 May;5(5):e1114203
Oncoimmunology 2016 May;5(5):e1114203
Expression of programmed death 1 ligand 1 on periodontal tissue cells as a possible protective feedback mechanism against periodontal tissue destruction.
Zhang J, Wang CM, Zhang P, Wang X, Chen J, Yang J, Lu W, Zhou W, Yuan W, Feng Y
Molecular medicine reports 2016 Mar;13(3):2423-30
Molecular medicine reports 2016 Mar;13(3):2423-30
CD28 family of receptors on T cells in chronic HBV infection: Expression characteristics, clinical significance and correlations with PD-1 blockade.
Tang ZS, Hao YH, Zhang EJ, Xu CL, Zhou Y, Zheng X, Yang DL
Molecular medicine reports 2016 Aug;14(2):1107-16
Molecular medicine reports 2016 Aug;14(2):1107-16
Psoriasis is characterized by deficient negative immune regulation compared to transient delayed-type hypersensitivity reactions.
Gulati N, Suárez-Fariñas M, Correa da Rosa J, Krueger JG
F1000Research 2015;4:149
F1000Research 2015;4:149
Upregulation of Programmed Death-1 and Its Ligand in Cardiac Injury Models: Interaction with GADD153.
Baban B, Liu JY, Qin X, Weintraub NL, Mozaffari MS
PloS one 2015;10(4):e0124059
PloS one 2015;10(4):e0124059
Interleukin-25 Mediates Transcriptional Control of PD-L1 via STAT3 in Multipotent Human Mesenchymal Stromal Cells (hMSCs) to Suppress Th17 Responses.
Wang WB, Yen ML, Liu KJ, Hsu PJ, Lin MH, Chen PM, Sudhir PR, Chen CH, Chen CH, Sytwu HK, Yen BL
Stem cell reports 2015 Sep 8;5(3):392-404
Stem cell reports 2015 Sep 8;5(3):392-404
Lenalidomide Enhances Immune Checkpoint Blockade-Induced Immune Response in Multiple Myeloma.
Görgün G, Samur MK, Cowens KB, Paula S, Bianchi G, Anderson JE, White RE, Singh A, Ohguchi H, Suzuki R, Kikuchi S, Harada T, Hideshima T, Tai YT, Laubach JP, Raje N, Magrangeas F, Minvielle S, Avet-Loiseau H, Munshi NC, Dorfman DM, Richardson PG, Anderson KC
Clinical cancer research : an official journal of the American Association for Cancer Research 2015 Oct 15;21(20):4607-18
Clinical cancer research : an official journal of the American Association for Cancer Research 2015 Oct 15;21(20):4607-18
Manipulating the tumor microenvironment ex vivo for enhanced expansion of tumor-infiltrating lymphocytes for adoptive cell therapy.
Chacon JA, Sarnaik AA, Chen JQ, Creasy C, Kale C, Robinson J, Weber J, Hwu P, Pilon-Thomas S, Radvanyi L
Clinical cancer research : an official journal of the American Association for Cancer Research 2015 Feb 1;21(3):611-21
Clinical cancer research : an official journal of the American Association for Cancer Research 2015 Feb 1;21(3):611-21
Paucity of PD-L1 expression in prostate cancer: innate and adaptive immune resistance.
Martin AM, Nirschl TR, Nirschl CJ, Francica BJ, Kochel CM, van Bokhoven A, Meeker AK, Lucia MS, Anders RA, DeMarzo AM, Drake CG
Prostate cancer and prostatic diseases 2015 Dec;18(4):325-32
Prostate cancer and prostatic diseases 2015 Dec;18(4):325-32
IL-27 induces the expression of IDO and PD-L1 in human cancer cells.
Carbotti G, Barisione G, Airoldi I, Mezzanzanica D, Bagnoli M, Ferrero S, Petretto A, Fabbi M, Ferrini S
Oncotarget 2015 Dec 22;6(41):43267-80
Oncotarget 2015 Dec 22;6(41):43267-80
The upregulation of LAG-3 on T cells defines a subpopulation with functional exhaustion and correlates with disease progression in HIV-infected subjects.
Tian X, Zhang A, Qiu C, Wang W, Yang Y, Qiu C, Liu A, Zhu L, Yuan S, Hu H, Wang W, Wei Q, Zhang X, Xu J
Journal of immunology (Baltimore, Md. : 1950) 2015 Apr 15;194(8):3873-82
Journal of immunology (Baltimore, Md. : 1950) 2015 Apr 15;194(8):3873-82
Adoptive TIL transfer in the adjuvant setting for melanoma: long-term patient survival.
Khammari A, Knol AC, Nguyen JM, Bossard C, Denis MG, Pandolfino MC, Quéreux G, Bercegeay S, Dréno B
Journal of immunology research 2014;2014:186212
Journal of immunology research 2014;2014:186212
B7-H3 and B7-H1 expression in cerebral spinal fluid and tumor tissue correlates with the malignancy grade of glioma patients.
Baral A, Ye HX, Jiang PC, Yao Y, Mao Y
Oncology letters 2014 Sep;8(3):1195-1201
Oncology letters 2014 Sep;8(3):1195-1201
Blockade of the programmed death-1 pathway restores sarcoidosis CD4(+) T-cell proliferative capacity.
Braun NA, Celada LJ, Herazo-Maya JD, Abraham S, Shaginurova G, Sevin CM, Grutters J, Culver DA, Dworski R, Sheller J, Massion PP, Polosukhin VV, Johnson JE, Kaminski N, Wilkes DS, Oswald-Richter KA, Drake WP
American journal of respiratory and critical care medicine 2014 Sep 1;190(5):560-71
American journal of respiratory and critical care medicine 2014 Sep 1;190(5):560-71
Role of programmed death ligands in effective T-cell interactions in extranodal natural killer/T-cell lymphoma.
Han L, Liu F, Li R, Li Z, Chen X, Zhou Z, Zhang X, Hu T, Zhang Y, Young K, Sun S, Wen J, Zhang M
Oncology letters 2014 Oct;8(4):1461-1469
Oncology letters 2014 Oct;8(4):1461-1469
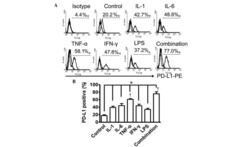
Synergistic effects of IL-4 and TNFα on the induction of B7-H1 in renal cell carcinoma cells inhibiting allogeneic T cell proliferation.
Quandt D, Jasinski-Bergner S, Müller U, Schulze B, Seliger B
Journal of translational medicine 2014 May 30;12:151
Journal of translational medicine 2014 May 30;12:151
Staphylococcus aureus convert neonatal conventional CD4(+) T cells into FOXP3(+) CD25(+) CD127(low) T cells via the PD-1/PD-L1 axis.
Rabe H, Nordström I, Andersson K, Lundell AC, Rudin A
Immunology 2014 Mar;141(3):467-81
Immunology 2014 Mar;141(3):467-81
Immune-escape markers in relation to clinical outcome of advanced melanoma patients following immunotherapy.
Tjin EP, Krebbers G, Meijlink KJ, van de Kasteele W, Rosenberg EH, Sanders J, Nederlof PM, van de Wiel BA, Haanen JB, Melief CJ, Vyth-Dreese FA, Luiten RM
Cancer immunology research 2014 Jun;2(6):538-46
Cancer immunology research 2014 Jun;2(6):538-46
NF-κB plays a key role in inducing CD274 expression in human monocytes after lipopolysaccharide treatment.
Huang G, Wen Q, Zhao Y, Gao Q, Bai Y
PloS one 2013;8(4):e61602
PloS one 2013;8(4):e61602
SHP-1 phosphatase activity counteracts increased T cell receptor affinity.
Hebeisen M, Baitsch L, Presotto D, Baumgaertner P, Romero P, Michielin O, Speiser DE, Rufer N
The Journal of clinical investigation 2013 Mar;123(3):1044-56
The Journal of clinical investigation 2013 Mar;123(3):1044-56
Monocytes regulate the mechanism of T-cell death by inducing Fas-mediated apoptosis during bacterial infection.
Daigneault M, De Silva TI, Bewley MA, Preston JA, Marriott HM, Mitchell AM, Mitchell TJ, Read RC, Whyte MK, Dockrell DH
PLoS pathogens 2012;8(7):e1002814
PLoS pathogens 2012;8(7):e1002814
B7-H1, which represses EBV-immortalized B cell killing by autologous T and NK cells, is oppositely regulated by c-Myc and EBV latency III program at both mRNA and secretory lysosome levels.
Durand-Panteix S, Farhat M, Youlyouz-Marfak I, Rouaud P, Ouk-Martin C, David A, Faumont N, Feuillard J, Jayat-Vignoles C
Journal of immunology (Baltimore, Md. : 1950) 2012 Jul 1;189(1):181-90
Journal of immunology (Baltimore, Md. : 1950) 2012 Jul 1;189(1):181-90
Upregulation of programmed death-1 on T cells and programmed death ligand-1 on monocytes in septic shock patients.
Zhang Y, Li J, Lou J, Zhou Y, Bo L, Zhu J, Zhu K, Wan X, Cai Z, Deng X
Critical care (London, England) 2011;15(1):R70
Critical care (London, England) 2011;15(1):R70
Phagocytosis, a potential mechanism for myeloid-derived suppressor cell regulation of CD8+ T cell function mediated through programmed cell death-1 and programmed cell death-1 ligand interaction.
Kim YJ, Park SJ, Broxmeyer HE
Journal of immunology (Baltimore, Md. : 1950) 2011 Sep 1;187(5):2291-301
Journal of immunology (Baltimore, Md. : 1950) 2011 Sep 1;187(5):2291-301
T-cell immune function in tumor, skin, and peripheral blood of advanced stage melanoma patients: implications for immunotherapy.
Tjin EP, Konijnenberg D, Krebbers G, Mallo H, Drijfhout JW, Franken KL, van der Horst CM, Bos JD, Nieweg OE, Kroon BB, Haanen JB, Melief CJ, Vyth-Dreese FA, Luiten RM
Clinical cancer research : an official journal of the American Association for Cancer Research 2011 Sep 1;17(17):5736-47
Clinical cancer research : an official journal of the American Association for Cancer Research 2011 Sep 1;17(17):5736-47
Dual function of the NK cell receptor 2B4 (CD244) in the regulation of HCV-specific CD8+ T cells.
Schlaphoff V, Lunemann S, Suneetha PV, Jaroszewicz J, Grabowski J, Dietz J, Helfritz F, Bektas H, Sarrazin C, Manns MP, Cornberg M, Wedemeyer H
PLoS pathogens 2011 May;7(5):e1002045
PLoS pathogens 2011 May;7(5):e1002045
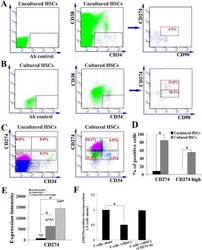
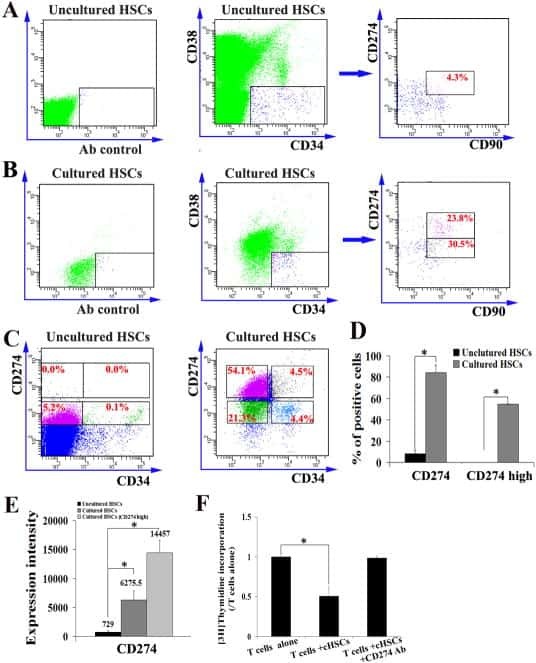
Ex vivo expanded hematopoietic stem cells overcome the MHC barrier in allogeneic transplantation.
Zheng J, Umikawa M, Zhang S, Huynh H, Silvany R, Chen BP, Chen L, Zhang CC
Cell stem cell 2011 Aug 5;9(2):119-30
Cell stem cell 2011 Aug 5;9(2):119-30
Impaired hepatitis B vaccine responses during chronic hepatitis C infection: involvement of the PD-1 pathway in regulating CD4(+) T cell responses.
Moorman JP, Zhang CL, Ni L, Ma CJ, Zhang Y, Wu XY, Thayer P, Islam TM, Borthwick T, Yao ZQ
Vaccine 2011 Apr 12;29(17):3169-76
Vaccine 2011 Apr 12;29(17):3169-76
Identification of a soluble form of B7-H1 that retains immunosuppressive activity and is associated with aggressive renal cell carcinoma.
Frigola X, Inman BA, Lohse CM, Krco CJ, Cheville JC, Thompson RH, Leibovich B, Blute ML, Dong H, Kwon ED
Clinical cancer research : an official journal of the American Association for Cancer Research 2011 Apr 1;17(7):1915-23
Clinical cancer research : an official journal of the American Association for Cancer Research 2011 Apr 1;17(7):1915-23
The PD-1/PD-L1 axis modulates the natural killer cell versus multiple myeloma effect: a therapeutic target for CT-011, a novel monoclonal anti-PD-1 antibody.
Benson DM Jr, Bakan CE, Mishra A, Hofmeister CC, Efebera Y, Becknell B, Baiocchi RA, Zhang J, Yu J, Smith MK, Greenfield CN, Porcu P, Devine SM, Rotem-Yehudar R, Lozanski G, Byrd JC, Caligiuri MA
Blood 2010 Sep 30;116(13):2286-94
Blood 2010 Sep 30;116(13):2286-94
Upregulation of Tim-3 and PD-1 expression is associated with tumor antigen-specific CD8+ T cell dysfunction in melanoma patients.
Fourcade J, Sun Z, Benallaoua M, Guillaume P, Luescher IF, Sander C, Kirkwood JM, Kuchroo V, Zarour HM
The Journal of experimental medicine 2010 Sep 27;207(10):2175-86
The Journal of experimental medicine 2010 Sep 27;207(10):2175-86
Programmed Death-1 expression on Epstein Barr virus specific CD8+ T cells varies by stage of infection, epitope specificity, and T-cell receptor usage.
Greenough TC, Campellone SC, Brody R, Jain S, Sanchez-Merino V, Somasundaran M, Luzuriaga K
PloS one 2010 Sep 23;5(9):e12926
PloS one 2010 Sep 23;5(9):e12926
Cytokine induced expression of programmed death ligands in human neutrophils.
Bankey PE, Banerjee S, Zucchiatti A, De M, Sleem RW, Lin CF, Miller-Graziano CL, De AK
Immunology letters 2010 Apr 8;129(2):100-7
Immunology letters 2010 Apr 8;129(2):100-7
Regulatory T cells differentially modulate the maturation and apoptosis of human CD8+ T-cell subsets.
Nikolova M, Lelievre JD, Carriere M, Bensussan A, Lévy Y
Blood 2009 May 7;113(19):4556-65
Blood 2009 May 7;113(19):4556-65
PD-1 is a regulator of NY-ESO-1-specific CD8+ T cell expansion in melanoma patients.
Fourcade J, Kudela P, Sun Z, Shen H, Land SR, Lenzner D, Guillaume P, Luescher IF, Sander C, Ferrone S, Kirkwood JM, Zarour HM
Journal of immunology (Baltimore, Md. : 1950) 2009 May 1;182(9):5240-9
Journal of immunology (Baltimore, Md. : 1950) 2009 May 1;182(9):5240-9
PD-L1 expression on human ocular cells and its possible role in regulating immune-mediated ocular inflammation.
Yang W, Li H, Chen PW, Alizadeh H, He Y, Hogan RN, Niederkorn JY
Investigative ophthalmology & visual science 2009 Jan;50(1):273-80
Investigative ophthalmology & visual science 2009 Jan;50(1):273-80
B7-H1 is correlated with malignancy-grade gliomas but is not expressed exclusively on tumor stem-like cells.
Yao Y, Tao R, Wang X, Wang Y, Mao Y, Zhou LF
Neuro-oncology 2009 Dec;11(6):757-66
Neuro-oncology 2009 Dec;11(6):757-66
Profile of tumor antigen-specific CD8 T cells in patients with hepatitis B virus-related hepatocellular carcinoma.
Gehring AJ, Ho ZZ, Tan AT, Aung MO, Lee KH, Tan KC, Lim SG, Bertoletti A
Gastroenterology 2009 Aug;137(2):682-90
Gastroenterology 2009 Aug;137(2):682-90
Neuron-interacting satellite glial cells in human trigeminal ganglia have an APC phenotype.
van Velzen M, Laman JD, Kleinjan A, Poot A, Osterhaus AD, Verjans GM
Journal of immunology (Baltimore, Md. : 1950) 2009 Aug 15;183(4):2456-61
Journal of immunology (Baltimore, Md. : 1950) 2009 Aug 15;183(4):2456-61
PD-L1: PD-1 interaction contributes to the functional suppression of T-cell responses to human uveal melanoma cells in vitro.
Yang W, Chen PW, Li H, Alizadeh H, Niederkorn JY
Investigative ophthalmology & visual science 2008 Jun;49(6):2518-25
Investigative ophthalmology & visual science 2008 Jun;49(6):2518-25
Expression of B7-H1 in inflammatory renal tubular epithelial cells.
Chen Y, Zhang J, Li J, Zou L, Zhao T, Tang Y, Wu Y
Nephron. Experimental nephrology 2006;102(3-4):e81-92
Nephron. Experimental nephrology 2006;102(3-4):e81-92
PD-1 is a regulator of virus-specific CD8+ T cell survival in HIV infection.
Petrovas C, Casazza JP, Brenchley JM, Price DA, Gostick E, Adams WC, Precopio ML, Schacker T, Roederer M, Douek DC, Koup RA
The Journal of experimental medicine 2006 Oct 2;203(10):2281-92
The Journal of experimental medicine 2006 Oct 2;203(10):2281-92
Clinical significance of programmed death-1 ligand-1 and programmed death-1 ligand-2 expression in human esophageal cancer.
Ohigashi Y, Sho M, Yamada Y, Tsurui Y, Hamada K, Ikeda N, Mizuno T, Yoriki R, Kashizuka H, Yane K, Tsushima F, Otsuki N, Yagita H, Azuma M, Nakajima Y
Clinical cancer research : an official journal of the American Association for Cancer Research 2005 Apr 15;11(8):2947-53
Clinical cancer research : an official journal of the American Association for Cancer Research 2005 Apr 15;11(8):2947-53
No comments: Submit comment
Supportive validation
- Submitted by
- Invitrogen Antibodies (provider)
- Main image
- Experimental details
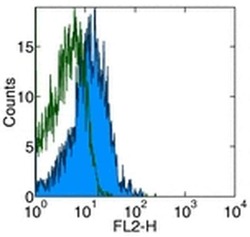
- Staining of normal human peripheral blood cells with Anti-Human CD274 (B7-H1) PE.Appropriate isotype controls were used (open histogram).Cells in the lymphocyte population were used for analysis.

Supportive validation
- Submitted by
- Invitrogen Antibodies (provider)
- Main image

- Experimental details
- NULL

- Submitted by
- Invitrogen Antibodies (provider)
- Main image
- Experimental details
- NULL

- Submitted by
- Invitrogen Antibodies (provider)
- Main image

- Experimental details
- NULL
- Submitted by
- Invitrogen Antibodies (provider)
- Main image

- Experimental details
- NULL
- Submitted by
- Invitrogen Antibodies (provider)
- Main image

- Experimental details
- NULL
- Submitted by
- Invitrogen Antibodies (provider)
- Main image
- Experimental details
- NULL

- Submitted by
- Invitrogen Antibodies (provider)
- Main image
- Experimental details
- NULL
- Submitted by
- Invitrogen Antibodies (provider)
- Main image
- Experimental details
- NULL

- Submitted by
- Invitrogen Antibodies (provider)
- Main image

- Experimental details
- NULL
- Submitted by
- Invitrogen Antibodies (provider)
- Main image
- Experimental details
- NULL

- Submitted by
- Invitrogen Antibodies (provider)
- Main image

- Experimental details
- NULL
- Submitted by
- Invitrogen Antibodies (provider)
- Main image
- Experimental details
- NULL
- Submitted by
- Invitrogen Antibodies (provider)
- Main image
- Experimental details
- NULL

- Submitted by
- Invitrogen Antibodies (provider)
- Main image
- Experimental details
- NULL
- Submitted by
- Invitrogen Antibodies (provider)
- Main image
- Experimental details
- NULL

- Submitted by
- Invitrogen Antibodies (provider)
- Main image
- Experimental details
- NULL
- Submitted by
- Invitrogen Antibodies (provider)
- Main image

- Experimental details
- NULL
- Submitted by
- Invitrogen Antibodies (provider)
- Main image

- Experimental details
- NULL
- Submitted by
- Invitrogen Antibodies (provider)
- Main image

- Experimental details
- NULL
- Submitted by
- Invitrogen Antibodies (provider)
- Main image
- Experimental details
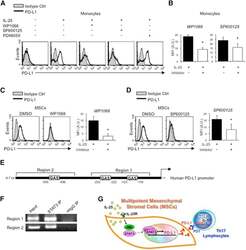
- Figure 6 IL-25-Mediated PD-L1 Expression in Human Monocytes and hMSCs Is Mediated through JNK and STAT3, with STAT3 Involved in Transcriptional Control of PD-L1 (A) Human PBLs were pretreated with inhibitors of STAT3 (WP1066; 2.5 muM), JNK (SP600125; 25 muM), or MEK1 (PD98059; 20 muM) prior to 100 ng/ml rhIL-25 for 18 hr, with subsequent flow cytometric analysis for PD-L1 surface expression on monocytes, gated using FSC and SSC. Filled histograms represent isotype control; unfilled histograms represent PD-L1 antibody staining. (B-D) Pooled data (three donors) are shown (B) with bars representing MFI. hMSCs were treated with inhibitors of STAT3 (C; WP1066, 2.5 muM) and JNK (D; SP600125, 25 muM) for 6 hr, and subsequently assessed by flow cytometric analysis for PD-L1 surface expression. Pooled data (all three donors) for each respective inhibitor are provided (left charts) with bars representing MFI. (E) Putative GAS elements (STAT-binding sites) in the proximal promoter region of human PD-L1 gene (700 bp region upstream from the transcription start site), as determined with TFSearch web-based software. (F) Binding of STAT3 or IgG (negative control) in hMSCs was analyzed by chromatin immunoprecipitation (ChIP) with promoter-specific primers for region 1 and region 2. The input samples (positive control) represent 1% starting chromatin. (G) Schematic shows a model of hMSC-mediated suppression of Th17 responses involving the IL-25/STAT3/PD-L1 axis.
- Submitted by
- Invitrogen Antibodies (provider)
- Main image
- Experimental details
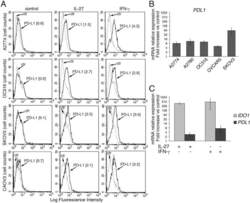
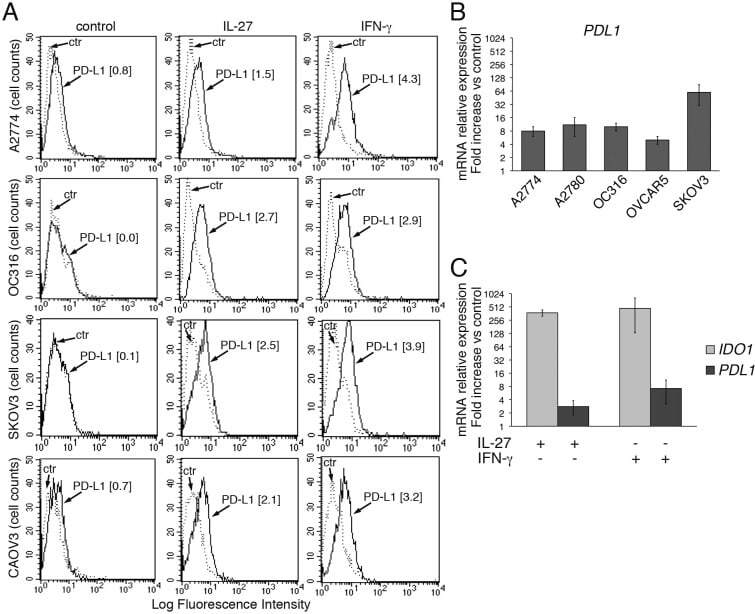
- Figure 2 IL-27 increases PD-L1 surface protein and mRNA expression in EOC cells in vitro A. FACS analysis of surface PD-L1 expression in four EOC cell lines, cultured in the presence of medium (control), IL-27 or IFN-gamma. Dotted lines are isotype-matched unrelated Ig staining controls. Numbers in brackets are Median Fluorescence Intensity (MFI) values calculated as median PD-L1 minus median Ig control. Data are representative of two independent experiments showing similar results. B. QRT-PCR analysis of PDL1 mRNA expression in five IL-27-stimulated EOC cells relative to untreated cells. Data are the mean (+-SD) of three independent experiments. C. Comparative analysis of IDO1 and PDL1 mRNA up-regulation by IL-27 or IFN-gamma in a representative EOC cell line (CAOV3). Data are the mean of two independent replicates and are expressed as DeltaDeltaCT-fold change. Error bars represent the minimum and maximum.
- Submitted by
- Invitrogen Antibodies (provider)
- Main image
- Experimental details
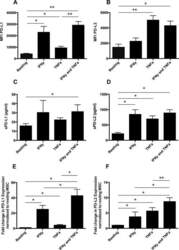
- Figure 1 Mesenchymal stromal cell (MSC) cell surface expression and secretion of PD-L1 and PD-L2 are potentiated by pro-inflammatory cytokines, IFNgamma and TNFalpha. MSCs ( n = 4) were exposed to 100 U/ml IFNgamma and 10 ng/ml TNFalpha for 3 days in culture. Cell surface expression (MFI) of (A) PD-L1 and (B) PD-L2 was assessed by flow cytometry. Secretion of (C) soluble (s)PD-L1 and (D) sPD-L2 within the conditioned media of stimulated cells was assessed by ELISA. Bar charts indicate mean +- SEM. Transcriptional regulation of (E) PD-L1 and (F) PD-L2 were assessed by qRT-PCR. mRNA data are expressed as fold change compared to unstimulated, resting MSCs +- SEM. *, p < .05; **, p < .01. Abbreviations: IFNgamma, Interferon gamma; MFI, mean fluorescence intensity; PD-L1 and PD-L2, programmed death 1 ligands 1 and 2; TNFalpha, tumor necrosis factor alpha.

- Submitted by
- Invitrogen Antibodies (provider)
- Main image
- Experimental details
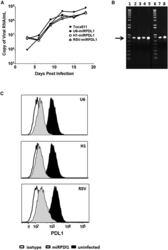
- Figure 4 RRV-RSV-miRPDL1 and RRV-H1-miRPDL1 Exhibit Comparable PDL1 Downregulation Activity as RRV-miRPDL1 (A) Replication kinetics of RRV-RSV-miRPDL1 and RRV-H1-miRPDL1. The viral genome in the supernatants of infected LN-18 cells (MOI of 0.1) at indicated time points were quantified by qRT-PCR using primer set targeted to the env region ( Figure 1 ). RRV-yCD2 and RRV-miRPDL1 (indicated as U6-miRPDL1 in the graph) were included as positive controls. (B) Vector stability of RRV-RSV-miRPDL1 and RRV-H1-miRPDL1 in LN-18 cells was analyzed by endpoint PCR at 14 and 30 days post infection. Lanes 1 and 6: DNA molecular marker (1 Kb Plus marker, Invitrogen); lanes 2, 4, and 7 are positive controls using the corresponding plasmid DNA as the templates; lane 3: RRV-H1-miRPDL1; lane 5: RRV-RSV-miRPDL1; and lane 8: RRV-miRPDL1. The arrow indicates the expected size of the PCR products. (C) LN-18 cells infected with RRV-miRPDL1 (U6), RRV-H1-miRPDL1 (H1), and RRV-RSV-miRPDL1 (RSV) were stained for PDL1 cell surface expression with PDL1 antibody and analyzed by flow cytometry.

- Submitted by
- Invitrogen Antibodies (provider)
- Main image
- Experimental details
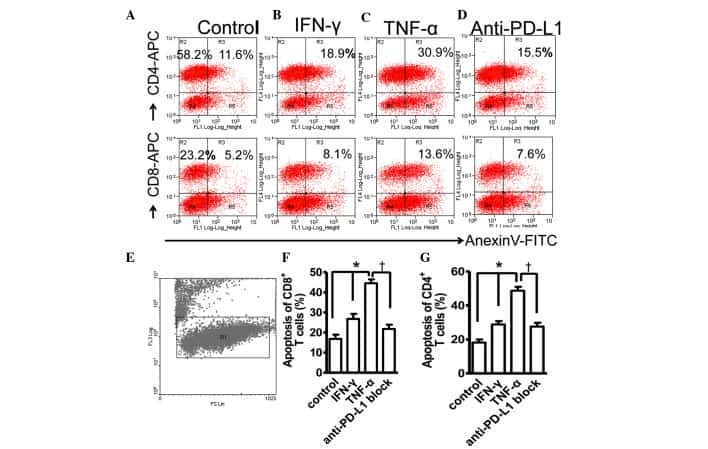
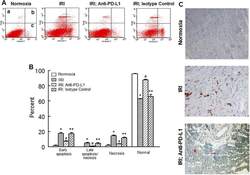
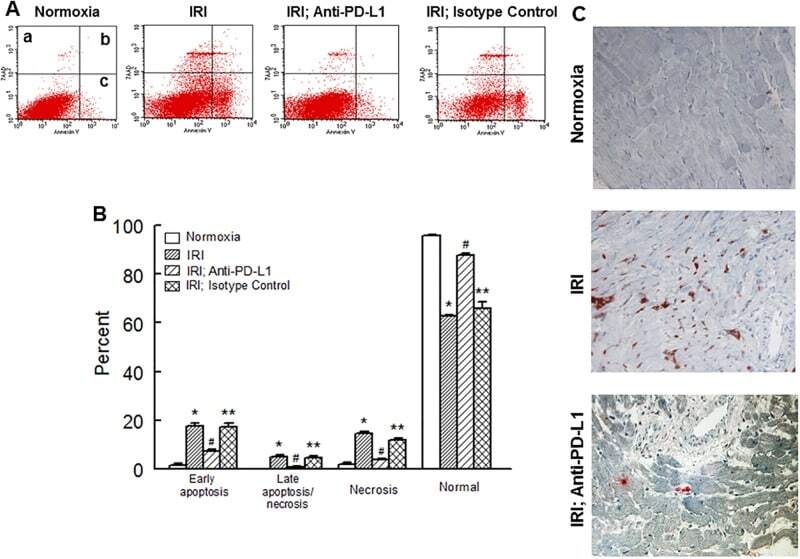
- Fig 6 Representative dot matrices for apoptotic and necrotic cell death of experimental groups are shown under panel A while bar graphs (panel B) show percent of each type of damaged/dead or normal cells for each group. Data are means +- SEM; n = 6 hearts/group for normoxic control, IRI and IRI; Anti-PD-L1 and n = 4 hearts for IRI; isotype matching control. Also shown are representative caspase 3 immunostaining for experimental groups (panel C). 400x. 7AAD: 7-Amino Actinomycin D. a: necrotic; b: apoptotic/necrotic; c: early apoptotic. IRI: Ischemia Reperfusion Injury. * p
- Submitted by
- Invitrogen Antibodies (provider)
- Main image
- Experimental details
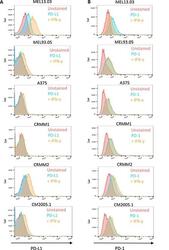
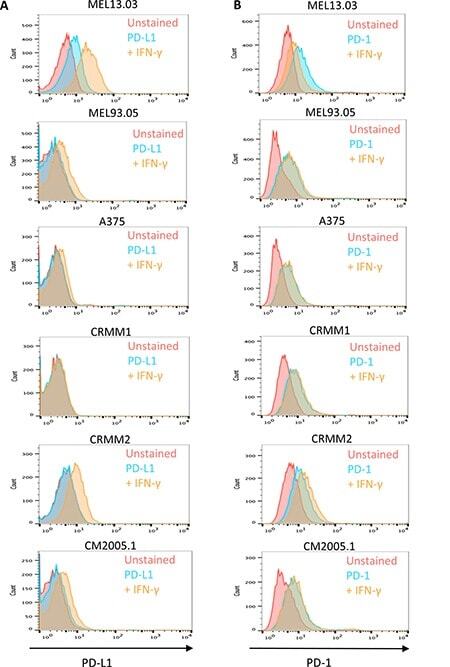
- Figure 6 Cutaneous (MEL13.03, MEL93.05 and A375) and conjunctival melanoma (CRMM1, CRMM2 and CM2005.1) cell lines express various levels of PD-L1 and PD-1 MEL13.03 is the positive control cell line for both PD-L1 and PD-1. Representative histograms show ( A ) PD-L1 and PD-1 ( B ) expression in cell lines with or without IFN-gamma (100 IU/ml) exposure for 48 h. Pink, blue and brown shaded histograms represent unstained, PD-L1 (PD-1) staining, and the effect of IFN-gamma stimulation on PD-L1 and PD-1, respectively.
- Submitted by
- Invitrogen Antibodies (provider)
- Main image

- Experimental details
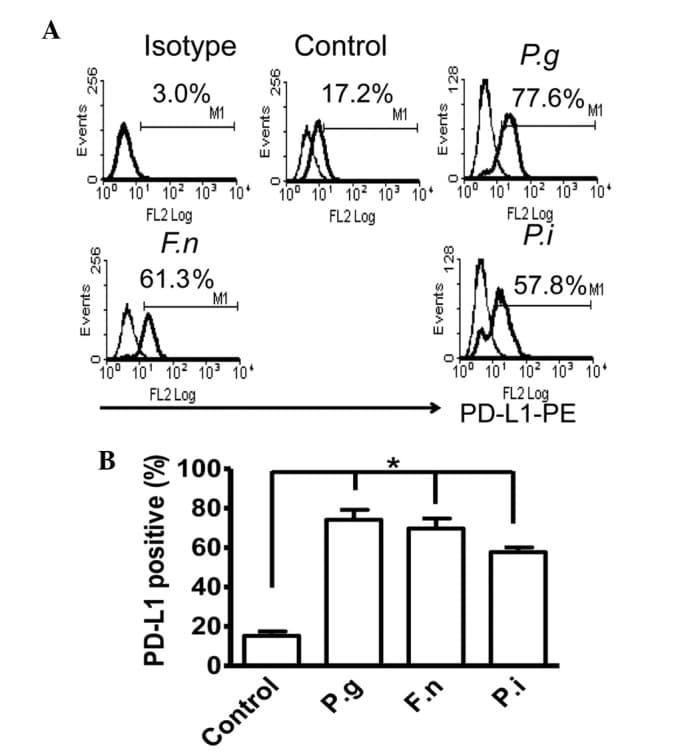
- Figure 2 Common periodontal pathogens induce the expression of PD-L1 on PDLCs. (A) Flow cytometry histogram overlays of PDLCs co-cultured with P.g , F.n and P.i . (B) Comparison of expression levels of PD-L1 induced by P.g, F.n and P.i. Data are expressed as the mean +- standard error of the mean of three independent experiments. All three strains significantly increased the expression of PD-L1 on the PDLCs, * P
- Submitted by
- Invitrogen Antibodies (provider)
- Main image
- Experimental details
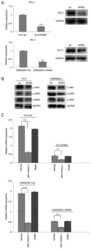
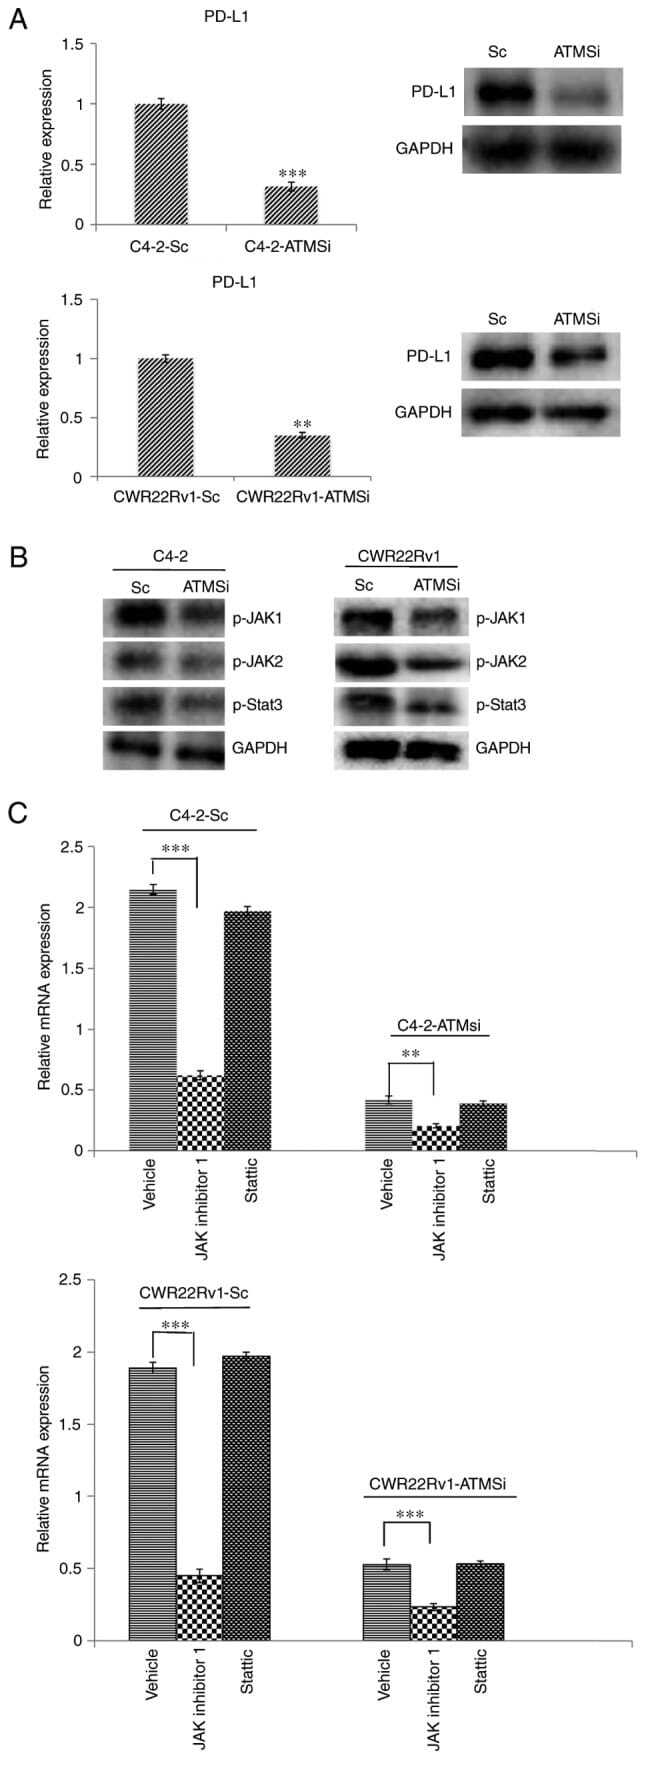
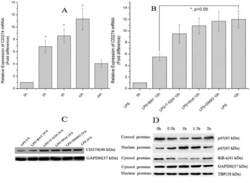
- Figure 4. Levels of PD-L1, p-JAK1, p-JAK2 and p-STAT3 are suppressed in C4-2-ATMSi and CWR22Rv1-ATMSi cells compared with in the control cells, and JAK inhibitor 1 significantly suppresses the expression of PD-L1 in ATM knockout groups and control groups. (A) A significant decrease in PD-L1 expression was revealed in experimental groups by reverse transcription-quantitative polymerase chain reaction and western blotting. (B) Decreased levels of p-JAK1, p-JAK2 and p-STAT3 were revealed in the experimental groups by western blotting. (C) JAK inhibitor 1 and Stattic were used to treat all cell groups. Downregulation of JAK significantly reduced PD-L1 expression, whereas Stattic had no significant effect on PD-L1 expression. **P
- Submitted by
- Invitrogen Antibodies (provider)
- Main image
- Experimental details
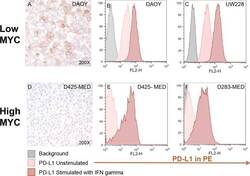
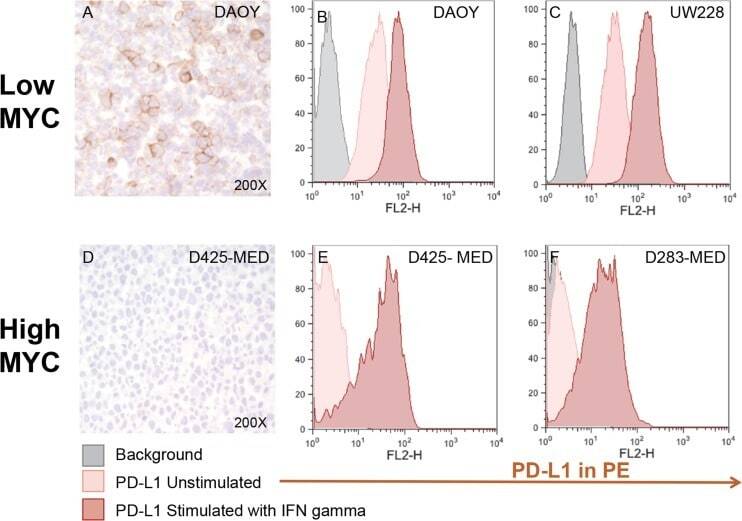
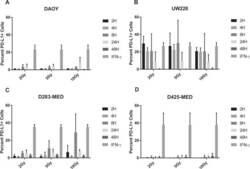
- Figure 4 Medulloblastoma cell lines express PD-L1 in a subgroup dependent manner PD-L1 expression in low and high MYC MB cell lines. Paraffin embedded cell line pellets stained for PD-L1 in DAOY ( A ) and D425-MED ( D ). Histograms of PD-L1 expression by flow cytometry using phycoerythrin (PE) conjugated MIH1 clone of PD-L1 (EBioscience) with and without IFN-gamma stimulation in DAOY ( B ), UW228 ( C ), D425-MED ( E ), and D283-MED ( F ).
- Submitted by
- Invitrogen Antibodies (provider)
- Main image
- Experimental details
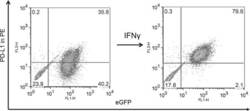
- Figure 5 MYC overexpression in DAOY (YM21) does not alter PD-L1 expression Dot Plots of PD-L1 expression by flow cytometry using PE-conjugated MIH1 clone of PD-L1 (EBioscience) in YM21 construct made by overexpressing MYC in DAOY via stable lentiviral transfection.

- Submitted by
- Invitrogen Antibodies (provider)
- Main image
- Experimental details
- Figure 6 Radiation induces PD-L1 in most medulloblastoma cell lines Bar graph depicts percent PD-L1 positive cells above baseline as determined by flow cytometry using PE-conjugated MIH1 clone of PD-L1 (EBioscience) in DAOY ( A ), UW228 ( B ), D283-MED ( C ), and D425-MED ( D ) after irradiation with 2, 5, or 10 Gy at 2, 4, 8, 24, and 48 hours. IFN-gamma values were obtained without radiation. Each bar graph depicts findings from 2 different experiments where all data points were repeated. Error bars represent standard deviation of the mean. Levels of PD-L1 that were comparable to those induced by IFN-gamma included UW228 hours 2-24 at 2, 5 and 10 Gy and D283-MED at hour 8, 10 Gy. All other values were significantly less than those induced by IFN-gamma as determined by 2-way ANOVA corrected for multiple comparisons. Full statistical analysis available in Supplementary Table 1-1-1-4 .

- Submitted by
- Invitrogen Antibodies (provider)
- Main image

- Experimental details
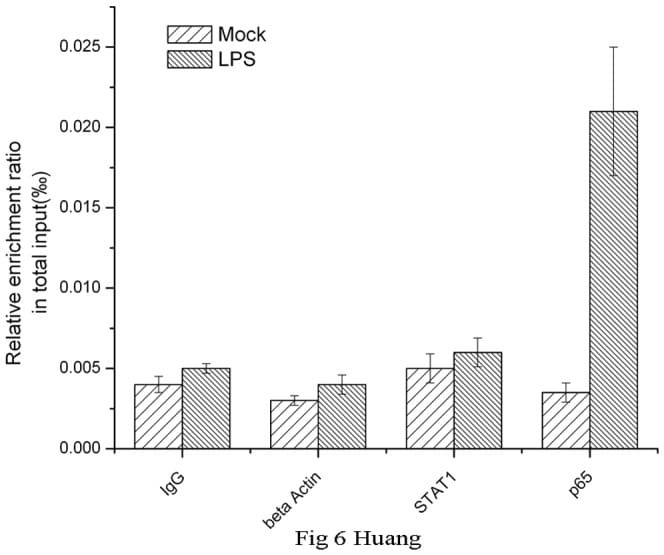
- Figure 6 Chromatin immunoprecipitation (ChIP) assays of the CD274 promoter in primary human monocytes. Cells were treated with or without LPS for 1 h. ChIP assays were carried out using an anti-p65 antibody. IgG, anti-beta-actin and anti-STAT1 antibodies were used as negative controls. Relative enrichment of each transcription factor-bound DNA was detected by qPCR using ChIP primers. All the results were normalized to input DNA.
- Submitted by
- Invitrogen Antibodies (provider)
- Main image
- Experimental details
- Figure 1 LPS treatment regulates CD274 mRNA levels mainly via the NF-kappaB signaling pathway in primary human monocytes. CD274 mRNA levels were determined by quantitative real-time PCR and are shown as fold changes in arbitrary units. (A) LPS treatment regulates CD274 mRNA levels (n = 3, repeated three times, *P

- Submitted by
- Invitrogen Antibodies (provider)
- Main image
- Experimental details
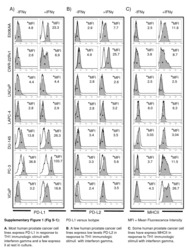
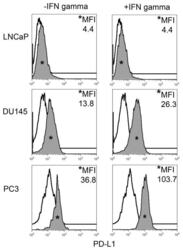
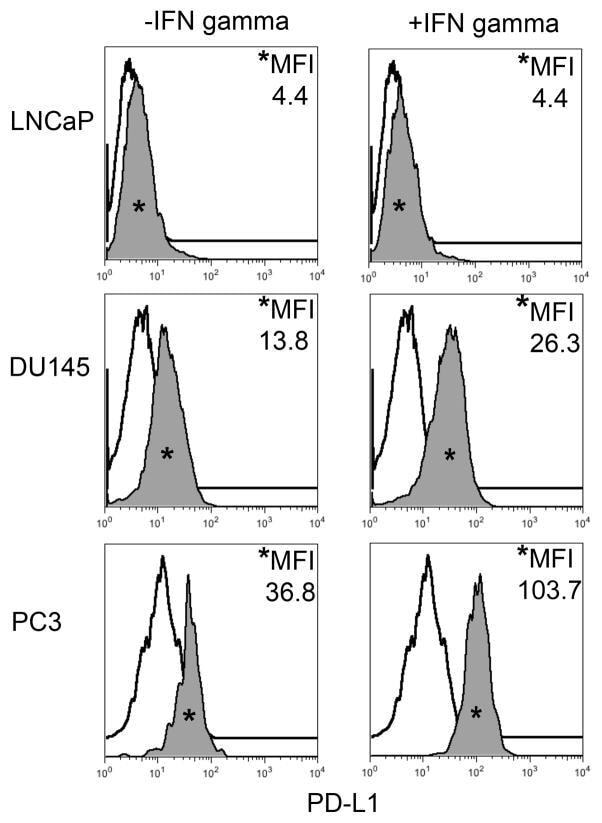
- FIGURE 1 Human Prostate Cancer Cell Lines Display Varying Expression of PD-L1 in Response to IFN-gamma Histograms representing PD-L1 surface expression as detected by flow cytometry in human prostate cancer cell lines with and without exposure to IFN-gamma. Open histograms represent cells stained with an isotype IgG1 antibody tagged with a matching PE fluorochrome. Shaded histograms represent PD-L1. Quantitative measurements reflect mean fluorescence index. LNCaP does not express PD-L1 at rest or in response to IFN-gamma. DU145 expresses PD-L1 at rest and has little response to IFN-gamma indicating an innate immune resistance phenotype. PC3 expresses PD-L1 at rest but robustly up-regulates this expression in response to IFN-gamma displaying a more classic adaptive immune resistance phenotype.
- Submitted by
- Invitrogen Antibodies (provider)
- Main image
- Experimental details
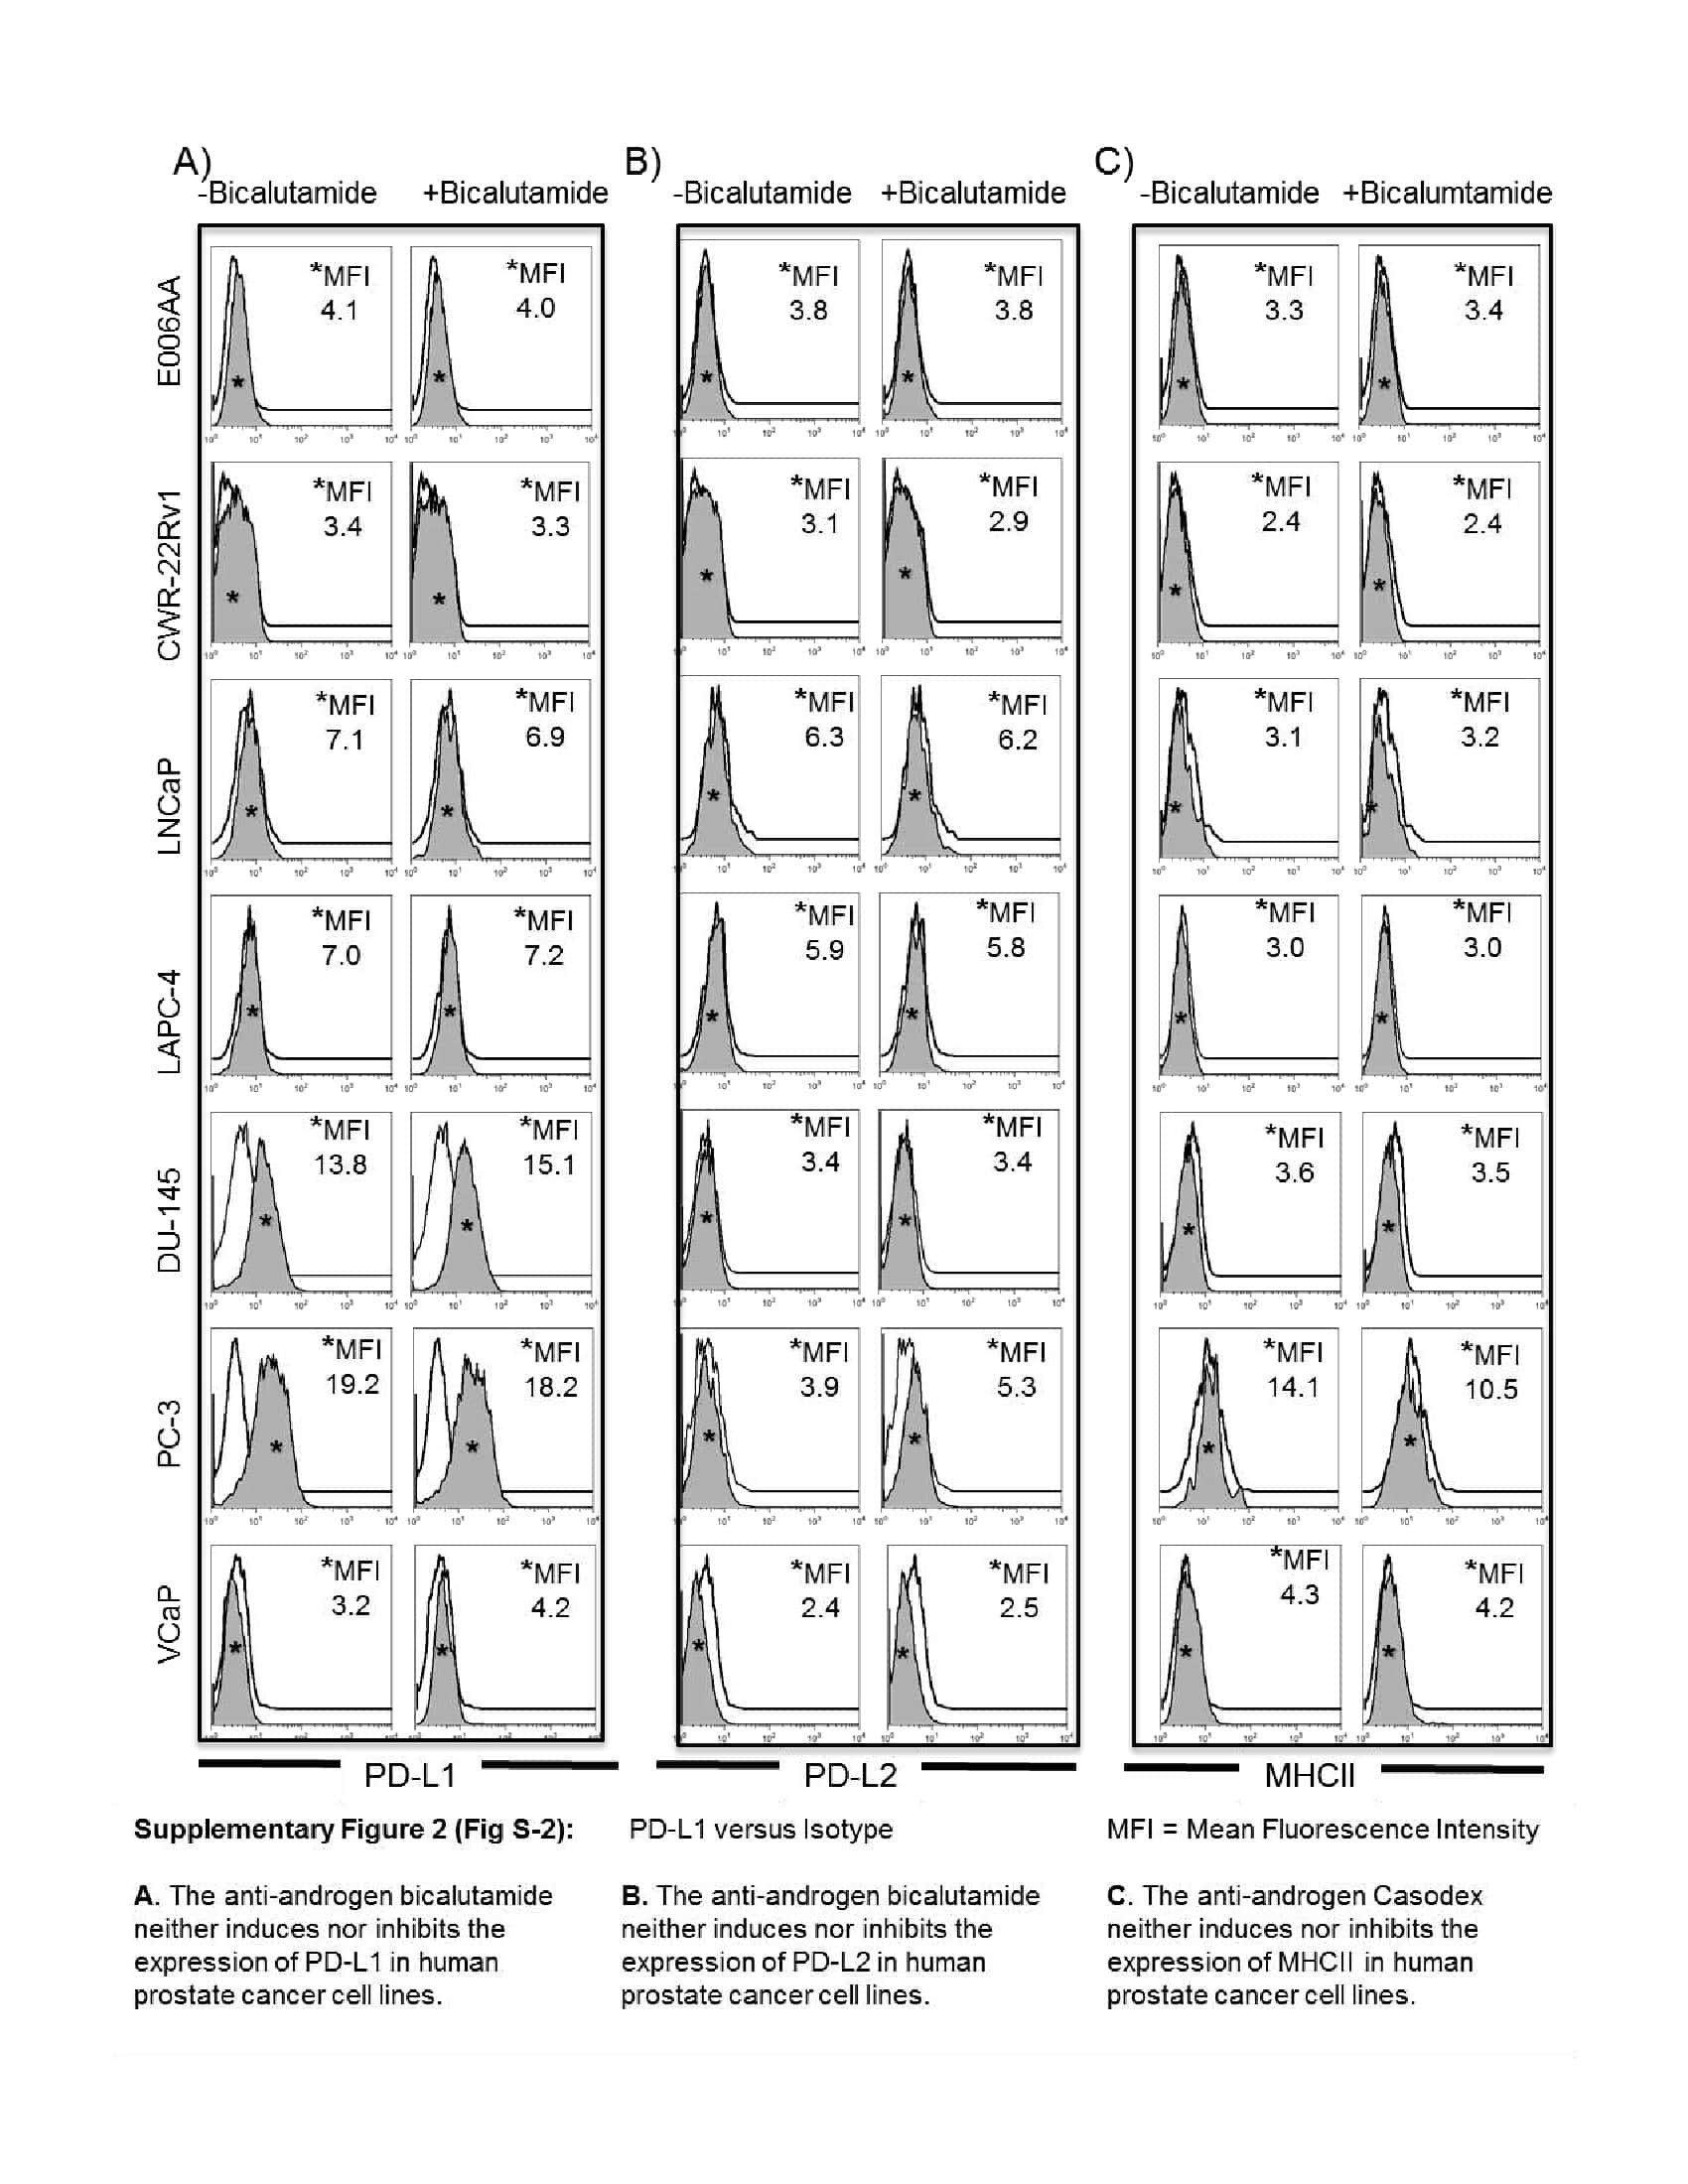
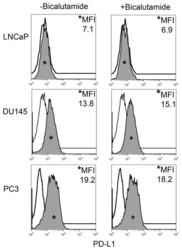
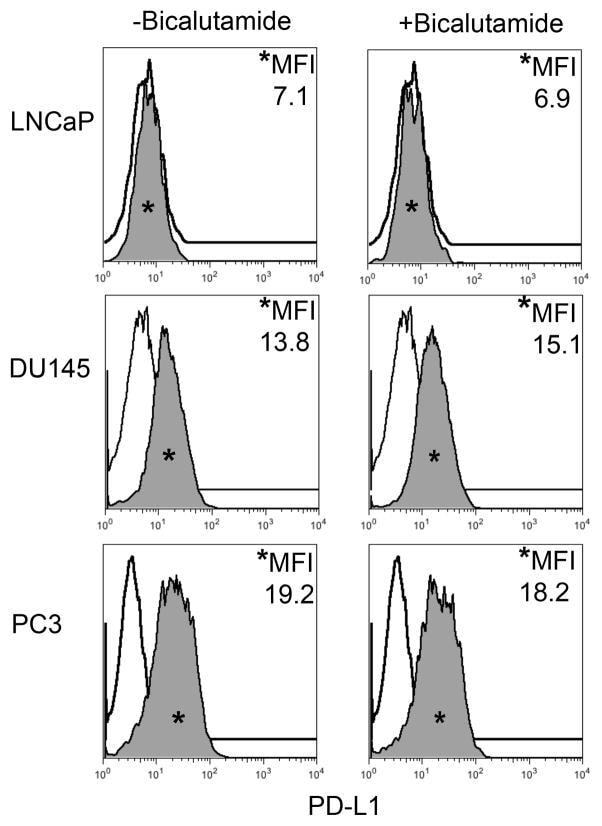
- FIGURE 2 Human Prostate Cancer Cell Lines Display No Change in PD-L1 Expression in Response to Bicalutamide Histograms representing PD-L1 surface expression as detected by flow cytometry in human prostate cancer cell lines with and without exposure to bicalutamide. Open histograms represent cells stained with an isotype IgG1 antibody tagged with a matching PE fluorochrome. Shaded histograms represent PD-L1. Quantitative measurements reflect mean fluorescence index. LNCaP, DU145, and PC3 displayed no changes in PD-L1 expression upon exposure to bicalutamide.
- Submitted by
- Invitrogen Antibodies (provider)
- Main image
- Experimental details
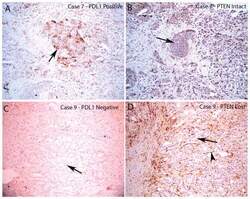
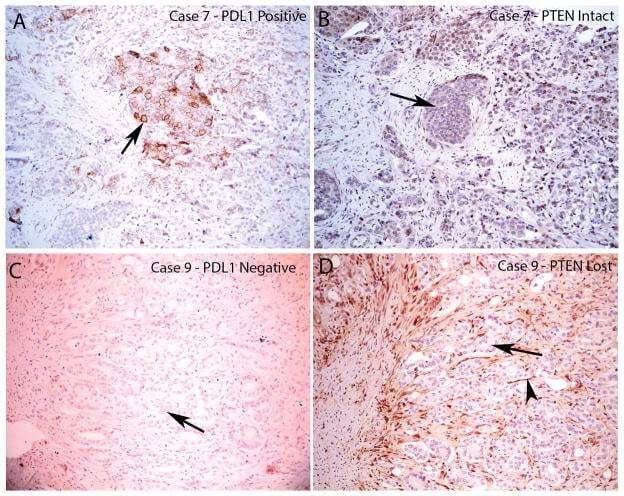
- FIGURE 4 Loss of PTEN Does Not Correlate with PD-L1 Expression in Resected Primary Prostate Carcinomas PD-L1 and PTEN staining in tumor lesions from two different patients. A. Case number 8 showing focally positive PD-L1 area. Arrow indicates positive tumor cell staining which is predominantly on the plasma membrane. B, similar region from adjacent section of case number 8 showing intact PTEN staining in all tumor cells (arrow shows a group of tumor cells with intact PTEN staining). C, case number 9 showing negative staining for PDL1 in all tumor cells (arrow shows tumor cells without PD-L1 staining). D, adjacent region showing PTEN loss in nearly all of the tumor cells (arrow shows tumor cells with negative PTEN staining; arrowhead shows stromal element with strongly positive PTEN staining). All images taken at 100 X original magnification.
- Submitted by
- Invitrogen Antibodies (provider)
- Main image

- Experimental details
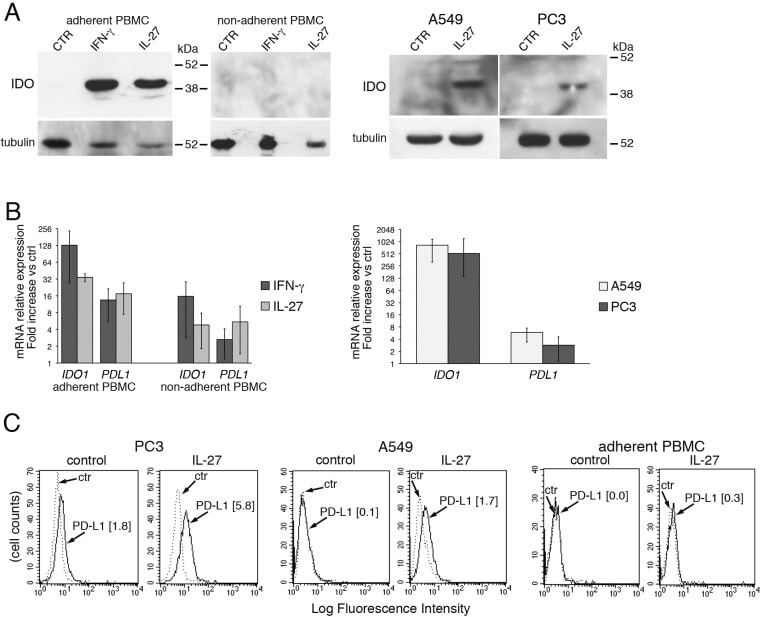
- Figure 7 IL-27 induces PD-L1 and/or IDO expression in human PC3 prostate and A549 lung cancer cells and adherent PBMC A. Western blot analysis of IDO expression in human adherent PBMC, non-adherent PBMC and in PC3 and A549 cells treated with the indicated cytokines or medium only for 48 hours. alpha-tubulin is used as loading control. Similar results were observed in two additional experiments. B. QRT-PCR analysis of IDO1 and PDL1 mRNA expression in cytokine-stimulated adherent or non-adherent PBMC, PC3 and A549 cells relative to untreated cells. Data are expressed as DeltaDeltaCT-fold change. Mean values of three independent experiments. Error bars represent SD. C. FACS analysis of surface PD-L1 in IL-27-treated or untreated PC3 and A549 cell lines and adherent PBMC. Dotted lines are isotype-matched unrelated Ig staining controls. Similar results were obtained in five different experiments (PC3: MFI 5.5 +- 2.7 vs 1.5 +- 0.6, mean +- SD in IL-27-treated vs un-stimulated cells, P = 0.03 by paired Student's t test; A549: MFI 2 +- 1 vs 0.43 +- 0.4, P = 0.01).
- Submitted by
- Invitrogen Antibodies (provider)
- Main image
- Experimental details
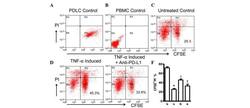
- Figure 4 Expression of PD-L1 on PDLCs improves survival of PDLCs. Flow cytometry histrograms of (A) PDLCs, (B) PHA-activated PBMCs, (C) PDLCs co-cultured with activated PBMCs, (D) PDLCs pretreated with TNF-alpha and co-cultured with activated PBMCs, and (E) PDLCs pretreated with TNF-alpha, and incubated with activated PBMCs and anti-PD-L1 antibodies. (F) Comparison of PDLC survival, according to the percentages of CFSE + /PI - cells. a, c, d and e represent the PDLC control, untreated control, TNF-alpha induced and TNF-alpha induced+anti-PD-L1 groups, respectively. Data are expressed as the mean +- standard error of the mean of three independent experiments. Co-culturing the activated PMBCs with untreated PDLCs resulted in a significant decrease in viable PDLCs ( * P

- Submitted by
- Invitrogen Antibodies (provider)
- Main image
- Experimental details
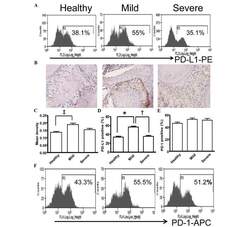
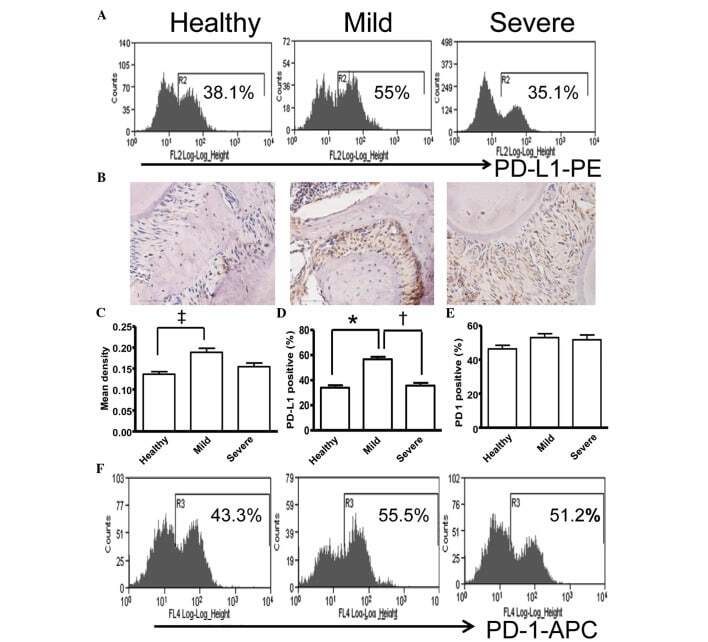
- Figure 5 Expression of PD-L1 is correlated with the severity of periodontitis in the experimental periodontitis model. (A) Flow cytometry histograms of the expression of PD-L1 on the surface of periodontal tissue cells from healthy mice, and mice with mild periodontitis and severe periodontitis. (B) Expression of PD-L1 in periodontal tissues from the three groups, detected by immunohistochemical staining (magnification, x400). (C) Comparison of the expression of PDL-1 in periodontal tissues between the three groups ( ++ P
- Submitted by
- Invitrogen Antibodies (provider)
- Main image
- Experimental details
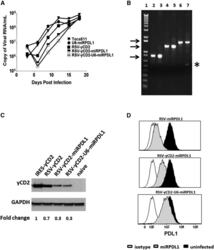
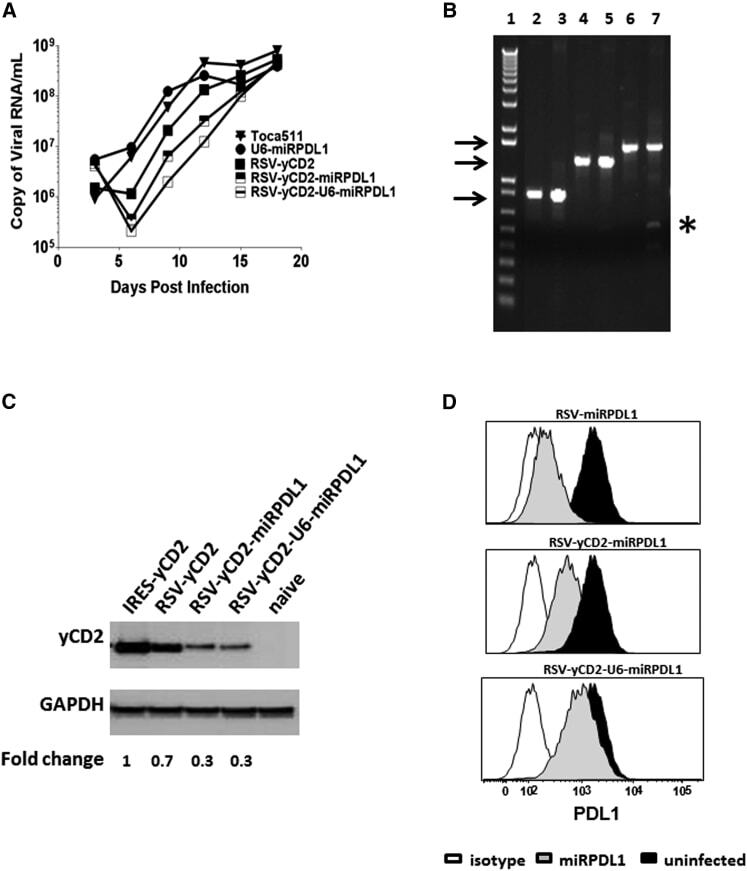
- Figure 5 RRV-RSV-yCD2-miRPDL1 and RRV-RSV-yCD2-U6-miRPDL1 Express yCD2 Protein and Exhibit PDL1 Downregulation Activity (A) Replication kinetics of RRV-RSV-yCD2-miRPDL1 and RRV-RSV-yCD2-U6-miRPDL1. The viral genome in the supernatants of infected LN-18 cells (MOI of 0.1) at indicated time points were quantified by qRT-PCR using primer set targeted to the env region ( Figure 1 ). A paired t test was performed and showed no statistically significant difference in replication kinetics between RRV-RSV-yCD2-miRPDL1 versus RRV-RSV-yCD2 (p = 0.0649) and RRV-RSV-yCD2-U6-miRPDL1 (p = 0.0801). RRV-yCD2, RRV-RSV-yCD2, and RRV-miRPDL1 (indicated as U6-miRPDL1 in the graph) were included as positive controls. (B) Vector stability of RRV-RSV-yCD2-miRPDL1 and RRV-RSV-yCD2-U6-miRPDL1 in LN-18 cells was analyzed by endpoint PCR at 14 days post infection. Lane 1: DNA molecular marker (1 Kb Plus marker, Invitrogen); lanes 2, 4, and 6 are positive controls using the corresponding plasmid DNA as the templates; lane 3: RRV-RSV-miRPDL1; lane 5: RRV-RSV-yCD2-miRPDL1; and lane 7: RRV-RSV-yCD2-U6-miRPDL1. The arrows indicate the expected size of the PCR products (844 bp for RRV-RSV-miRPDL1; 1,326 bp for RRV-RSV-yCD2-miRPDL1; and 1,591 bp for RRV-RSV-yCD2-U6-miRPDL1). (C) yCD2 protein expression in LN-18 cell infected with RRV-yCD2, RRV-RSV-yCD2, RRV-RSV-yCD2-miRPDL1, RRV-RSV-yCD2-U6-miRPDL1, and naive cells. GAPDH is included as loading control. The numbers shown on the bottom of the immunoblot indica
- Submitted by
- Invitrogen Antibodies (provider)
- Main image
- Experimental details
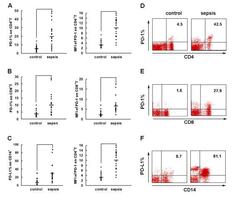
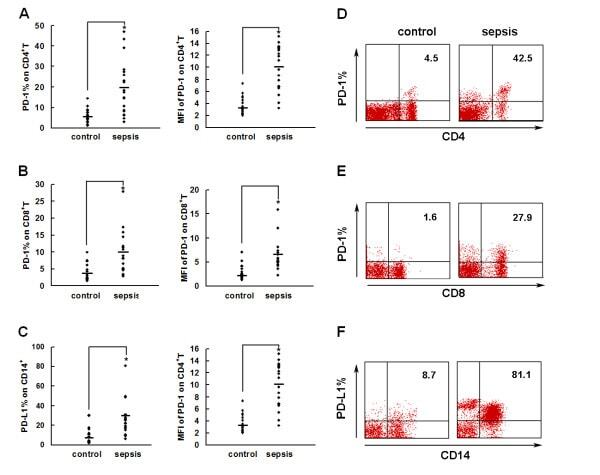
- Figure 2 PD-1 and PD-L1 were upregulated on T cells and monocytes in septic shock patients . Blood samples were obtained from 19 septic shock patients and 22 healthy controls and were stained for programmed death-1 (PD-1) and programmed death ligand-1 (PD-L1) gated on CD4 + T cells, CD8 + T cells, and CD14 + monocytes. (a) to (c) Percentage of PD-1 expression on (a) CD4 + T cells and (b) CD8 + T cells, and (c) percentage of PD-L1 expression on CD14 + monocytes. Each dot represents one individual. Data are mean +- standard error of the mean (SEM) of three independent experiments. ** P < 0.01 compared with healthy controls. (d) to (f) Mean fluorescence intensity (relative fluorescence units) of PD-1 expression on (d) CD4 + T cells, (e) PD-1 expression on CD8 + T cells, and (f) PD-L1 expression on CD14 + monocytes Each dot represents one individual. Data are mean +- SEM of three independent experiments. * P < 0.05 compared with healthy controls. (g) Representative PD-1 expression levels on CD4 + T cells and CD8 + T cells, and PD-L1 expression on CD14 + monocytes. Values in the upper-right quadrant indicate the percentage of cells that express PD-1 or PD-L1.
- Submitted by
- Invitrogen Antibodies (provider)
- Main image

- Experimental details
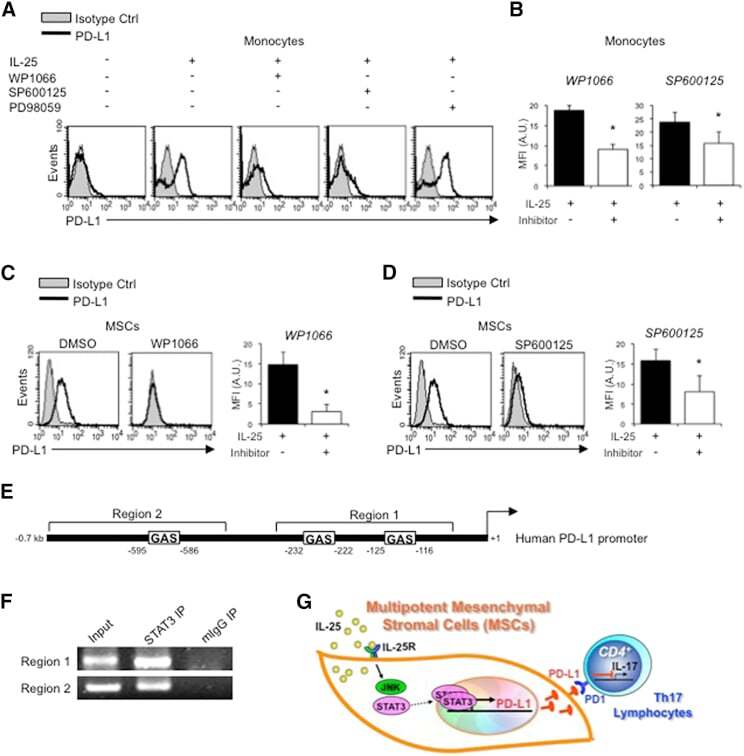
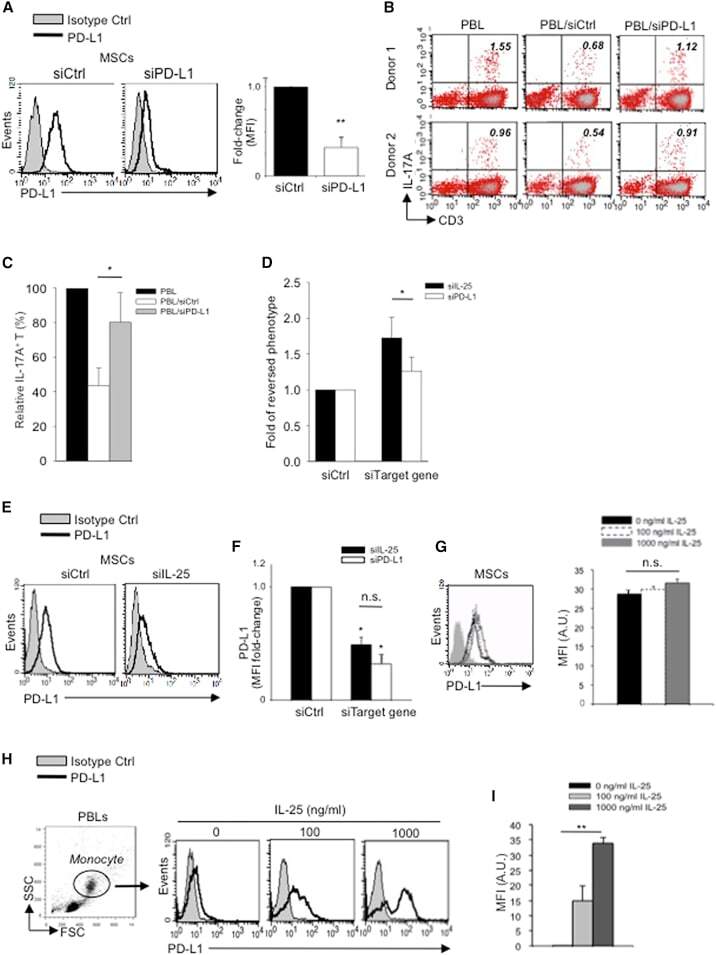
- Figure 5 IL-25 Induces PD-L1 Surface Expression on hMSCs and Human Monocytes (A) PD-L1 in siCtrl MSCs (left) and siPD-L1 MSCs (right) was analyzed by surface staining. (B) Freshly isolated human PBLs were co-cultured without (left) or with siCtrl MSCs (middle) or siPD-L1 MSCs (right) for 3 days, followed by PMA/ionomycin stimulation for 6 hr. IL-17A production in CD3 + T cells was assessed by intracellular staining. Representative data are shown with numbers in the top right quadrants representing the percentages of IL-17A-producing CD3 + T cells. (C) Pooled data from PBLs (n = 4) and two hMSC donors (donors A and B) are shown. (D) Folds of reversed phenotypes of siIL-25 and siPD-L1 are shown. (E) PD-L1 expression on siCtrl hMSCs (left) and siIL-25 hMSCs (right) was assessed by cell surface staining. Filled histograms represent isotype control; unfilled histograms represent PD-L1 antibody staining. (F) Pooled data of PD-L1 expression (indicated by fold change in MFI) on siIL-25 hMSCs and siPD-L1 hMSCs (all three donors) are shown. PD-L1 expression levels were compared between hMSCs silenced for the target gene (IL-25 or PD-L1) and the respective siCtrl. (G) hMSCs were treated with the indicated doses of rhIL-25 for 18 hr and assessed for cell surface PD-L1 expression by cell surface staining. Pooled data (all three donors) are shown in chart to the right with bars representing MFI. (H) Human PBLs were treated with the indicated doses of rhIL-25 for 18 hr and assessed for cell
- Submitted by
- Invitrogen Antibodies (provider)
- Main image
- Experimental details
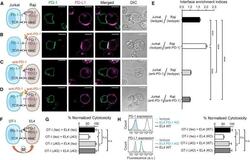
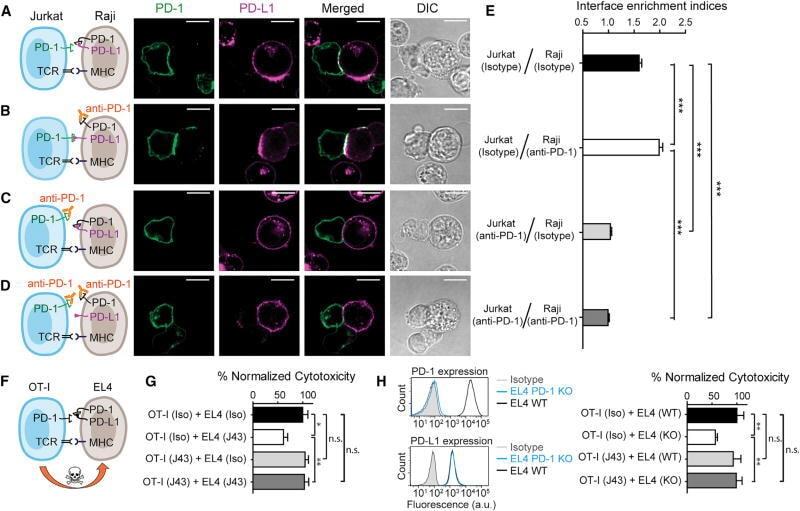
- Figure 7 Blockade of APC-Intrinsic PD-1 Enhances the Synaptic Enrichment of T Cell-Intrinsic PD-1 and Inhibits T Cell-Mediated Cytotoxicity (A) Left: cartoon showing a Jurkat cell expressing PD-1-mGFP (shown as PD-1 in green) conjugated with a Raji cell co-transduced with PD-L1-mCherry and unlabeled PD-1. Right: representative confocal images of the conjugate at the indicated channel acquired 2 min after cell-cell contact. Scale bars, 10 um. (B-D) Same as (A), except that Raji (PD-L1+/PD-1+) cells (B), Jurkat (PD-1-mGFP) cells (C), or both (D) were preincubated with pembrolizumab and washed extensively prior to conjugation. Scale bars, 10 um. (E) Bar graph comparing the interface enrichment indices (calculated as described in STAR Methods) of the four conditions shown in (A)-(D). Data are expressed as mean +- SEM; n = 40 cells from three independent experiments. (F) Cartoon illustrating the cytotoxicity assay, in which EL4 cells were used as the target for OT-I cytotoxic T cells. (G) Bar graph summarizing the OT-I cytotoxicity under indicated conditions, with PD-1 blockade antibody J43 or isotype antibody (Iso) preincubated with neither cell, only EL4, only OT-I, or both cell types. See STAR Methods for details. Cytotoxicity was normalized to the no blockade antibody condition (i.e., EL4 and OT-I preincubated with the isotype control). n.s., not significantly different. Data are presented as mean +- SEM from three independent replicates. (H) Left: FACS histograms showing PD-1
- Submitted by
- Invitrogen Antibodies (provider)
- Main image
- Experimental details
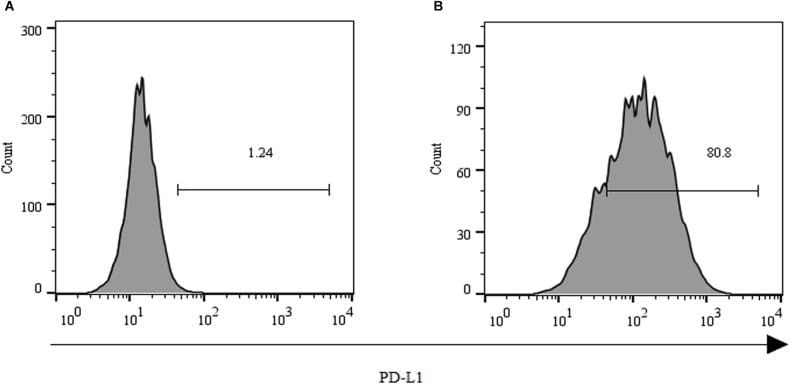
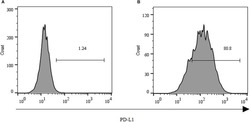
- FIGURE 2 Expression of PD-L1 on human HCC PLC/PRF/5 cells. (A) Human HCC PLC/PRF/5 cells were cultured alone in the absence of GPC3-CAR T cells in RPMI 1640 medium containing 10% FBS. (B) Human HCC PLC/PRF/5 cells were cocultured with GPC3-CAR T cells at an effector:Target ratio of 1:1 for 18 h in RPMI 1640 medium containing 10% FBS. PD-L1 was determined by flow cytometry in the CD3-negative gate, and the fixable, viable stain 780 was used for discriminating live from dead cells.