Explore
 Validate
 Learn
Learn Western blot
Antibody data
- Antibody Data
- Antigen structure
- References [4]
- Comments [0]
- Validations
- Western blot [1]
- Immunocytochemistry [1]
- Other assay [10]
Submit
Validation data
Reference
Comment
Report error
- Product number
- PA5-37763 - Provider product page

- Provider
- Invitrogen Antibodies
- Product name
- Phospho-Ezrin (Thr567) Polyclonal Antibody
- Antibody type
- Polyclonal
- Antigen
- Synthetic peptide
- Description
- A suggested positive control for Western blot is MDA cells.
- Reactivity
- Human, Mouse, Rat
- Host
- Rabbit
- Isotype
- IgG
- Vial size
- 100 µL
- Concentration
- 1 mg/mL
- Storage
- -20°C
Submitted references Inflammatory Immune Cytokine TNF-α Modulates Ezrin Protein Activation via FAK/RhoA Signaling Pathway in PMVECs Hyperpermeability.
High glucose induces Nox4 expression and podocyte apoptosis through the Smad3/ezrin/PKA pathway.
βA3/A1-crystallin regulates apical polarity and EGFR endocytosis in retinal pigmented epithelial cells.
Ezrin Expression is Increased During Disease Progression in a Tauopathy Mouse Model and Alzheimer's Disease.
Zhou Q, Jiang J, Chen G, Qian C, Sun G
Frontiers in pharmacology 2021;12:676817
Frontiers in pharmacology 2021;12:676817
High glucose induces Nox4 expression and podocyte apoptosis through the Smad3/ezrin/PKA pathway.
Guo W, Gao H, Pan W, Yu P, Che G
Biology open 2021 May 15;10(5)
Biology open 2021 May 15;10(5)
βA3/A1-crystallin regulates apical polarity and EGFR endocytosis in retinal pigmented epithelial cells.
Shang P, Stepicheva N, Teel K, McCauley A, Fitting CS, Hose S, Grebe R, Yazdankhah M, Ghosh S, Liu H, Strizhakova A, Weiss J, Bhutto IA, Lutty GA, Jayagopal A, Qian J, Sahel JA, Samuel Zigler J Jr, Handa JT, Sergeev Y, Rajala RVS, Watkins S, Sinha D
Communications biology 2021 Jul 8;4(1):850
Communications biology 2021 Jul 8;4(1):850
Ezrin Expression is Increased During Disease Progression in a Tauopathy Mouse Model and Alzheimer's Disease.
Vega IE, Umstead A, Wygant CM, Beck JS, Counts SE
Current Alzheimer research 2018;15(12):1086-1095
Current Alzheimer research 2018;15(12):1086-1095
No comments: Submit comment
Supportive validation
- Submitted by
- Invitrogen Antibodies (provider)
- Main image
- Experimental details
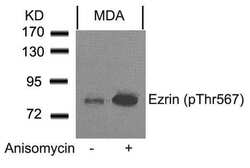
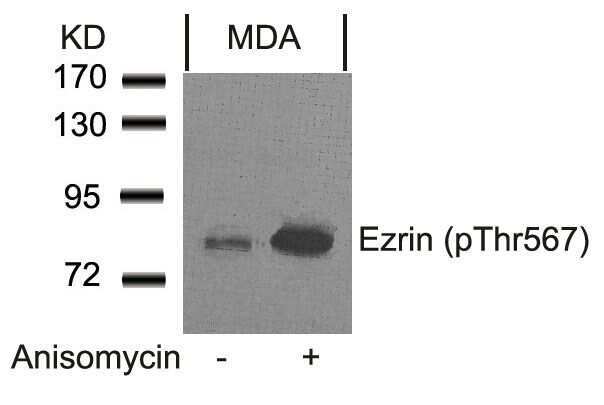
- Western blot analysis of extracts from MDA cells, untreated or treated with Anisomycin, using Ezrin (pThr567) polyclonal antibody (Product # PA5-37763).
Supportive validation
- Submitted by
- Invitrogen Antibodies (provider)
- Main image
- Experimental details
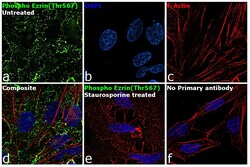
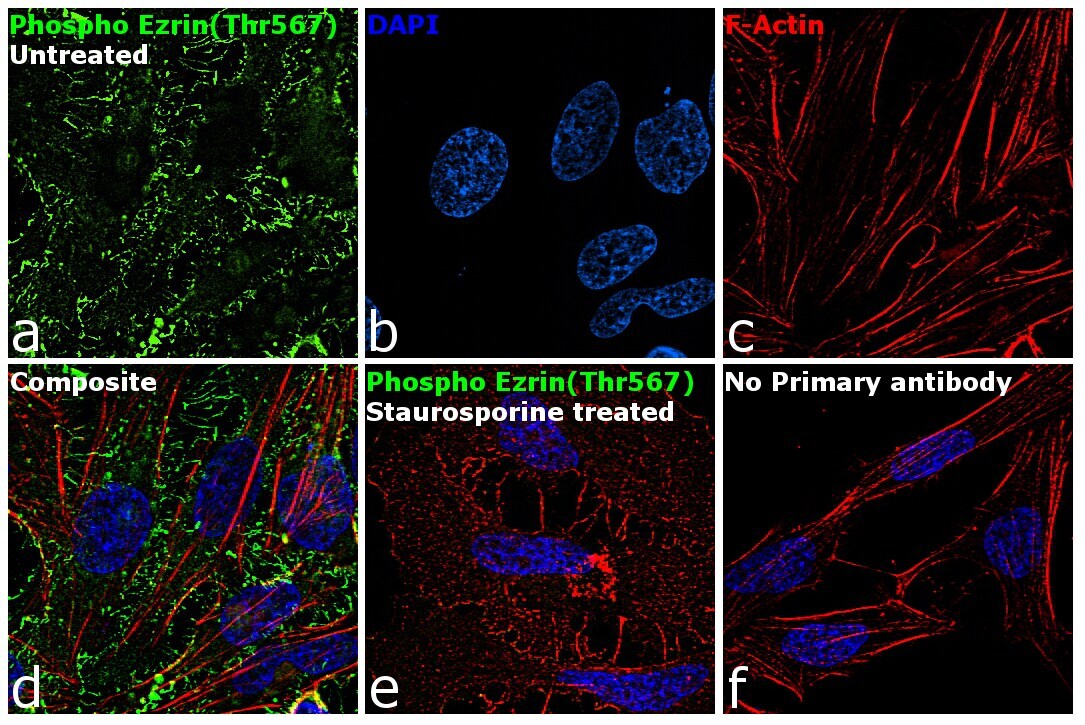
- Immunofluorescence analysis of Phospho-Ezrin (Thr567) was performed using 70% confluent log phase HeLa cells and HeLa cells treated with 1uM of Staurosporine for 1 hr. The cells were fixed with 4% paraformaldehyde for 10 minutes, permeabilized with 0.1% Triton™ X-100 for 15 minutes, and blocked with 1% BSA for 1 hour at room temperature. The cells were labeled with Phospho-Ezrin (Thr567) Rabbit Polyclonal Antibody (Product # PA5-37763) at 5 microgram/mL in 0.1% BSA, incubated at 4 degree Celsius overnight and then labeled with Goat anti-Rabbit IgG (H+L) Superclonal™ Secondary Antibody, Alexa Fluor® 488 conjugate (Product # A27034) at a dilution of 1:2000 for 45 minutes at room temperature (Panel a: green). Nuclei (Panel b: blue) were stained with ProLong™ Diamond Antifade Mountant with DAPI (Product # P36962). F-actin (Panel c: red) was stained with Rhodamine Phalloidin (Product # R415, 1:300). Panel d represents the merged image of untreated cells showing membrane localization. Panel e shows Staurosporine treated cells with no signal. Panel f represents control cells with no primary antibody to assess background. The images were captured at 60X magnification.
Supportive validation
- Submitted by
- Invitrogen Antibodies (provider)
- Main image
- Experimental details
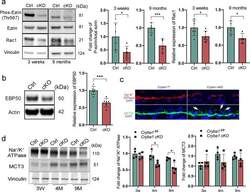
- Fig. 2 Disrupted apical-basal polarity in RPE cells lacking Cryba1 . a Western blot analysis of 3-week and 9-month-old RPE extracts showing that ezrin phosphorylation and Rac1 expression were reduced in cKO RPE cells at both ages. b Western blot analysis of 4-month-old RPE extracts confirmed downregulation of EBP50 protein in cKO RPE cells. c Immunostaining for Na + /K + ATPase and MCT3 on sections of 9-month-old retina showed reduced Na + /K + ATPase and mis-located MCT3 in Cryba1 cKO RPE cells (indicated by arrows). Scale bar: 20 mum. d Western blot analysis of RPE extracts from control and cKO mice at different ages showed reduced Na + /K + ATPase; however, there was no significant change in MCT3 abundance in cKO RPE. Statistical analysis was performed using either a two-tailed unpaired Student's t -test ( a , b ) or two-way ANOVA ( d ). * P < 0.05, *** P < 0.001, n = 4~6.

- Submitted by
- Invitrogen Antibodies (provider)
- Main image
- Experimental details
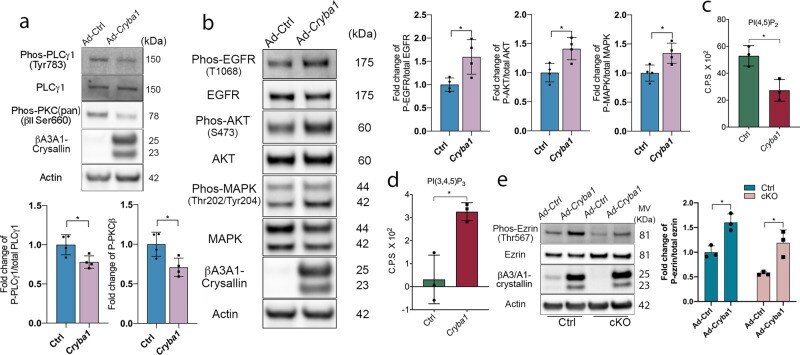
- Fig. 7 betaA3/A1-crystallin attenuates PLCgamma signaling and activates ezrin phosphorylation and the EGFR signaling network. a RPE flatmounts from 2-month-old Cryba1 cKO mice were cultured and infected with either Ad-RFP-m Cryba1 or Ad-CMV-RFP control viral vector. Western blot analysis was performed on lysates to detect PLCgamma1 and PKC activity. Graphs show reduced PLCgamma1 and PKC phosphorylation in Cryba1 cKO RPE cells overexpressing Cryba1 . n = 4. b RPE flatmounts from 5-month-old Cryba1 cKO mice were cultured and infected with either Ad-RFP-m Cryba1 or Ad-CMV-RFP control viral vectors. Flatmounts were stimulated with 50 ng/mL EGF for 60 min after serum starvation. Cells were then lysed and western blot analysis was performed on the lysates to detect EGFR phosphorylation and its downstream signaling molecules. Upregulated phosphorylation of EGFR, AKT1, and MAPK was observed in Cryba1 cKO RPE cells overexpressing Cryba1 . n = 4. c , d RPE flatmounts from 2-month-old Cryba1 cKO mice were cultured and infected with either Ad-RFP-m Cryba1 or Ad-CMV-RFP control viral vector. PI(4,5)P 2 ( c ) and PI(3,4,5)P 3 ( d ) levels were analyzed. n = 3. Data showed increased PI(3,4,5)P 3 but decreased PI(4,5)P 2 . e RPE flatmounts from 2-month-old Cryba1 cKO mice and control mice were cultured and infected with either Ad-RFP-m Cryba1 or Ad-CMV-RFP control viral vector. Western blot analysis was performed on lysates to detect ezrin phosphorylation. Graph shows increased phosphorylati
- Submitted by
- Invitrogen Antibodies (provider)
- Main image
- Experimental details
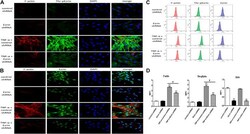
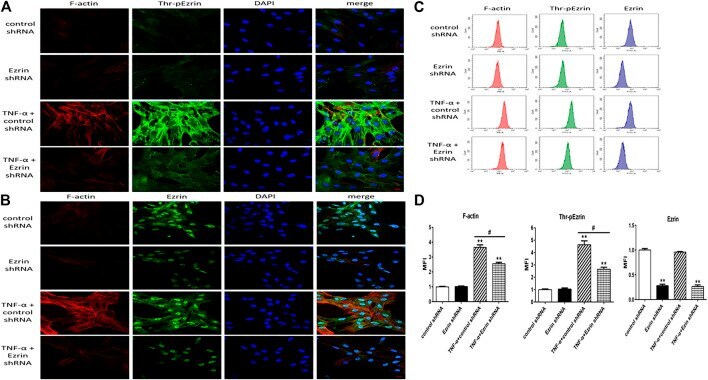
- FIGURE 1 Effect of Ezrin shRNA on the rearrangement of F-actin and the distribution of threonine phosphorylated Ezrin/Ezrin protein (Thr-pEzrin/Ezrin). (A) For each panel, the images from left to right showed rhodamine fluorescence (red), Alexa Fluor 488 fluorescence (green), cell nuclei stained with DAPI (blue), and overlays of the three images. In control shRNA cells, few stress fibers were observed in the cytoplasm and phosphorylated Ezrin protein was primarily located in the cytoplasm. Ezrin shRNA showed a phenomenon similar to control one. Control shRNA cells exposure to 20 ng/ml TNF-alpha for 2 h induced F-actin recombination and gather of phosphorylated Ezrin protein to cell periphery. Downregulation of Ezrin protein weakened the F-actin band and induced a decrease of phosphorylated Ezrin protein locating to cell periphery. (B) The distribution of Ezrin protein was not altered by TNF-alpha while F-actin had a similar trend to (A) . Scale bar, 20 mum. (C) The fluorescence intensity of F-actin, phosphorylated Ezrin protein and Ezrin protein was detected via flow cytometry. (D) The mean fluorescence intensity (MFI) from flow cytometry. For each condition, the experiment was repeated three times, all of which had similar observations. Data was presented as mean +- SD. n = 3, ** p < 0.01 vs. control group. # p < 0.05 between TNF-alpha + control shRNA and TNF-alpha + Ezrin shRNA groups.
- Submitted by
- Invitrogen Antibodies (provider)
- Main image
- Experimental details
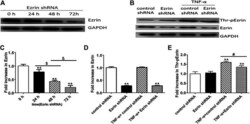
- FIGURE 2 Effect of Ezrin shRNA on the expression level of Thr-pEzrin in TNF-alpha-induced PMVECs. (A) Ezrin shRNA downregulated the expression level of Ezrin protein. (B) Ezrin protein was not sensitive to TNF-alpha (20 ng/ml, 2 h) stimulation. Ezrin shRNA alleviate the increase of Thr-pEzrin induced by TNF-alpha. (C-E) Relative expression levels from the Western blotting. Data were presented as mean +- SD. n = 3, ** p < 0.01 vs. control group. $ p < 0.05 between 24 h and 48 h groups. & p < 0.05 between 48 h and 72 h groups, # p < 0.05 between TNF-alpha + control shRNA and TNF-alpha + Ezrin shRNA groups.

- Submitted by
- Invitrogen Antibodies (provider)
- Main image
- Experimental details
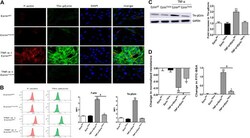
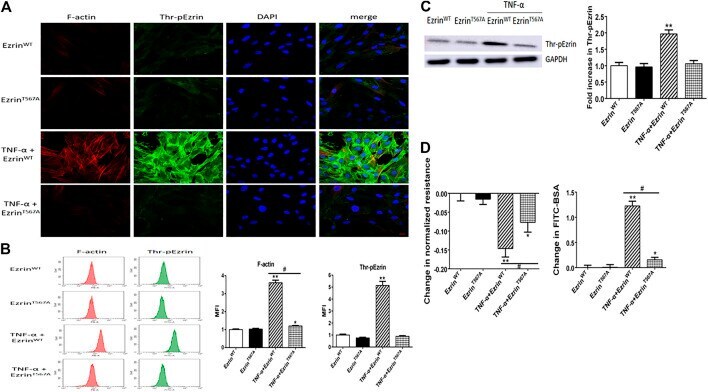
- FIGURE 4 Effect of phosphorylation mutant of Ezrin protein (Ezrin T567A ) on endothelial responses in TNF-alpha-induced PMVECs. (A) Ezrin T567A can reverse the localization of Thr-pEzrin and reduce the recombination of F-actin induced by TNF-alpha. Scale bar, 20 mum. (B) The MFI of F-actin, Thr-pEzrin was calculated via flow cytometry. (C) Effect of Ezrin T567A on the Thr-pEzrin expression level induced by TNF-alpha. (D) Ezrin T567A relieved the decline of TER and increased the fluxes of FITC-BSA induced by TNF-alpha. For each condition, the experiment was repeated three times, all of which had similar observations. Data were presented as mean +- SD. n = 3, * p < 0.05 vs. control group. ** p < 0.01 vs. control group. # p < 0.05 between TNF-alpha + Ezrin WT and TNF-alpha + Ezrin T567A groups.
- Submitted by
- Invitrogen Antibodies (provider)
- Main image

- Experimental details
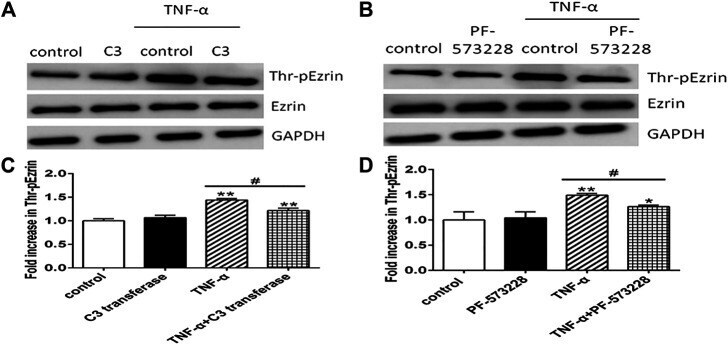
- FIGURE 5 Effect of RhoA or FAK inhibitor on the expression level of Thr-pEzrin in TNF-alpha-induced PMVECs. (A) RhoA inhibitor prevented TNF-alpha-induced Ezrin phosphorylation. PMVECs were pretreated with either vehicle or 2 mug/ml C3 transferase for 6 h before they were treated with 20 ng/ml TNF-alpha for 2 h (B) FAK inhibitor alleviated TNF-alpha-induced Ezrin phosphorylation. PMVECs were pretreated with either vehicle or 1 muM PF-573228 for 0.5 h before they were treated with 20 ng/ml TNF-alpha for 2 h (C,D) The according expression level of phosphorylated Ezrin protein from the Western blotting. Data were presented as mean +- SD. n = 3, * p < 0.05, and ** p < 0.01 compared to the control group. # p < 0.05 between the TNF-alpha group and the TNF-alpha + inhibitor group.
- Submitted by
- Invitrogen Antibodies (provider)
- Main image
- Experimental details
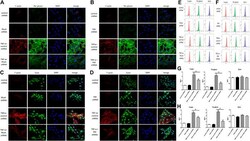
- FIGURE 7 Effect of RhoA shRNA or FAK shRNA on the rearrangement of F-actin and the distribution of Thr-pEzrin/Ezrin. (A,B) The TNF-alpha responses were prevented remarkably via RhoA shRNA and FAK shRNA treatment, respectively (C,D) There was no change in Ezrin protein under the same stimulation. Scale bar, 20 mum. (E,F) The fluorescence intensity of F-actin, Thr-pEzrin/Ezrin was detected via flow cytometry. (G,H) MFI from flow cytometry. All images were representative of three independent experiments with similar observations. Data were presented as mean +- SD. n = 3, ** p < 0.01 vs. control group. # p < 0.05 between TNF-alpha + control shRNA and TNF-alpha + RhoA/FAK shRNA groups.

- Submitted by
- Invitrogen Antibodies (provider)
- Main image
- Experimental details
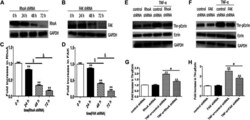
- FIGURE 8 Effect of RhoA shRNA or FAK shRNA on the expression level of Thr-pEzrin in TNF-alpha-induced PMVECs. (A) RhoA shRNA downregulated the expression level of RhoA. (B) After FAK shRNA treatment, the expression level of FAK decreased. (C,D) The according expression levels from the Western blotting (E,F) Pretreatment with RhoA shRNA prevented TNF-alpha-induced Ezrin phosphorylation and so can FAK shRNA. (G,H) The according expression levels from the Western blotting. Data were presented as the mean +- SD. n = 3, ** p < 0.01 compared to the control group. $ p < 0.05 between 24 h and 48 h groups. & p < 0.05 between 48 h and 72 h groups, # p < 0.05 between TNF-alpha + control shRNA and TNF-alpha + RhoA/FAK shRNA groups.

- Submitted by
- Invitrogen Antibodies (provider)
- Main image
- Experimental details
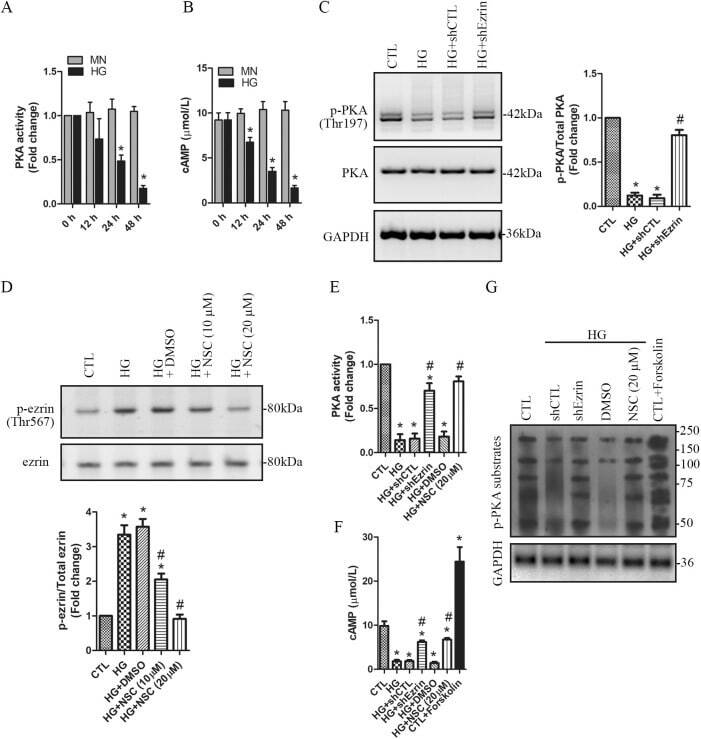
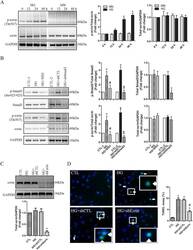
- Fig. 2. Smad3-mediated upregulation of phosphorylated ezrin involves HG -induced podocyte apoptosis. (A) Human podocytes were treated with HG (30 mM) for 0, 12, 24 and 48 h, respectively. Mannitol (MN) was used as the osmotic controls. The levels of the phosphorylated ezrin at Thr567 and total ezrin were assessed using western blotting. n =4 independent experiments. Data are presented as mean+-s.d. One-way ANOVA. * P

- Submitted by
- Invitrogen Antibodies (provider)
- Main image

- Experimental details
- Fig. 3. HG inhibits PKA activation through downregulation of cAMP by the phosphorylated ezrin in podocytes. (A,B) Human podocytes were treated with HG (30 mM) for 0, 12, 24 and 48 h, respectively. Mannitol (MN) was used as the osmotic controls. PKA activity (A) and intracellular cAMP levels (B) were measured and compared. n =4 independent experiments. Data are presented as mean+-s.d. One-way ANOVA. * P