Explore
 Validate
 Learn
Learn Western blot
 ELISA
ELISAAntibody data
- Antibody Data
- Antigen structure
- References [3]
- Comments [0]
- Validations
- Western blot [3]
- Immunocytochemistry [1]
- Other assay [5]
Submit
Validation data
Reference
Comment
Report error
- Product number
- MA1-12549 - Provider product page

- Provider
- Invitrogen Antibodies
- Product name
- p53 Monoclonal Antibody (X77)
- Antibody type
- Monoclonal
- Antigen
- Recombinant full-length protein
- Description
- A suggested positive control for this product is HCT116 cell lysate.
- Reactivity
- Human, Mouse, Xenopus
- Host
- Mouse
- Isotype
- IgG
- Antibody clone number
- X77
- Vial size
- 100 µg
- Concentration
- 1 mg/mL
- Storage
- -20° C, Avoid Freeze/Thaw Cycles
Submitted references The HIF-1α/p53/miRNA-34a/Klotho axis in retinal pigment epithelial cells promotes subretinal fibrosis and exacerbates choroidal neovascularization.
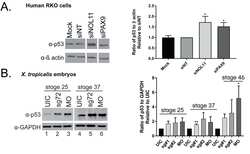
Paired Box 9 (PAX9), the RNA polymerase II transcription factor, regulates human ribosome biogenesis and craniofacial development.
The ribosome biogenesis factor Nol11 is required for optimal rDNA transcription and craniofacial development in Xenopus.
Xie L, Wang Y, Li Q, Ji X, Tu Y, Du S, Lou H, Zeng X, Zhu L, Zhang J, Zhu M
Journal of cellular and molecular medicine 2021 Feb;25(3):1700-1711
Journal of cellular and molecular medicine 2021 Feb;25(3):1700-1711
Paired Box 9 (PAX9), the RNA polymerase II transcription factor, regulates human ribosome biogenesis and craniofacial development.
Farley-Barnes KI, Deniz E, Overton MM, Khokha MK, Baserga SJ
PLoS genetics 2020 Aug;16(8):e1008967
PLoS genetics 2020 Aug;16(8):e1008967
The ribosome biogenesis factor Nol11 is required for optimal rDNA transcription and craniofacial development in Xenopus.
Griffin JN, Sondalle SB, Del Viso F, Baserga SJ, Khokha MK
PLoS genetics 2015 Mar;11(3):e1005018
PLoS genetics 2015 Mar;11(3):e1005018
No comments: Submit comment
Supportive validation
- Submitted by
- Invitrogen Antibodies (provider)
- Main image
- Experimental details
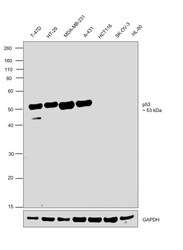
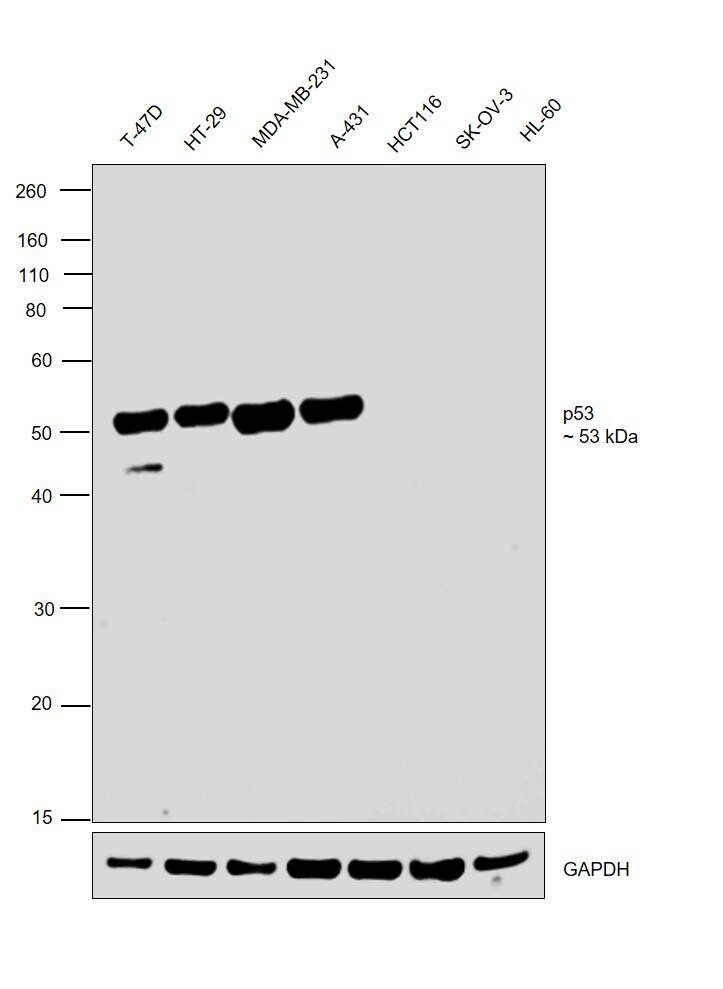
- Western blot was performed using Anti-p53 Monoclonal Antibody (X77) (Product # MA1-12549) and a 53 kDa band corresponding to Cellular tumor antigen p53 was observed across cell lines except HCT 116, SK-OV-3 and HL-60 which are reported to be negative. Modified whole cell extracts (1%SDS) (30 µg lysate) of T-47D (Lane 1), HT-29 (Lane 2), MDA-MB-231 (Lane 3), A-431 (Lane 4), HCT 116 (Lane 5), SK-O-V3 (Lane 6) and HL-60 (Lane 7) were electrophoresed using NuPAGE™ 10% Bis-Tris Protein Gel (Product # NP0302BOX). Resolved proteins were then transferred onto a Nitrocellulose membrane (Product # IB23001) by iBlot® 2 Dry Blotting System (Product # IB21001). The blot was probed with the primary antibody (2 µg/mL) and detected by chemiluminescence with Goat anti-Mouse IgG (H+L) Superclonal™ Recombinant Secondary Antibody, HRP (Product # A28177, 1:4000 dilution) using the iBright FL 1000 (Product # A32752). Chemiluminescent detection was performed using Novex® ECL Chemiluminescent Substrate Reagent Kit (Product # WP20005).
- Submitted by
- Invitrogen Antibodies (provider)
- Main image
- Experimental details
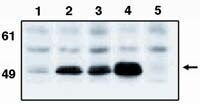
- Western blot analysis of p53 using a monoclonal antibody (Product # MA1-12549).
- Submitted by
- Invitrogen Antibodies (provider)
- Main image
- Experimental details
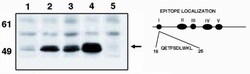
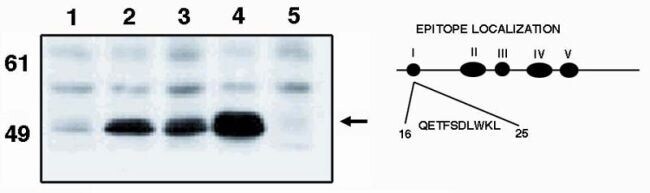
- Western blot analysis of p53 using a monoclonal antibody (Product # MA1-12549).
Supportive validation
- Submitted by
- Invitrogen Antibodies (provider)
- Main image
- Experimental details
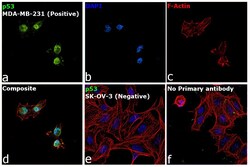
- Immunofluorescence analysis of Cellular tumor antigen p53 was performed using 70% confluent log phase MDA-MB-231 cells. The cells were fixed with 4% paraformaldehyde for 10 minutes, permeabilized with 0.1% Triton™ X-100 for 15 minutes, and blocked with 2% BSA for 45 minutes at room temperature. The cells were labeled with p53 Monoclonal Antibody (X77) (Product # MA1-12549) at 1:100 dilution in 0.1% BSA, incubated at 4 degree celsius overnight and then labeled with Donkey anti-Mouse IgG (H+L) Highly Cross-Adsorbed Secondary Antibody, Alexa Fluor Plus 488 (Product # A32766), (1:2000 dilution), for 45 minutes at room temperature (Panel a: Green). Nuclei (Panel b: Blue) were stained with ProLong™ Diamond Antifade Mountant with DAPI (Product # P36962). F-actin (Panel c: Red) was stained with Rhodamine Phalloidin (Product # R415, 1:300). Panel d represents the merged image showing Nuclear localization. Panel e represents SK-OV-3 cells having no expression of p53. Panel f represents control cells with no primary antibody to assess background. The images were captured at 60X magnification.

Supportive validation
- Submitted by
- Invitrogen Antibodies (provider)
- Main image
- Experimental details
- NULL
- Submitted by
- Invitrogen Antibodies (provider)
- Main image
- Experimental details
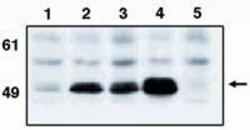
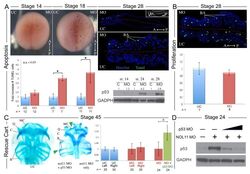
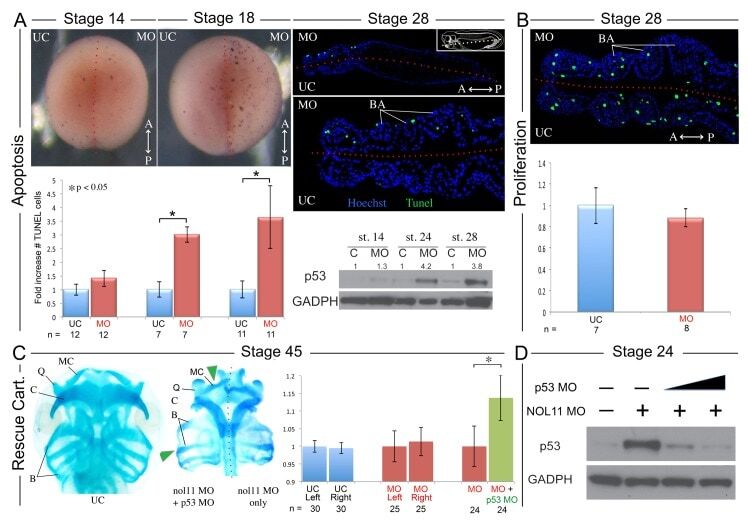
- Fig 4 Increased apoptosis underlies the nol11 cartilage defects. A) nol11 knockdown results in a progressive increase in apoptosis. At stage 14 no significant difference was observed in rates of TUNEL staining between knockdown and control halves of the embryo. At stages 18 and 28 increased apoptosis was evident on the treated side of whole mount and sectioned paraffin embedded embryos. Note that this increased apoptosis occurs primarily within the craniofacial ectomesenchyme. The graph represents the relative quantification of apoptosis rates at stages 14, 18 and 28. This stage specific increase in apoptosis was confirmed by a similar increase in p53 protein levels in 1 cell injected embryos as assayed by western blot (lower right panel). Dotted red lines mark the embryonic midline. B) No significant change in proliferation rates was noted following nol11 knockdown. C) Inhibition of apoptosis by p53 MO results in a partial rescue of cartilage size and morphology. Each pair of columns in the graph compares cartilage size measured in bilateral halves of embryos. The blue pair reveals no significant difference in cartilage measurements in the left vs right side of the UC embryonic head. In the second pair (red), cartilage size is seen to be comparable on either side of the nol11 morphant head. The final pair illustrates that cartilage size is significantly improved on the side of nol11 morphants rescued with p53 MO (green) relative to the side that received nol11 MO only (red).
- Submitted by
- Invitrogen Antibodies (provider)
- Main image

- Experimental details
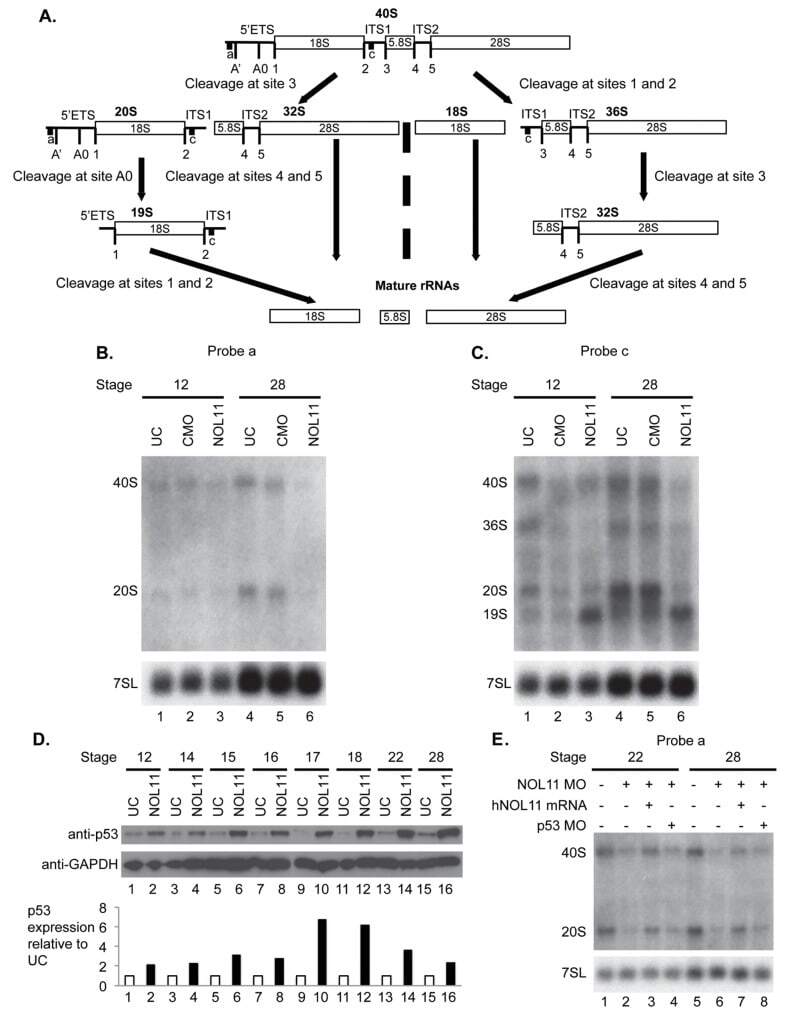
- Fig 5 Nol11 depletion impairs rDNA transcription and pre-rRNA processing in X . tropicalis . A) Scheme of pre-rRNA processing pathways in X tropicalis . The pre-rRNA is transcribed by RNAPI as a 40S polycistronic precursor. Several cleavages are required to separate the mature rRNAs. The locations of oligonucleotide probes used for northern blots are indicated by lettered lines (a, c) and the cleavage sites indicated. This scheme was adapted from [ 71 - 75 ]. B) Morpholino (MO) depletion of Nol11 impairs pre-rRNA transcription at stage 28. The northern blot was hybridized with probe a (Fig. 5A) and with a probe to the 7SL RNA as a loading control (lower panel). Bands were quantified and analysed by RAMP ([ 60 ]; S6A,B Fig ) C) Morpholino (MO) depletion of Nol11 impairs pre-rRNA transcription and processing. The northern blot was hybridized with probe c (Fig. 5A) and with a probe to the 7SL RNA as a loading control (lower panel). Bands were quantified and analysed by RAMP ([ 60 ]; S6C,D, E, F Fig ). D) Depletion of Nol11 leads to increased p53 levels. The expression of p53 from control and nol11 depleted embryos was analysed by western blot with anti-p53 antibodies. GAPDH levels were used as a loading control. Values for p53 expression normalized to GAPDH are represented in the bar graph. E) MO-resistant human NOL11 (hNOL11) mRNA but not p53 depletion rescues pre-rRNA levels. Embryos injected as shown by + and--in the figure at stages 22 and 28. The pre-rRNAs were visualized w
- Submitted by
- Invitrogen Antibodies (provider)
- Main image
- Experimental details
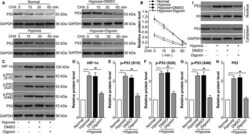
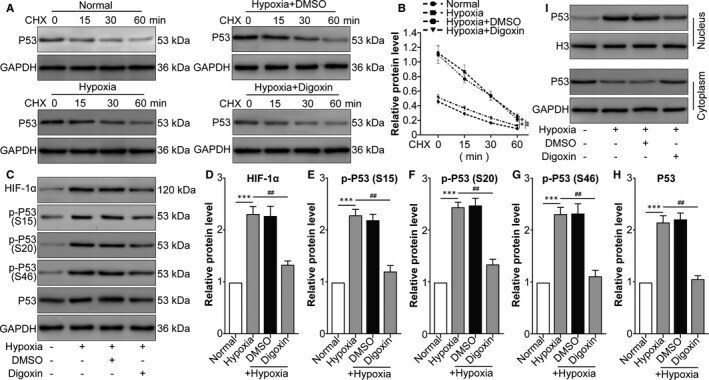
- FIGURE 1 Hypoxia-induced HIF-1alpha increases p53 stabilization, phosphorylation and nuclear translocation in ARPE cells. ARPE-19 cells were divided into the following groups: normal, hypoxia, hypoxia + 0.1% DMSO (the same volume as digoxin for 24 h) and hypoxia + digoxin (HIF-1alpha inhibitor; 0.5 mumol/L for 24 h). A, After different treatments, CHX (100 mug/mL) was used to treat human RPE cells prior to Western blot analysis. B, ImageJ was used to quantify p53 band densitometry. ** P < .01, hypoxia group vs normal group. ## P < .05, hypoxia + digoxin group vs hypoxia group. C, Western blot was performed to measure HIF-1alpha, p-p53 (S15), p-p53 (S20), p-p53 (S46) and p53 protein levels. The relative protein level of HIF-1alpha compared with the GAPDH level (D) and the ratio of p-p53 (S15)/p53 (E), p-p53 (S20)/p53 (F), p-p53 (S46)/p53 (G) and p53/GAPDH (H) were analysed. *** P < .001, hypoxia group vs normal group. ## P < .01, hypoxia + digoxin group vs hypoxia group. I, Nuclear and cytoplasmic separation samples were prepared, and Western blot was performed to measure p53 protein levels. Histone 3 (H3) and GAPDH were used as the nuclear and cytoplasmic markers, respectively
- Submitted by
- Invitrogen Antibodies (provider)
- Main image
- Experimental details
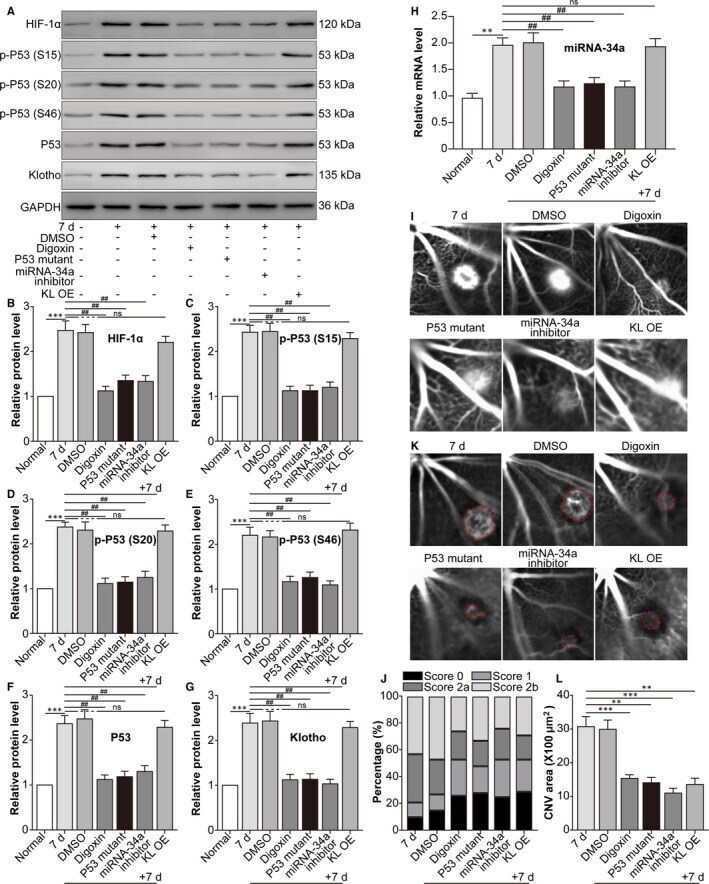
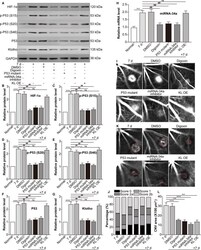
- FIGURE 5 Blockade of the HIF-1alpha/p53/miRNA-34a/Klotho axis decreases the leakage and area of mouse laser-induced CNV. The mice were divided into the following groups: normal, CNV 7 d, CNV 7 d + 0.1% DMSO, CNV 7 d + digoxin (oral; 2 mg/kg for 7 d), CNV 7 d + AAV-p53 mutant (intravitreal injection; approximately 3 muL, 3 x 10 10 viral particles/mL), CNV 7 d + miRNA-34a inhibitor (intravitreal injection; 1 mug) and CNV 7 d + AAV-Klotho full-length plasmid (intravitreal injection, 2 muL, 5 x 10 10 viral particles/mL). A, Western blot was performed to measure HIF-1alpha, p-p53 (S15), p53 (S20), p-p53 (S46), p53 and Klotho protein levels. B, The relative protein levels of HIF-1alpha/GAPDH (B), p-p53 (S15)/p53 (C), p-p53 (S20)/p53 (D), p-p53 (S46)/p53 (E), p53/GAPDH (F) and Klotho/GAPDH (G) were analysed. *** P < .001, CNV 7-d group vs normal group. ## P < .01, compared with the CNV 7-d group. NS, CNV 7 d + KL OE group vs CNV 7-d group. H, RT-PCR was performed to measure the expression of miRNA-34a. ** P < .01, CNV 7-d group vs normal group. ## P < .01, compared with the CNV 7-d group. NS, CNV 7 d + KL OE group vs CNV 7-d group. I, FFA was performed to measure the leakage of CNV. J, The leakage of CNV was analysed. K, ICGA was performed to measure the area of CNV. L, The area of CNV was analysed. ** P < .01, *** P < .001, compared with the CNV 7-d group