Explore
 Validate
 Learn
Learn Western blot
Antibody data
- Antibody Data
- Antigen structure
- References [0]
- Comments [0]
- Validations
- Western blot [3]
- Chromatin Immunoprecipitation [1]
Submit
Validation data
Reference
Comment
Report error
- Product number
- 701267 - Provider product page

- Provider
- Invitrogen Antibodies
- Product name
- Phospho-MEK1 (Ser217, Ser221) Recombinant Rabbit Monoclonal Antibody (13H22L22)
- Antibody type
- Monoclonal
- Antigen
- Synthetic peptide
- Description
- This antibody is predicted to react with mouse, rat, Drosophila, non-human primate and rabbit based on sequence homology.
- Antibody clone number
- 13H22L22
- Concentration
- 0.5 mg/mL
No comments: Submit comment
Supportive validation
- Submitted by
- Invitrogen Antibodies (provider)
- Main image

- Experimental details
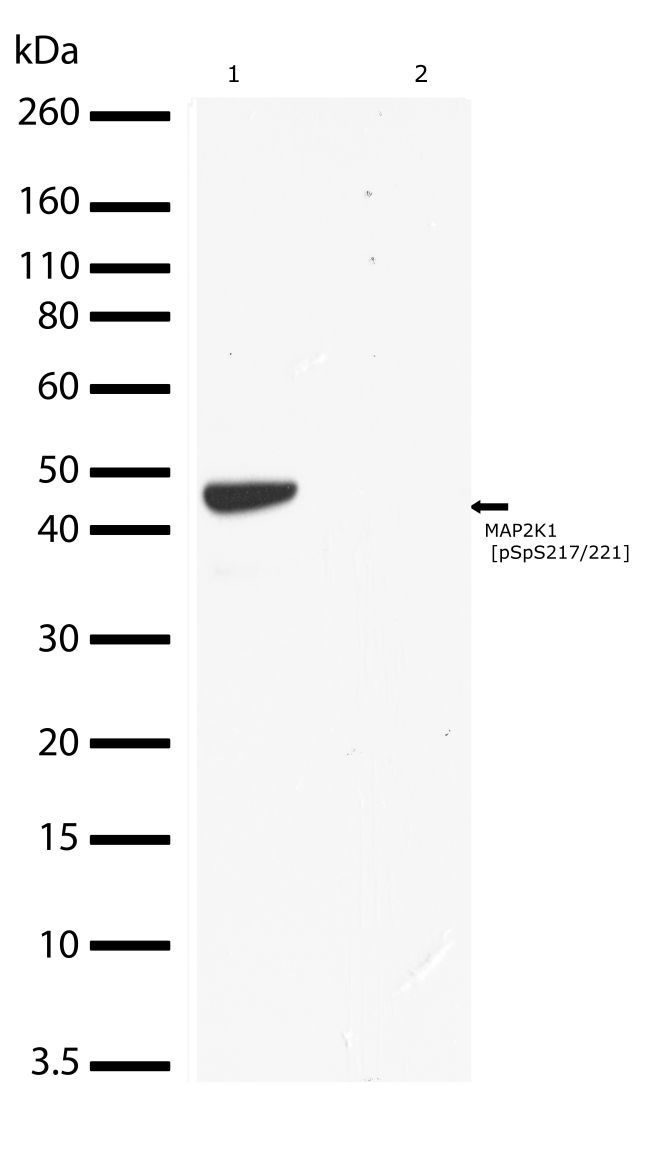
- Western blot analysis of Phospho-MEK1 pSer217/221 in Jurkat cells treated with PMA (50 ng/mL) for 20 min using a Phospho-MEK1 pSer217/221 recombinant rabbit monoclonal antibody (Product # 701267) at a dilution of 2 µg/mL. To confirm specificity, competition was performed by preincubation with the phosphopeptide to inhibit antibody binding (lane 2). Samples were detected using chemiluminescence (ECL). Results show a band at ~44 kDa.
- Submitted by
- Invitrogen Antibodies (provider)
- Main image

- Experimental details
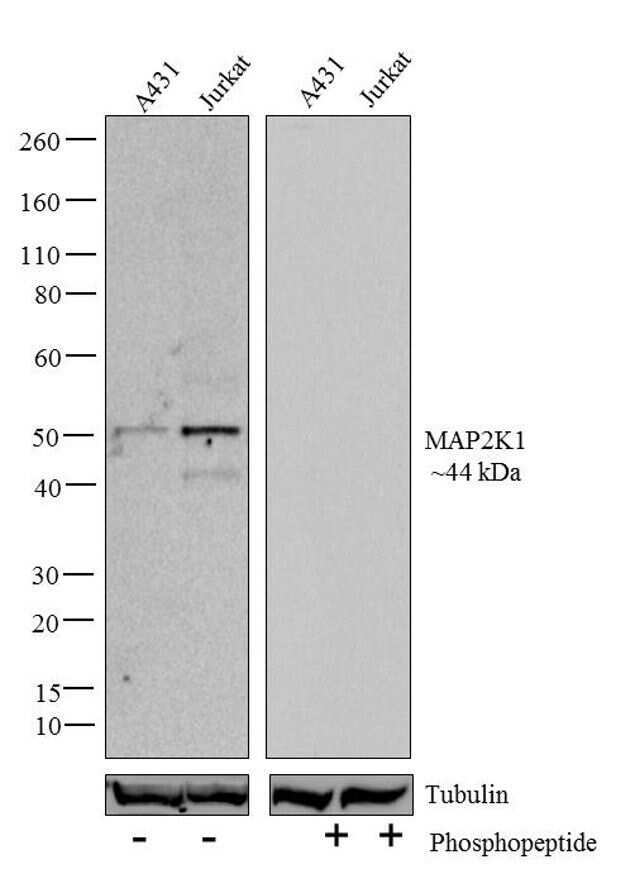
- Western blot analysis of MAP2K1 (pSpS217/221) was performed by loading 20 µg of A431 (lane1) and Jurkat (lane2) cell lysates using Novex®NuPAGE®4-12 % Bis-Tris gel (Product # NP0321BOX), XCell SureLock Electrophoresis System (Product # EI0002), Novex® Sharp Pre-Stained Protein Standard (Product # LC5800), and iBlot® Dry Blotting System (Product # IB21001). Proteins were transferred to a nitrocellulose membrane and blocked with 5 % skim milk for 1 hour at room temperature. MAP2K1 (pSpS217/221) was detected at ~44 kDa using MAP2K1 (pSpS217/221) Recombinant Rabbit Monoclonal Antibody (Product # 701267) at 1-3 µg/mL in 2.5 % skim milk at 4°C overnight on a rocking platform. To confirm specificity, the corresponding blot on right was incubated with Lambda phosphatase and its reactivity with antibody was tested. Goat anti-Rabbit IgG-HRP Secondary Antibody (Product # G-21234) at 1:5000 dilution was used and chemiluminescent detection was performed using Pierce™ ECL Western blotting Substrate (Product # 32106).
- Submitted by
- Invitrogen Antibodies (provider)
- Main image
- Experimental details
- Western blot analysis of Phospho-MEK1 pSer217/221 in Jurkat cells treated with PMA (50 ng/mL) for 20 min using a Phospho-MEK1 pSer217/221 recombinant rabbit monoclonal antibody (Product # 701267) at a dilution of 2 µg/mL. To confirm specificity, competition was performed by preincubation with the phosphopeptide to inhibit antibody binding (lane 2). Samples were detected using chemiluminescence (ECL). Results show a band at ~44 kDa.
Supportive validation
- Submitted by
- Invitrogen Antibodies (provider)
- Main image

- Experimental details
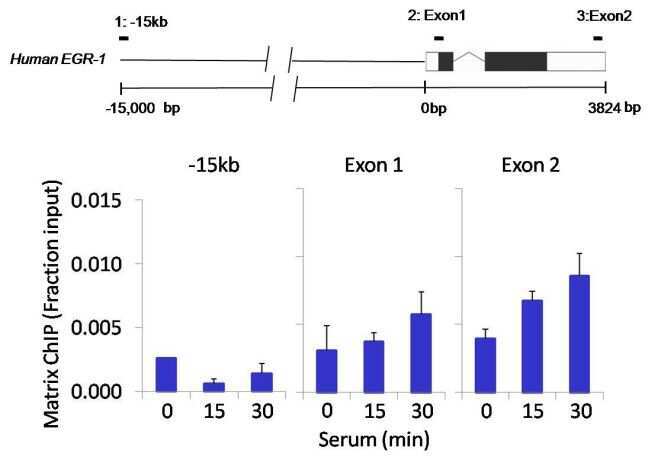
- Chromatin immunoprecipitation analysis of Phospho-MEK1/MAP2K1 (pSer217+221) was performed using cross-linked chromatin from 1 x 10^6 HCT116 human colon carcinoma cells treated with serum for 0, 15, and 30 minutes. Immunoprecipitation was performed using a multiplex microplate Matrix ChIP assay (see reference for Matrix ChIP protocol: http://www.ncbi.nlm.nih.gov/pubmed/22098709) with 1.0 µL/100 µL well volume of a Phospho-MEK1/MAP2K1 rabbit monoclonal antibody (Product # 701267). Chromatin aliquots from ~1 x 10^5 cells were used per ChIP pull-down. Quantitative PCR data were done in quadruplicate using 1 µL of eluted DNA in 2 µL SYBR real-time PCR reactions containing primers to amplify -15kb upstream of the human Egr-1 locus, or exon-1 or exon-2 of Egr-1. PCR calibration curves were generated for each primer pair from a dilution series of sheared total genomic DNA. Quantitation of immunoprecipitated chromatin is presented as signal relative to the total amount of input chromatin. Results represent the mean +/- SEM for three experiments. A schematic representation of the Egr-1 locus is shown above the data where boxes represent exons (black boxes = translated regions, white boxes = untranslated regions), the zigzag line represents an intron, and the straight line represents upstream sequence. Regions amplified by Egr-1 primers are represented by black bars. Data courtesy of the Innovators Program.