Explore
 Validate
 Learn
Learn Western blot
Antibody data
- Antibody Data
- Antigen structure
- References [0]
- Comments [0]
- Validations
- Western blot [1]
- Chromatin Immunoprecipitation [1]
Submit
Validation data
Reference
Comment
Report error
- Product number
- 700632 - Provider product page

- Provider
- Invitrogen Antibodies
- Product name
- Phospho-PYK2 (Tyr402) Recombinant Rabbit Monoclonal Antibody (17H4L19)
- Antibody type
- Monoclonal
- Antigen
- Synthetic peptide
- Description
- Intact IgG appears on a non-reducing gel as ~150 kDa band and upon reduction generating a ~25 kDa light chain band and a ~50 kDa heavy chain.
- Antibody clone number
- 17H4L19
- Concentration
- 0.5 mg/mL
No comments: Submit comment
Supportive validation
- Submitted by
- Invitrogen Antibodies (provider)
- Main image
- Experimental details
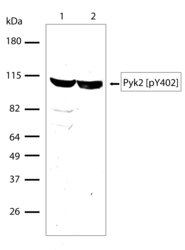
- Western blot analysis of Phospho-FAK2 pTyr402 in whole cell extract (60 µg per lane) from A431 cells (lane 1) and Raji cells (lane 2) using a Phospho-FAK2 pTyr402 recombinant rabbit monoclonal antibody (Product # 700632) at a dilution of 5 µg/mL. Detection was performed using an HRP-conjugated goat anti-rabbit secondary antibody at a dilution of 1:5000 followed by chemiluminescence (ECL). Results show a band at ~115 kDa.

Supportive validation
- Submitted by
- Invitrogen Antibodies (provider)
- Main image
- Experimental details
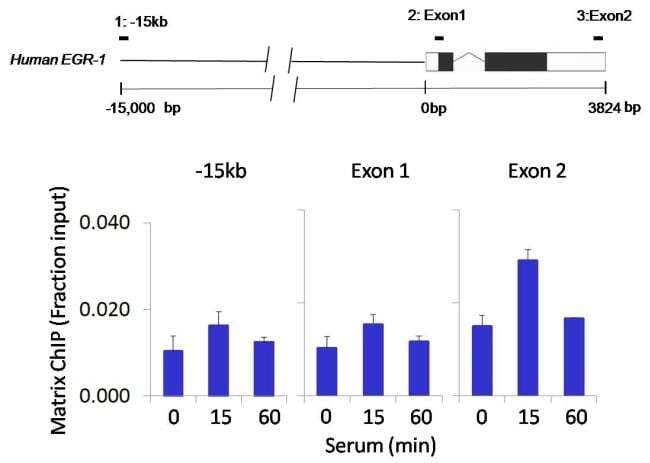
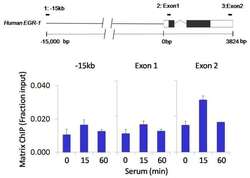
- Chromatin immunoprecipitation analysis of Phospho-FAK2/PYK2 (pTyr402) performed using cross-linked chromatin from 1 x 10^6 HCT116 human colon carcinoma cells treated with serum for 0, 15, and 60 minutes. Immunoprecipitation was performed using a multiplex microplate Matrix ChIP assay (see reference for Matrix ChIP protocol: http://www.ncbi.nlm.nih.gov/pubmed/22098709) with 1.0 µL/100 µL well volume of a Phospho-FAK2/PYK2 (pTyr402) rabbit monoclonal antibody (Product # 700632). Chromatin aliquots from ~1 x 10^5 cells were used per ChIP pull-down. Quantitative PCR data were done in quadruplicate using 1 µL of eluted DNA in 2 µL SYBR real-time PCR reactions containing primers to amplify -15kb upstream of the human Egr-1 locus, or exon-1 or exon-2 of Egr-1. PCR calibration curves were generated for each primer pair from a dilution series of sheared total genomic DNA. Quantitation of immunoprecipitated chromatin is presented as signal relative to the total amount of input chromatin. Results represent the mean +/- SEM for three experiments. A schematic representation of the Egr-1 locus is shown above the data where boxes represent exons (black boxes = translated regions, white boxes = untranslated regions), the zigzag line represents an intron, and the straight line represents upstream sequence. Regions amplified by Egr-1 primers are represented by black bars. Data courtesy of the Innovators Program.