 Explore
 Validate
 Learn
LearnAHO1232
antibody from Invitrogen Antibodies
Targeting: MTOR
FLJ44809, FRAP, FRAP1, FRAP2, RAFT1, RAPT1
 Western blot
Antibody data
- Antibody Data
- Antigen structure
- References [8]
- Comments [0]
- Validations
- Western blot [2]
- Immunocytochemistry [1]
- Immunohistochemistry [1]
- Other assay [7]
Submit
Validation data
Reference
Comment
Report error
- Product number
- AHO1232 - Provider product page

- Provider
- Invitrogen Antibodies
- Product name
- mTOR Monoclonal Antibody (215Q18)
- Antibody type
- Monoclonal
- Antigen
- Recombinant protein fragment
- Reactivity
- Human, Mouse, Rat
- Host
- Mouse
- Isotype
- IgG
- Antibody clone number
- 215Q18
- Vial size
- 100 µg
- Concentration
- 0.5 mg/mL
- Storage
- -20°C
Submitted references SCA(®) Slows the Decline of Functional Parameters Associated with Senescence in Skin Cells.
Discovery of a novel potentially transforming somatic mutation in CSF2RB gene in breast cancer.
Isolation and Establishment of a Highly Proliferative, Cancer Stem Cell-Like, and Naturally Immortalized Triple-Negative Breast Cancer Cell Line, KAIMRC2.
Interaction of YAP1 and mTOR promotes bladder cancer progression.
UPF2 leads to degradation of dendritically targeted mRNAs to regulate synaptic plasticity and cognitive function.
A Stat6/Pten Axis Links Regulatory T Cells with Adipose Tissue Function.
Anti-inflammatory and Antitumor Activity of a Triple Therapy for a Colitis-Related Colorectal Cancer.
Rapamycin reveals an mTOR-independent repression of Kv1.1 expression during epileptogenesis.
Castro B, de Paz N, González S, Rodríguez-Luna A
International journal of molecular sciences 2022 Jun 10;23(12)
International journal of molecular sciences 2022 Jun 10;23(12)
Discovery of a novel potentially transforming somatic mutation in CSF2RB gene in breast cancer.
Rashid M, Ali R, Almuzzaini B, Song H, AlHallaj A, Abdulkarim AA, Mohamed Baz O, Al Zahrani H, Mustafa Sabeena M, Alharbi W, Hussein M, Boudjelal M
Cancer medicine 2021 Nov;10(22):8138-8150
Cancer medicine 2021 Nov;10(22):8138-8150
Isolation and Establishment of a Highly Proliferative, Cancer Stem Cell-Like, and Naturally Immortalized Triple-Negative Breast Cancer Cell Line, KAIMRC2.
Ali R, Al Zahrani H, Barhoumi T, Alhallaj A, Mashhour A, Alshammari MA, Alshawakir YA, Baz O, Alanazi AH, Khan AL, Al Nikhli H, Al Balwi MA, Al Riyees L, Boudjelal M
Cells 2021 May 24;10(6)
Cells 2021 May 24;10(6)
Interaction of YAP1 and mTOR promotes bladder cancer progression.
Xu M, Gu M, Zhou J, Da J, Wang Z
International journal of oncology 2020 Jan;56(1):232-242
International journal of oncology 2020 Jan;56(1):232-242
UPF2 leads to degradation of dendritically targeted mRNAs to regulate synaptic plasticity and cognitive function.
Notaras M, Allen M, Longo F, Volk N, Toth M, Li Jeon N, Klann E, Colak D
Molecular psychiatry 2020 Dec;25(12):3360-3379
Molecular psychiatry 2020 Dec;25(12):3360-3379
A Stat6/Pten Axis Links Regulatory T Cells with Adipose Tissue Function.
Kälin S, Becker M, Ott VB, Serr I, Hosp F, Mollah MMH, Keipert S, Lamp D, Rohner-Jeanrenaud F, Flynn VK, Scherm MG, Nascimento LFR, Gerlach K, Popp V, Dietzen S, Bopp T, Krishnamurthy P, Kaplan MH, Serrano M, Woods SC, Tripal P, Palmisano R, Jastroch M, Blüher M, Wolfrum C, Weigmann B, Ziegler AG, Mann M, Tschöp MH, Daniel C
Cell metabolism 2017 Sep 5;26(3):475-492.e7
Cell metabolism 2017 Sep 5;26(3):475-492.e7
Anti-inflammatory and Antitumor Activity of a Triple Therapy for a Colitis-Related Colorectal Cancer.
Figueroa-González G, García-Castillo V, Coronel-Hernández J, López-Urrutia E, León-Cabrera S, Arias-Romero LE, Terrazas LI, Rodríguez-Sosa M, Campos-Parra AD, Zúñiga-Calzada E, Lopez-Camarillo C, Morales-González F, Jacobo-Herrera NJ, Pérez-Plasencia C
Journal of Cancer 2016;7(12):1632-1644
Journal of Cancer 2016;7(12):1632-1644
Rapamycin reveals an mTOR-independent repression of Kv1.1 expression during epileptogenesis.
Sosanya NM, Brager DH, Wolfe S, Niere F, Raab-Graham KF
Neurobiology of disease 2015 Jan;73:96-105
Neurobiology of disease 2015 Jan;73:96-105
No comments: Submit comment
Supportive validation
- Submitted by
- Invitrogen Antibodies (provider)
- Main image
- Experimental details
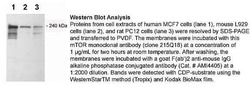
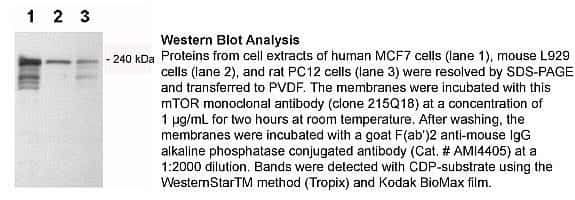
- Western blot analysis of mTOR using a monoclonal antibody (Product # AHO1232).
- Submitted by
- Invitrogen Antibodies (provider)
- Main image
- Experimental details
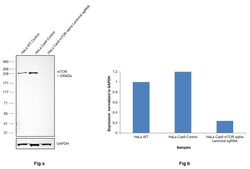
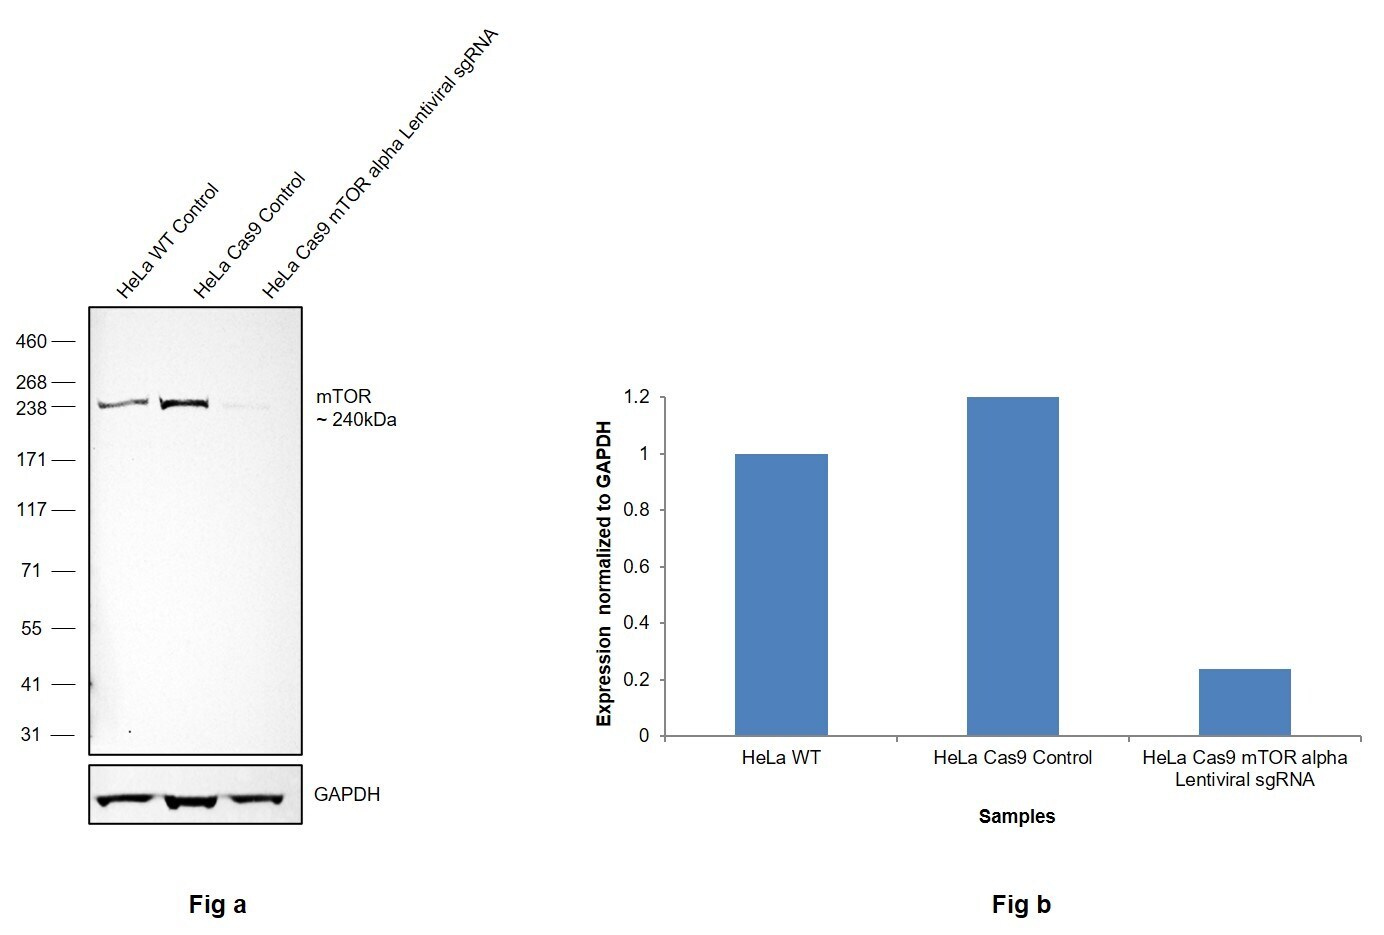
- CRISPR-Cas9 mediated genome editing ofmTOR (as confirmed by next generation sequencing) was achieved by using LentiArray™ Lentiviral sgRNA (Product # A32042, Assay ID CRISPR814789_LV) and LentiArray Cas9 Lentivirus (Product # A32064). Fig (a) Western blot analysis of mTOR was performed by loading 60 µg of HeLa wild type (Lane 1), HeLa Cas9 (Lane 2) and HeLa Cas9 cells transduced with mTOR Lentiviral sgRNA (Lane 3) whole cell extracts. The samples were electrophoresed using NuPAGE™ Novex™ 4-12% Bis-Tris Protein Gel (Product # NP0321BOX). Resolved proteins were then transferred onto a nitrocellulose membrane (Product # IB23001) by iBlot® 2 Dry Blotting System (Product # IB21001). The blot was probed with Anti-mTOR Monoclonal Antibody (215Q18) (Product # AHO1232) using 1 µg/mL dilution and Goat anti-Mouse IgG (H+L) Superclonal™ Recombinant Secondary Antibody, HRP (Product # A28177 1:5000 dilution).Chemiluminescent detection was performed using Novex® ECL Chemiluminescent Substrate Reagent Kit (Product # WP20005). A reduced signal in sgRNA transduced cells using the LentiArray™ CRISPR product line G2confirms that antibody is specific tomTOR (Fig (b)).
Supportive validation
- Submitted by
- Invitrogen Antibodies (provider)
- Main image

- Experimental details
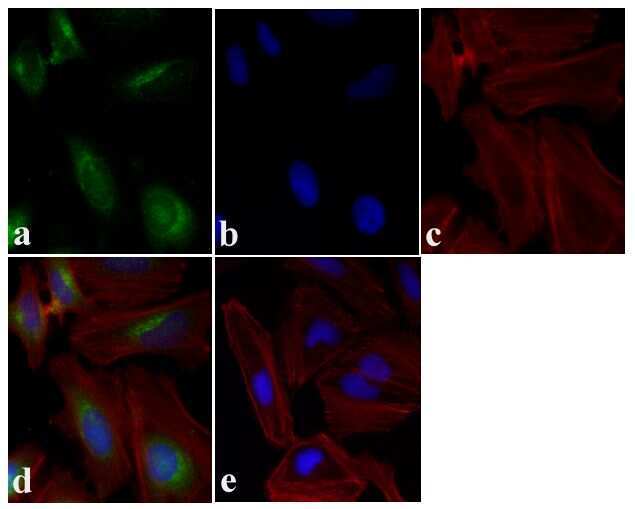
- Immunofluorescent analysis of mTOR was done on 70% confluent log phase HeLa cells. The cells were fixed with 4% paraformaldehyde for 15 minutes, permeabilized with 0.25% Triton X-100 for 10 minutes, and blocked with 5% BSA for 1 hour at room temperature. The cells were labeled with mTOR Mouse monoclonal Antibody (Product # AHO1232) at 2 µg/mL in 1% BSA and incubated for 3 hours at room temperature and then labeled with Alexa Fluor 488 Rabbit Anti-Mouse IgG Secondary Antibody (Product # A-11059) at a dilution of 1:400 for 30 minutes at room temperature (Panel a: green). Nuclei (Panel b: blue) were stained with SlowFade® Gold Antifade Mountant DAPI (Product # S36938). F-actin (Panel c: red) was stained with Alexa Fluor 594 Phalloidin (Product # A12381). Panel d is a merged image showing cytoplasmic localization. Panel e shows no primary antibody control. The images were captured at 20X magnification.
Supportive validation
- Submitted by
- Invitrogen Antibodies (provider)
- Main image
- Experimental details
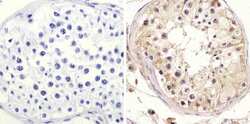
- Immunohistochemistry analysis of mTOR showing staining in the cytoplasm of paraffin-embedded human testis tissue (right) compared to a negative control without primary antibody (left). To expose target proteins, antigen retrieval was performed using 10mM sodium citrate (pH 6.0), microwaved for 8-15 min. Following antigen retrieval, tissues were blocked in 3% H2O2-methanol for 15 min at room temperature, washed with ddH2O and PBS, and then probed with a mTOR Mouse Monoclonal Antibody (clone 215Q18) (Product # AHO1232) diluted in 3% BSA-PBS at a dilution of 1:50 overnight at 4°C in a humidified chamber. Tissues were washed extensively in PBST and detection was performed using an HRP-conjugated secondary antibody followed by colorimetric detection using a DAB kit. Tissues were counterstained with hematoxylin and dehydrated with ethanol and xylene to prep for mounting.

Supportive validation
- Submitted by
- Invitrogen Antibodies (provider)
- Main image
- Experimental details
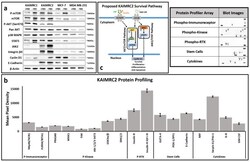
- Figure 3 ( a , b ) Protein profiling of KAMRC2 cell line. ( a ) Western blot analysis of comparison of several breast carcinoma cell lines revealed that KAIMRC2 has constitutively active AKT and mTOR . Strongly positive Integrin beta4 and E-cadherin are indicative of cancer stemlike subtype. ( b ) Several protein profiler arrays showed noticeable insulin receptor expression, GATA-4 , PDX-1 , E-cadherin , and Serpin E1 . Interestingly, high expression of Cyclin D1 was found in the starvation condition in KAIMRC2 cells. ( c ) Our proposed model of the KAIMRC2 cell line survival pathway.

- Submitted by
- Invitrogen Antibodies (provider)
- Main image
- Experimental details
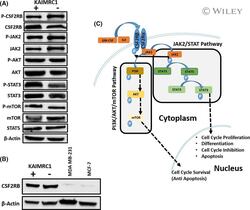
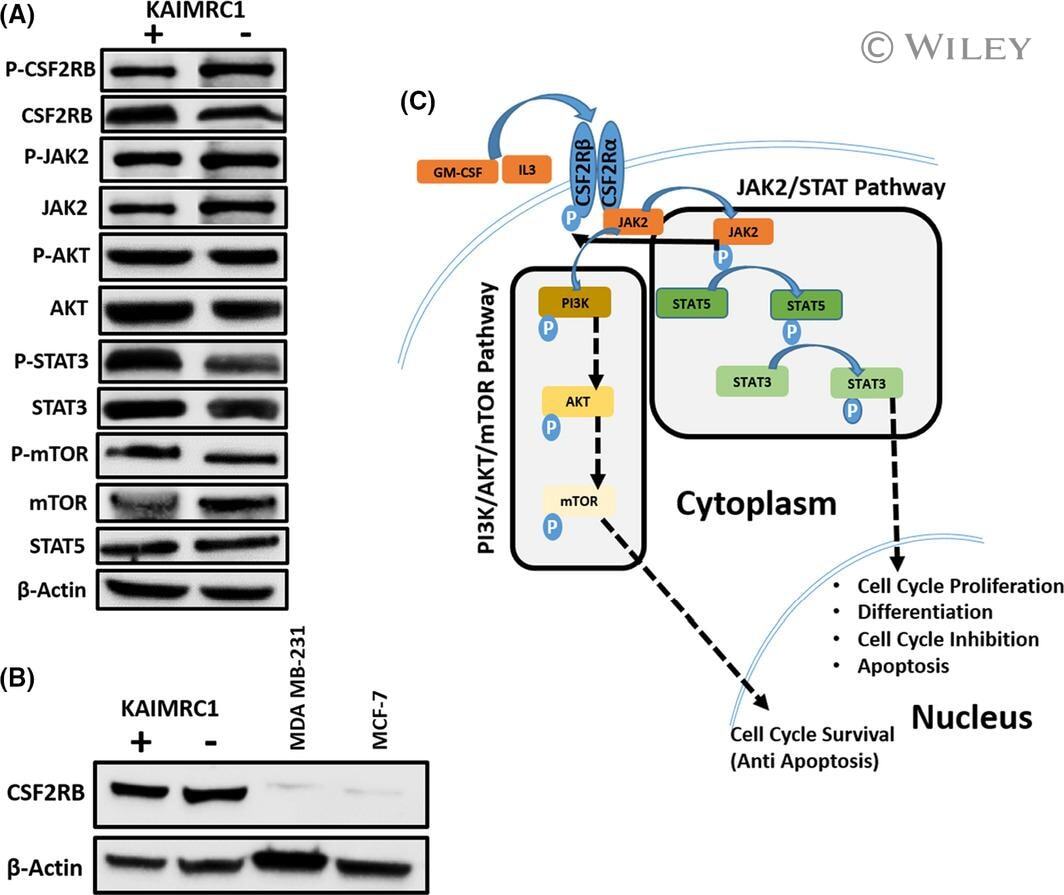
- 2 FIGURE Characterization of KAIMRC1 cells on protein level. (A) Western blot analysis of the KAIMRC1 cell line in normal (+) and serum-starved conditions(-) against P- CSF2RB , CSF2RB , P-AKT1, AKT1, JAK2, P-JAK2, STAT3, P-STAT3, STAT5, mTOR, and P-mTOR. Ligand-independent activation of AKT/mTOR pathway, as well as the JAK2/STAT pathway, was observed. (B) Comparative Western blot analysis of KAIMRC1, MDA-MB-231, and MCF-7 cell lines against CSF2RB . (C) Schematic representation of proposed activation of the AKT/mTOR pathway and JAK2/STAT pathway that might result in cell cycle survival and proliferation
- Submitted by
- Invitrogen Antibodies (provider)
- Main image
- Experimental details
- FIGURE 2 Characterization of KAIMRC1 cells on protein level. (A) Western blot analysis of the KAIMRC1 cell line in normal (+) and serum-starved conditions(-) against P- CSF2RB , CSF2RB , P-AKT1, AKT1, JAK2, P-JAK2, STAT3, P-STAT3, STAT5, mTOR, and P-mTOR. Ligand-independent activation of AKT/mTOR pathway, as well as the JAK2/STAT pathway, was observed. (B) Comparative Western blot analysis of KAIMRC1, MDA-MB-231, and MCF-7 cell lines against CSF2RB . (C) Schematic representation of proposed activation of the AKT/mTOR pathway and JAK2/STAT pathway that might result in cell cycle survival and proliferation

- Submitted by
- Invitrogen Antibodies (provider)
- Main image

- Experimental details
- Figure 4 SCA (r) treatment markedly inhibited mTOR activation triggered by H 2 O 2 exposure. Immunostaining of mTOR. Representative inverted fluorescence microscopy images immunostained with anti-mTOR antibody appear in red, while nuclei stained with Hoechst probe appear in blue. Fibroblasts ( a - c ) and B16-F10 cells ( d - f ) exposed to H 2 O 2 ( b , e ) and H 2 O 2 -exposed treated with SCA (r) ( c , f ). Scale bars: 200 mum.

- Submitted by
- Invitrogen Antibodies (provider)
- Main image
- Experimental details
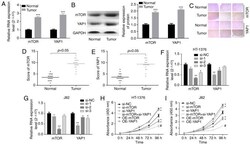
- Figure 1 Knockdown of YAP1 and mTOR inhibited the progression of bladder cancer. (A and B) RT-PCR and western blot assays were performed to test the expression of YAP1 and mTOR in bladder cancer and normal bladder tissues ( *** P

- Submitted by
- Invitrogen Antibodies (provider)
- Main image
- Experimental details
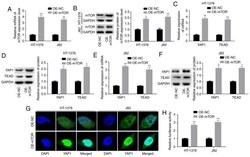
- Figure 2 Crosstalk between the YAP1 and mTOR proteins. (A and B) HT-1376 and J82 cells were transfected with OE-mTOR and OE-NC; then cells were harvested and subjected to RT-PCR and western blot assays to determine the expression of mTOR at the mRNA and protein levels, respectively. (C-F) RT-PCR and western blot assays were performed to determine the mRNA and protein expression of YAP1 and TEAD after 48 h of HT-1376 and J82 cell transfection with OE-mTOR or OE-NC. (G) Immunofluorescence assay was performed to evaluate the effects of subcellular location of the YAP1 protein. (H) Statistical analysis of the fluorescence intensity of the YAP1 protein ( * P

- Submitted by
- Invitrogen Antibodies (provider)
- Main image

- Experimental details
- Figure 4 Interaction between YAP1 protein and mTOR protein in HT-1376 and J82 cells. (A) Immunofluorescence assay was performed to evaluate the subcellular localization of the YAP1 and SKP2 proteins. (B) Duolink assay was performed to evaluate the subcellular localization of the YAP1 and mTOR proteins. (C and D) Western blotting was performed to assess the expression of flag and YAP1 after J82 and HT-1376 cells were transfected with flag-tag or YAP1-flag-tag vector ( * P
