Explore
 Validate
 Learn
Learn Western blot
 Immunocytochemistry
Antibody data
- Antibody Data
- Antigen structure
- References [1]
- Comments [0]
- Validations
- Immunocytochemistry [1]
- Other assay [2]
Submit
Validation data
Reference
Comment
Report error
- Product number
- 374988 - Provider product page

- Provider
- Invitrogen Antibodies
- Product name
- Claudin 1 Monoclonal Antibody (2H10D10), Alexa Fluor™ 488
- Antibody type
- Monoclonal
- Antigen
- Synthetic peptide
- Description
- Reactivity has been confirmed with human Caco-2 and canine MDCK cell lysates, mouse kidney and intestinal lysates, frozen mouse intestine (jejunum) tissue, and rat kidney homogenates.
- Reactivity
- Human, Mouse, Rat, Canine
- Host
- Mouse
- Conjugate
- Green dye
- Isotype
- IgG
- Antibody clone number
- 2H10D10
- Vial size
- 100 µg
- Concentration
- 0.5 mg/mL
- Storage
- 4° C, store in dark
Submitted references Inhibition of MicroRNA-155 Supports Endothelial Tight Junction Integrity Following Oxygen-Glucose Deprivation.
Pena-Philippides JC, Gardiner AS, Caballero-Garrido E, Pan R, Zhu Y, Roitbak T
Journal of the American Heart Association 2018 Jun 26;7(13)
Journal of the American Heart Association 2018 Jun 26;7(13)
No comments: Submit comment
Supportive validation
- Submitted by
- Invitrogen Antibodies (provider)
- Main image

- Experimental details
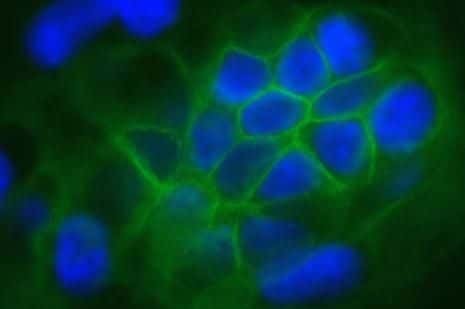
- Human Caco-2 cells stained with Claudin-1, Mouse Monoclonal Antibody - Alexa Fluor® 488 (Product # 374988). DNA is counter stained with blue Hoechst 33258 (Product # H3569).
- Conjugate
- Green dye
Supportive validation
- Submitted by
- Invitrogen Antibodies (provider)
- Main image

- Experimental details
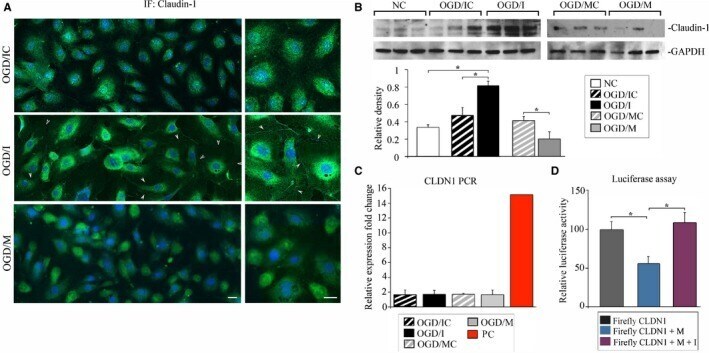
- Figure 5 MicroRNA-155 (miR-155) inhibition results in stabilization of claudin-1 (CLDN1). A, Immunofluorescence (IF) staining of CLDN1 in oxygen-glucose deprivation ( OGD) /control inhibitor (OGD/IC), specific miR-155 inhibitor (OGD/I), and mimic ( OGD /M) cells. Arrows demonstrate cell membrane localization of CLDN1 in OGD /I cells. Imaging was performed with a Zeiss LSM 800 confocal microscope using tile scan and Z stack image acquisitions. Bar: 20 mum. B, Western blot analysis of CLDN1 protein expression in normoxic control (NC), OGD / IC , OGD /I, mimic control (OGD/ MC), and OGD /M samples. Graph: optical density of the protein bands was measured using ImageJ software, normalized to GAPDH density in every sample, and expressed as the average relative density values. Mann-Whitney (Wilcoxon) test and Kruskal test were used to compare pairwise difference and overall difference, respectively. Overall differences were highly significant ( P =0.0095); the pairwise difference between NC and OGD /I, OGD / IC, and OGD /I, and between OGD / MC and OGD /M was also significant ( P =0.029). n=4 (for NC ) and n=6 (for other groups) independent experiments. C, CLDN1 ( CLDN 1 ) quantitative polymerase chain reaction was performed in all samples (4 samples per group) and expressed as the relative fold change compared with CLDN 1 expression in NC samples. Red bar demonstrates CLDN 1 expression in the positive control sample (a mix of cDNA s synthesized from total RNA from 18 different hum
- Conjugate
- Green dye
- Submitted by
- Invitrogen Antibodies (provider)
- Main image

- Experimental details
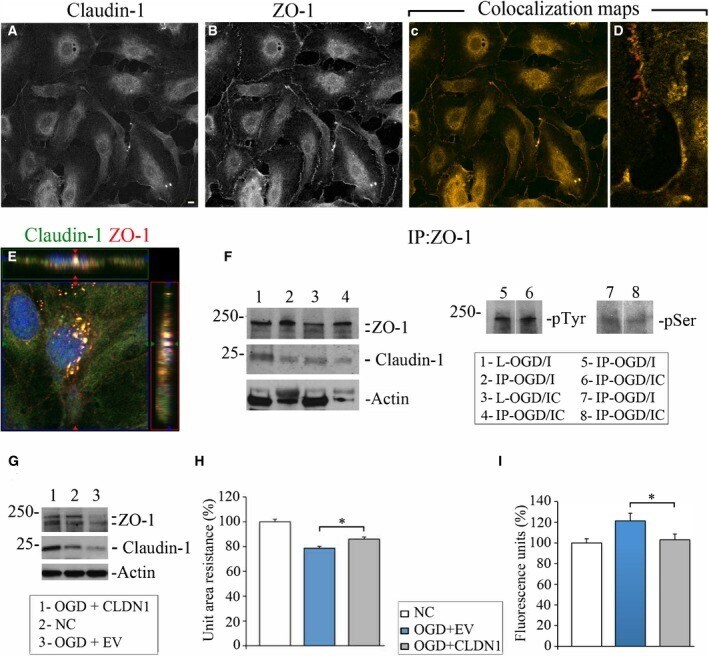
- Figure 6 Claudin-1 (CLDN1) and zonula occludens protein-1 (ZO-1) colocalize and interact in oxygen-glucose deprivation (OGD)/specific miR-155 inhibitor (OGD/I) cells. Double immunofluorescence staining of OGD /I cells with anti-CLDN1 (A) and anti- ZO -1 (B) antibodies. C and D, Colocalization maps automatically generated using Fiji software demonstrate colocalization (yellow) and no colocalization (red pixels) of 2 channels in the cells (C); enlarged details in (D) depict the degree of colocalization on the cell borders. Bar: 10 mum. E, Orthogonal projection of human primary brain microvascular endothelial cells from the OGD /I group, coimmunostained with anti-CLDN1 (green) and anti- ZO -1 (red) antibodies. 4',6-Diamidino-2-phenylindole staining was used to visualize nuclei (blue). Imaging was performed with a Zeiss LSM 800 confocal microscope using tile scan and Z stack image acquisitions. F, Cell lysates from the OGD /I and OGD /control inhibitor (OGD/IC) groups (L- OGD /I and L- OGD / IC ) were immunoprecipitated with anti- ZO -1 antibody. Immunoprecipitates ( IP - OGD /I and IP - OGD / IC ) were probed with antibodies against ZO -1, CLDN1, actin, phosphotyrosine ( pT yr), and phosphoserine ( pS er). G through I, OGD -subjected cells were transfected with CLDN 1 cDNA -containing vector ( OGD + CLDN 1) or empty vector ( OGD + EV ). G, expression of ZO -1 and CLDN1 was detected in OGD + CLDN 1 (lane 1), normoxic control ( NC ; lane 2), and OGD + EV (lane 3) samples. Actin wa
- Conjugate
- Green dye