 Explore
 Validate
 Learn
Learn Western blot
Antibody data
- Antibody Data
- Antigen structure
- References [4]
- Comments [0]
- Validations
- Western blot [1]
- Immunocytochemistry [1]
- Flow cytometry [1]
- Other assay [3]
Submit
Validation data
Reference
Comment
Report error
- Product number
- PA1-1057 - Provider product page

- Provider
- Invitrogen Antibodies
- Product name
- IRS1 Polyclonal Antibody
- Antibody type
- Polyclonal
- Antigen
- Synthetic peptide
- Description
- PA1-1057 detects IRS-1 in mouse and human cells.
- Concentration
- 1 mg/mL
Submitted references Role of Exendin-4 in Brain Insulin Resistance, Mitochondrial Function, and Neurite Outgrowth in Neurons under Palmitic Acid-Induced Oxidative Stress.
Chronic restraint stress induces hippocampal memory deficits by impairing insulin signaling.
Enhanced gastrointestinal expression of cytosolic malic enzyme (ME1) induces intestinal and liver lipogenic gene expression and intestinal cell proliferation in mice.
The hyperglycemia-induced inflammatory response in adipocytes: the role of reactive oxygen species.
Jo D, Yoon G, Song J
Antioxidants (Basel, Switzerland) 2021 Jan 9;10(1)
Antioxidants (Basel, Switzerland) 2021 Jan 9;10(1)
Chronic restraint stress induces hippocampal memory deficits by impairing insulin signaling.
Woo H, Hong CJ, Jung S, Choe S, Yu SW
Molecular brain 2018 Jul 3;11(1):37
Molecular brain 2018 Jul 3;11(1):37
Enhanced gastrointestinal expression of cytosolic malic enzyme (ME1) induces intestinal and liver lipogenic gene expression and intestinal cell proliferation in mice.
Al-Dwairi A, Brown AR, Pabona JM, Van TH, Hamdan H, Mercado CP, Quick CM, Wight PA, Simmen RC, Simmen FA
PloS one 2014;9(11):e113058
PloS one 2014;9(11):e113058
The hyperglycemia-induced inflammatory response in adipocytes: the role of reactive oxygen species.
Lin Y, Berg AH, Iyengar P, Lam TK, Giacca A, Combs TP, Rajala MW, Du X, Rollman B, Li W, Hawkins M, Barzilai N, Rhodes CJ, Fantus IG, Brownlee M, Scherer PE
The Journal of biological chemistry 2005 Feb 11;280(6):4617-26
The Journal of biological chemistry 2005 Feb 11;280(6):4617-26
No comments: Submit comment
Supportive validation
- Submitted by
- Invitrogen Antibodies (provider)
- Main image
- Experimental details
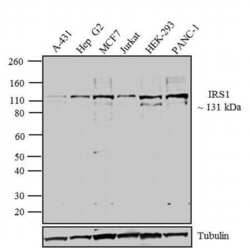
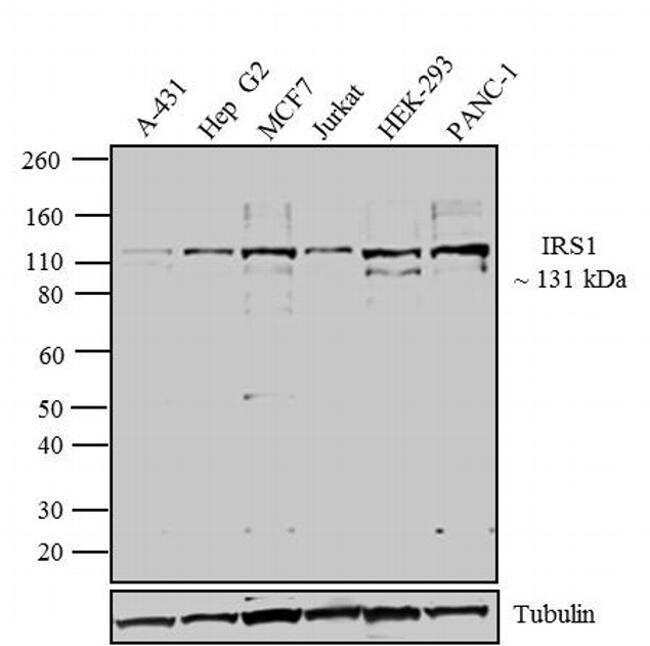
- Western blot analysis was performed on whole cell extracts (30 µg lysate) of A-431 (Lane 1), Hep G2 (Lane 2), MCF7 (Lane 3), Jurkat (lane 4), HEK-293 (lane 5) and Panc-1 (lane 6). The blots were probed with Anti-IRS1 Rabbit Polyclonal Antibody (Product # PA1-1057, 1:250 dilution) and detected by chemiluminescence using Goat anti-Rabbit IgG (H+L) Superclonal™ Secondary Antibody, HRP conjugate (Product # A27036, 0.4 µg/mL, 1:2500 dilution). A 131 kDa band corresponding to IRS1 was observed across cell lines tested. Known quantity of protein samples were electrophoresed using Novex® NuPAGE® 4-12 % Bis-Tris gel (Product # NP0321BOX), XCell SureLock™ Electrophoresis System (Product # EI0002) and Novex® Sharp Pre-Stained Protein Standard (Product # LC5800). Resolved proteins were then transferred onto a nitrocellulose membrane with iBlot® 2 Dry Blotting System (Product # IB21001). The membrane was probed with the relevant primary and secondary Antibody following blocking with 5 % skimmed milk. Chemiluminescent detection was performed using Pierce™ ECL Western Blotting Substrate (Product # 32106).
Supportive validation
- Submitted by
- Invitrogen Antibodies (provider)
- Main image
- Experimental details
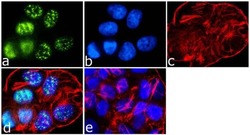
- Immunofluorescence analysis of IRS1 was done on 70% confluent log phase T-47D cells. The cells were fixed with 4% paraformaldehyde for 15 minutes, permeabilized with 0.25% Triton™ X-100 for 10 minutes, and blocked with 5% BSA for 1 hour at room temperature. The cells were labeled with IRS1 Rabbit Polyclonal Antibody (Product # PA1-1057) at 1:250 dilution in 1% BSA and incubated for 3 hours at room temperature and then labeled with Goat anti-Rabbit IgG (H+L) Superclonal™ Secondary Antibody, Alexa Fluor® 488 conjugate (Product # A27034) at a dilution of 1:2000 for 45 minutes at room temperature (Panel a: green). Nuclei (Panel b: blue) were stained with SlowFade® Gold Antifade Mountant with DAPI (Product # S36938). F-actin (Panel c: red) was stained with Rhodamine Phalloidin (Product # R415, 1:300). Panel d is a merged image showing Nuclear localization. Panel e is a no primary antibody control. The images were captured at 60X magnification.

Supportive validation
- Submitted by
- Invitrogen Antibodies (provider)
- Main image
- Experimental details
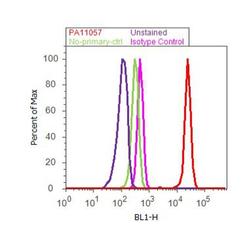
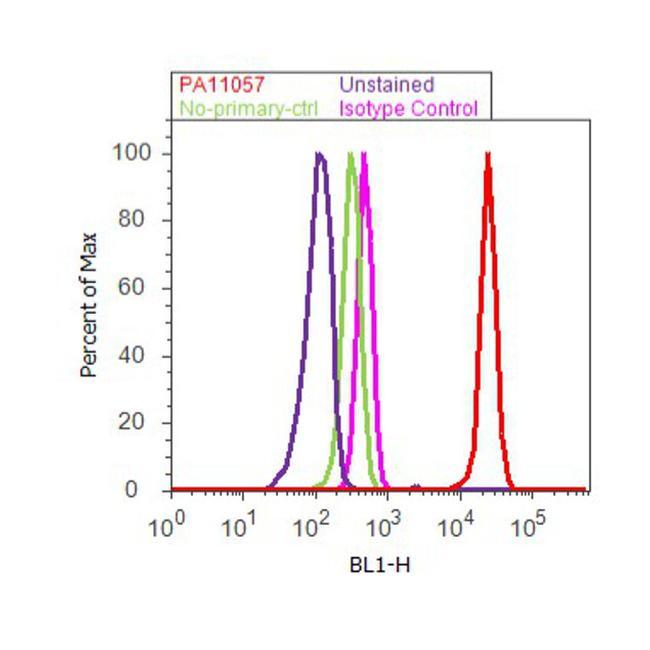
- Flow cytometry analysis of IRS1 was done on MCF7 cells. Cells were fixed with 70% ethanol for 10 minutes, permeabilized with 0.25% Triton™ X-100 for 20 minutes, and blocked with 5% BSA for 30 minutes at room temperature. Cells were labeled with IRS1 Rabbit Polyclonal Antibody (PA11057, red histogram) or with rabbit isotype control (pink histogram) at 3-5 ug/million cells in 2.5% BSA. After incubation at room temperature for 2 hours, the cells were labeled with Alexa Fluor® 488 Goat Anti-Rabbit Secondary Antibody (A11008) at a dilution of 1:400 for 30 minutes at room temperature. The representative 10,000 cells were acquired and analyzed for each sample using an Attune® Acoustic Focusing Cytometer. The purple histogram represents unstained control cells and the green histogram represents no-primary-antibody control.
Supportive validation
- Submitted by
- Invitrogen Antibodies (provider)
- Main image
- Experimental details
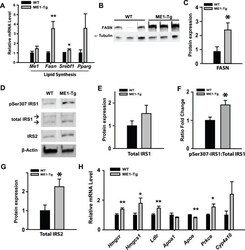
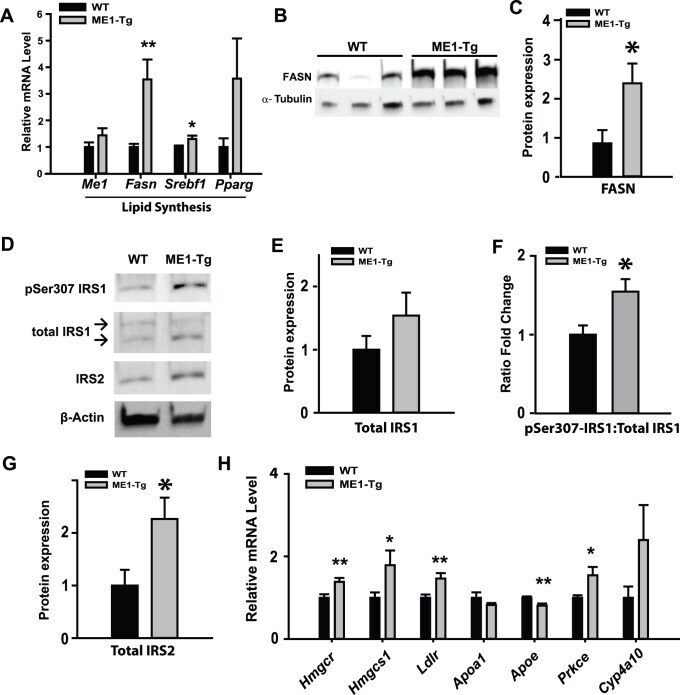
- Figure 5 Expression of lipogenic pathway and cholesterol synthesis pathway genes in livers of WT and ME1-Tg mice fed HF diet. A) qRT-PCR analysis of major lipogenic pathway genes in livers of WT and ME1-Tg mice fed HF diet (Exp. 2; n = 8-9/group). B) Western blot of FASN protein in livers of WT and ME1-Tg mice fed HF diet. C) Densitometric analysis of immunoreactive bands in (B) relative to alpha-Tubulin protein. D) Western blot of IRS1, pSer307-IRS1, and IRS2 in livers of WT and ME1-Tg mice fed HF diet (n = 5/group). E-G) Densitometric analysis of immunoreactive bands of total liver IRS1 (E) and IRS2 (G) and the relative ratio of immunoreactive pSer307-IRS1/total IRS1 band densities (F). H) mRNA expression of select cholesterol synthesis- and cholesterol uptake-related genes in the livers of WT and ME1-Tg mice (Exp. 2; n = 8-9/group). qRT-PCR reactions were repeated twice in all experiments (A, H). Bar graphs represent mean +- SEM. Significant differences at * P
- Submitted by
- Invitrogen Antibodies (provider)
- Main image
- Experimental details
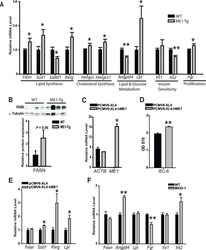
- Figure 4 Enhanced intestinal ME1 expression with HF diet induces jejunum lipogenic- and proliferation-associated gene expression. A) Relative expression of jejunum genes of WT and ME1-Tg mice [Exp. 2 (n = 7-9/group)]. B) Western blot and corresponding band densitometry analysis of FASN in the jejunum of WT and ME1-Tg mice (Exp. 2). C-E) Effects of ME1 over-expression on intestinal epithelial cell proliferation and gene expression in vitro . Rat intestinal epithelial cells (IEC-6) were transfected with control or hME1 expression vectors; overexpression of human ME1 mRNA, but not beta-actin mRNA, was observed by RT-PCR (C). At 48 h, cells were evaluated for proliferation by MTT assay (D), and at 96 h (E) evaluated for expression of Fasn , Scd1 , Rxrg and Lpl genes (n = 3 replicates/group). F) Gene expression of Fasn , Angptl4 , Lpl , Fgr , Irs1 and Irs2 in jejunums of WT and MOD-1 mice fed HF diet (n = 5/group). RT-PCR was repeated twice in all experiments, and MTT proliferation assay was repeated thrice. Bar graphs represent mean +- SEM. Significant differences at * P

- Submitted by
- Invitrogen Antibodies (provider)
- Main image
- Experimental details
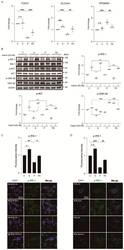
- Figure 2 Exendin-4 improves insulin signaling in a neuron under palmitic acid-induced oxidative stress. ( A ) Comparison of mRNA expression levels of insulin signaling related genes ( FOXO1 , SLC2A4 , and RPS6KB1 ) in SH-SY5Y cells treated with vehicle (C or Ctr), Exendin-4 (E or Ex-4), palmitic acid (P or PA), and both palmitic acid and Exendin-4 (PE or PA+Ex-4). The mRNA level of each gene is normalized to GAPDH level. ( B ) Western blot of insulin signaling through 20 nM insulin stimulation for 10 min in SH-SY5Y cells treated with reagents described in A. Each protein level is normalized to beta-actin. The pIRS-1, pAKT, and pGSK-3beta levels were normalized to IRS-1, AKT, and GSK-3beta of total form. ( C , D ) immunocytochemistry images of pIRS-1 expression in SH-SY5Y cells and PCN neurons at DIV 7 treated with reagents described in A. Nuclei were counterstained with DAPI (blue) and insulin receptor stained with pIRS-1 (green), >100 ( E ) and >50 ( F ) cells per group were analyzed. Scale bar: 50 mum. Data information: SH-SY5Y cells were treated with 10 nM of Exendin-4 and 50 muM of palmitic acid per group according to the treatment plan ( Figure S1B,C ). In ( A - D ), error bars represent S.E.M. from three independent experiments. n.s p > 0.05, * p < 0.05, ** p < 0.01, *** p < 0.001 (unpaired two-tail t -tests with Welch's correction).
