 Explore
 Validate
 Learn
Learn Flow cytometry
Antibody data
- Antibody Data
- Antigen structure
- References [2]
- Comments [0]
- Validations
- Flow cytometry [1]
- Other assay [1]
Submit
Validation data
Reference
Comment
Report error
- Product number
- A15464 - Provider product page

- Provider
- Invitrogen Antibodies
- Product name
- LAMP2 Monoclonal Antibody (H4B4), Alexa Fluor™ 647
- Antibody type
- Monoclonal
- Antigen
- Other
- Reactivity
- Human
- Host
- Mouse
- Conjugate
- Red dye
- Isotype
- IgG
- Antibody clone number
- H4B4
- Vial size
- 100 µg
- Concentration
- 0.1 mg/mL
- Storage
- 4° C, store in dark
Submitted references Connexin 43 maintains tissue polarity and regulates mitotic spindle orientation in the breast epithelium.
BAD-LAMP controls TLR9 trafficking and signalling in human plasmacytoid dendritic cells.
Bazzoun D, Adissu HA, Wang L, Urazaev A, Tenvooren I, Fostok SF, Chittiboyina S, Sturgis J, Hodges K, Chandramouly G, Vidi PA, Talhouk RS, Lelièvre SA
Journal of cell science 2019 May 16;132(10)
Journal of cell science 2019 May 16;132(10)
BAD-LAMP controls TLR9 trafficking and signalling in human plasmacytoid dendritic cells.
Combes A, Camosseto V, N'Guessan P, Argüello RJ, Mussard J, Caux C, Bendriss-Vermare N, Pierre P, Gatti E
Nature communications 2017 Oct 13;8(1):913
Nature communications 2017 Oct 13;8(1):913
No comments: Submit comment
Supportive validation
- Submitted by
- Invitrogen Antibodies (provider)
- Main image
- Experimental details
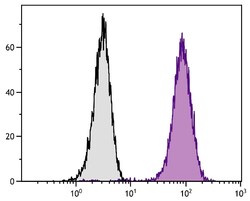
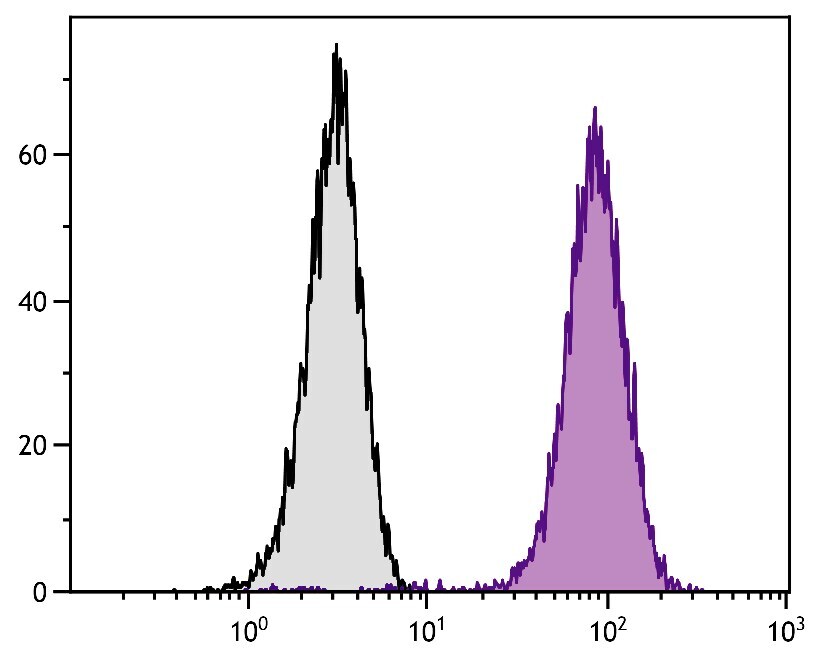
- Flow cytometry analysis of LAMP2 in human T cell leukemia cell line Jurkat. Cells were stained using LAMP2 Monoclonal Antibody (H4B4), Alexa Fluor™ 647 (Product # A15464).
- Conjugate
- Red dye
Supportive validation
- Submitted by
- Invitrogen Antibodies (provider)
- Main image
- Experimental details
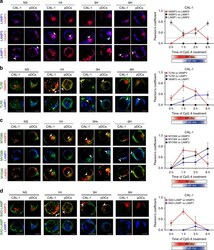
- Fig. 4 Upon activation TLR9 and BAD-LAMP are addressed to specialized endosomes. a - d ( left ) Immunofluorescence confocal microscopy (ICM) on CAL-1 or freshly isolated pDCs stimulated with CpG-A for indicated times and stained of ( a ) LAMP1, LAMP2 and VAMP3; ( b ) TLR9, VAMP3 and LAMP1; ( c ) MYD88, LAMP1, LAMP2 and VAMP3; ( d ) BAD-LAMP, VAMP3 and LAMP1. Pictures are representative of at least three independent experiments. Arrows indicate co-localisation areas. Scale bars = 5 muM. ( right ) a - d Quantification of the co-localisation between the different proteins across time was performed by Pearson's coefficient measurement using ImageJ. Graphics represent Pearson's coefficient means of 50 different cells +- s.d. from at least three independent experiments, significance of pixel correlation is only considered above a PCM of 0.5. The bimodal regulation of TLR9 signalling is represented with a shading red rectangle for its IRF7-dependent phase and blue for its NF-kappaB-dependent phase
- Conjugate
- Red dye
