Explore
 Validate
 Learn
Learn Western blot
 Immunohistochemistry
Antibody data
- Antibody Data
- Antigen structure
- References [2]
- Comments [0]
- Validations
- Western blot [1]
- Other assay [6]
Submit
Validation data
Reference
Comment
Report error
- Product number
- PA1-18360 - Provider product page

- Provider
- Invitrogen Antibodies
- Product name
- proBDNF Polyclonal Antibody
- Antibody type
- Polyclonal
- Antigen
- Synthetic peptide
- Description
- Reconstitute in 100 µL of sterile water. Centrifuge to remove any insoluble material. After reconstitution keep aliquots at -20 °C for a higher stability, and at 4 °C with an appropriate antibacterial agent. Glycerol (1:1) may be added for an additional stability. Avoid repetitive freeze/thaw cycles.
- Reactivity
- Human, Mouse, Rat
- Host
- Rabbit
- Isotype
- IgG
- Vial size
- 100 µL
- Concentration
- Conc. Not Determined
- Storage
- -20° C, Avoid Freeze/Thaw Cycles
Submitted references Perfluoroalkyl Substance Exposure and the BDNF Pathway in the Placental Trophoblast.
Ibogaine Administration Modifies GDNF and BDNF Expression in Brain Regions Involved in Mesocorticolimbic and Nigral Dopaminergic Circuits.
Marchese MJ, Li S, Liu B, Zhang JJ, Feng L
Frontiers in endocrinology 2021;12:694885
Frontiers in endocrinology 2021;12:694885
Ibogaine Administration Modifies GDNF and BDNF Expression in Brain Regions Involved in Mesocorticolimbic and Nigral Dopaminergic Circuits.
Marton S, González B, Rodríguez-Bottero S, Miquel E, Martínez-Palma L, Pazos M, Prieto JP, Rodríguez P, Sames D, Seoane G, Scorza C, Cassina P, Carrera I
Frontiers in pharmacology 2019;10:193
Frontiers in pharmacology 2019;10:193
No comments: Submit comment
Supportive validation
- Submitted by
- Invitrogen Antibodies (provider)
- Main image
- Experimental details
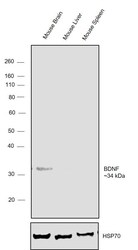
- Western blot was performed using Anti-proBDNF Polyclonal Antibody (Product # PA1-18360) and a 34 kDa band corresponding to Brain-derived neurotrophic factor was observed in mouse brain in comparison to mouse liver and spleen which are reported to be negative expressors of BDNF. Tissue extracts (30 µg lysate) of Mouse Brain (Lane 1), Mouse Liver (Lane 2) and Mouse Spleen (Lane 3) were electrophoresed using NuPAGE™ 4-12% Bis-Tris Protein Gel (Product # NP0321BOX). Resolved proteins were then transferred onto a nitrocellulose membrane (Product # IB23001) by iBlot® 2 Dry Blotting System (Product # IB21001). The blot was probed with the primary antibody (1:1000 dilution) and detected by chemiluminescence with Goat anti-Rabbit IgG (H+L) Superclonal™ Recombinant Secondary Antibody, HRP (Product # A27036,1:4000 dilution using the iBright™ FL1500 Imaging System (Product # A44115). Chemiluminescent detection was performed using Novex® ECL Chemiluminescent Substrate Reagent Kit (Product # WP20005).

Supportive validation
- Submitted by
- Invitrogen Antibodies (provider)
- Main image
- Experimental details
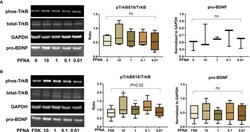
- Figure 3 Altered TrkB phosphorylation at high concentrations of PFNA. (A) Representative Western blot images of phos-TrkB, total-TrkB, GAPDH, and pro-BDNF in BeWo cells without forskolin (FSK) treatment exposed to PFNA (0, 0.01, 0.1, 1, and 10 uM) and box plots for densitometry analysis; (B) Representative Western blot images of phos-TrkB, total-TrkB, GAPDH, and pro-BDNF in BeWo cells with FSK treatment exposed to PFNA (0, 0.01, 0.1, 1, and 10 uM) and box plots for densitometry analysis. ns indicates differences in protein levels were not significant. pTrkB816 represents for phosphorylation of TrkB at Tyr816 residue. *P < 0.05 **P < 0.01 compared to unexposed forskolin-treated cells.

- Submitted by
- Invitrogen Antibodies (provider)
- Main image
- Experimental details
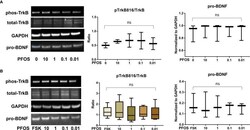
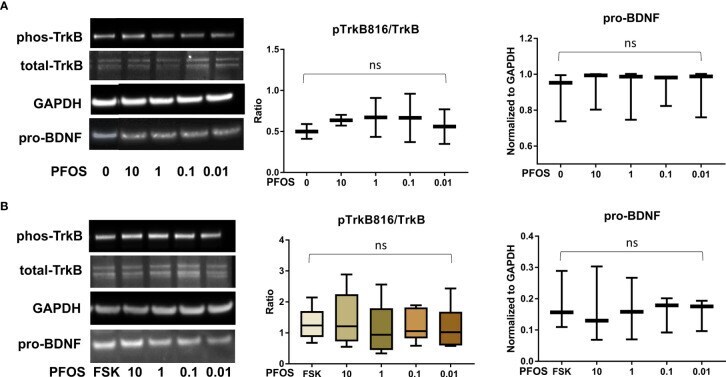
- Figure 4 PFOS exposure did not significantly disrupt the BDNF-TrkB pathway. (A) Representative Western blot images of phos-TrkB, total-TrkB, GAPDH, and pro-BDNF in BeWo cells without forskolin (FSK) treatment exposed to PFOS (0, 0.01, 0.1, 1, and 10 uM) and box plots for densitometry analysis; (B) Representative Western blot images of phos-TrkB, total-TrkB, GAPDH, and pro-BDNF in BeWo cells with FSK treatment exposed to PFOS (0, 0.01, 0.1, 1, and 10 uM) and box plots for densitometry analysis. ns indicates differences in protein levels were not significant. pTrkB816 represents for phosphorylation of TrkB at Tyr816 residue.
- Submitted by
- Invitrogen Antibodies (provider)
- Main image
- Experimental details
- Figure 5 PFBS exposure did not significantly disrupt the BDNF-TrkB pathway. (A) Representative Western blot images of phos-TrkB, total-TrkB, GAPDH, and pro-BDNF in BeWo cells without forskolin (FSK) treatment exposed to PFBS (0, 0.01, 0.1, 1, and 10 uM) and box plots for densitometry analysis; (B) Representative Western blot images of phos-TrkB, total-TrkB, GAPDH, and pro-BDNF in BeWo cells with FSK treatment exposed to PFBS (0, 0.01, 0.1, 1, and 10 uM) and box plots for densitometry analysis. ns indicates differences in protein levels were not significant. pTrkB816 represents for phosphorylation of TrkB at Tyr816 residue.

- Submitted by
- Invitrogen Antibodies (provider)
- Main image
- Experimental details
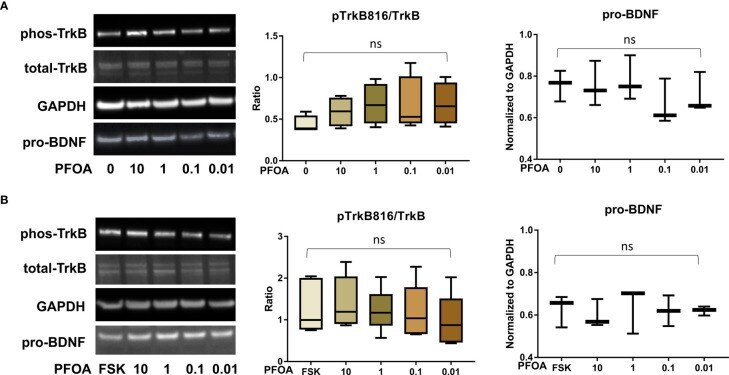
- Figure 6 PFOA exposure did not significantly disrupt the BDNF-TrkB pathway. (A) Representative Western blot images of phos-TrkB, total-TrkB, GAPDH, and pro-BDNF in BeWo cells without forskolin (FSK) treatment exposed to PFOA (0, 0.01, 0.1, 1, and 10 uM) and box plots for densitometry analysis; (B) Representative Western blot images of phos-TrkB, total-TrkB, GAPDH, and pro-BDNF in BeWo cells with FSK treatment exposed to PFOA (0, 0.01, 0.1, 1, and 10 uM) and box plots for densitometry analysis. ns indicates differences in protein levels were not significant. pTrkB816 represents for phosphorylation of TrkB at Tyr816 residue.
- Submitted by
- Invitrogen Antibodies (provider)
- Main image
- Experimental details
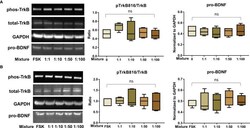
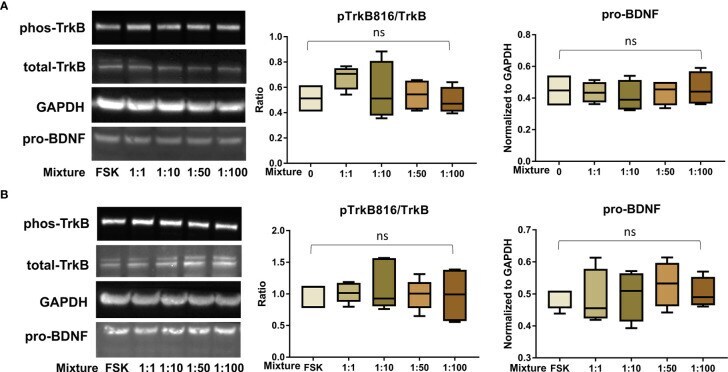
- Figure 7 PFAS mixture exposure (detailed in Table 1 ) did not significantly disrupt the BDNF-TrkB pathway. (A) Representative Western blot images of phos-TrkB, total-TrkB, GAPDH, and pro-BDNF in BeWo cells without forskolin (FSK) treatment exposed to mixture dilutions (0, 1:1, 1:10, 1:50, 1:100) and box plots for densitometry analysis; (B) Representative Western blot images of phos-TrkB, total-TrkB, GAPDH, and pro-BDNF in BeWo cells with FSK treatment exposed to mixture dilutions (0, 1:1, 1:10, 1:50, 1:100) and box plots for densitometry analysis. ns indicates differences in protein levels were not significant. pTrkB816 represents for phosphorylation of TrkB at Tyr816 residue.
- Submitted by
- Invitrogen Antibodies (provider)
- Main image
- Experimental details
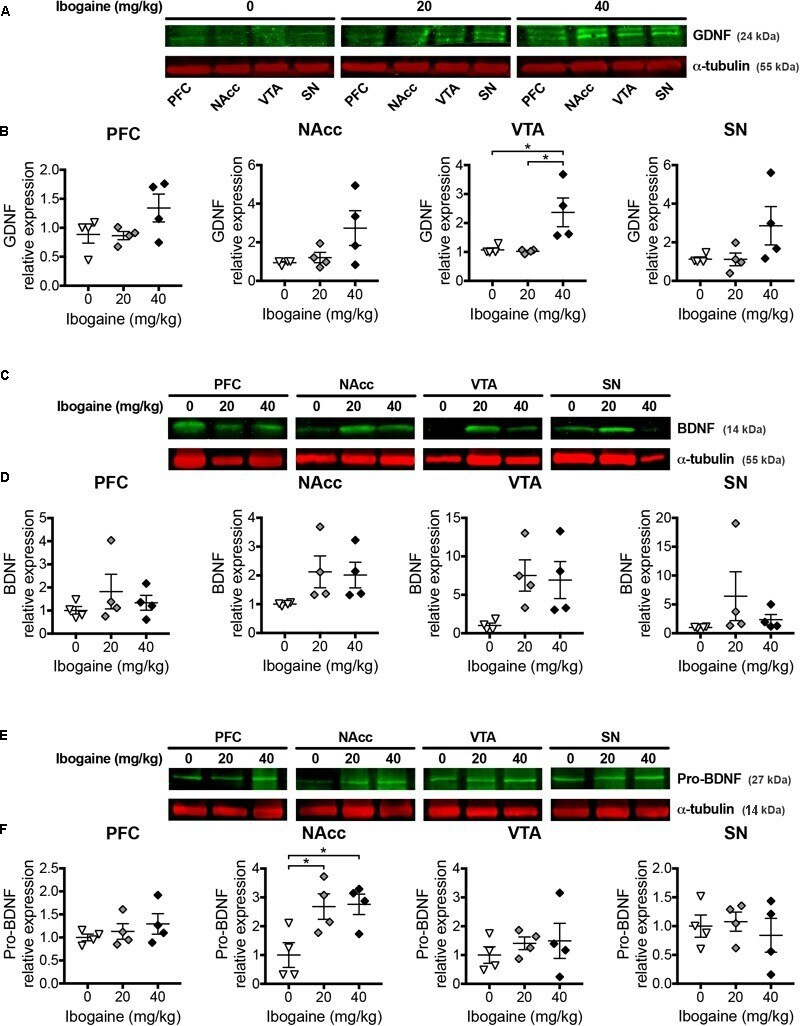
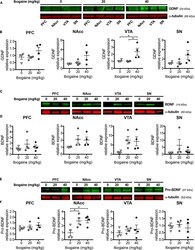
- FIGURE 6 Effects of ibogaine administration on GDNF, BDNF, and proBDNF protein levels in specific brain areas. Western blot analysis of GDNF (A,B) , BDNF (C,D) and proBDNF (E,F) protein levels in the indicated brain areas after 24 h of vehicle (0), 20, or 40 mg/kg ibogaine administration. A representative image from immunostained membrane of each condition is shown (A,C,E) with the corresponding quantification below (B,D,F) . Data represent mean +- SEM of n = 4 biological replicates assayed in triplicate. For GDNF/VTA, N = 12, P < 0.05, F 2,9 = 6.86, eta 2 = 0.60; For proBDNF/NAcc, N = 12, P < 0.05, F 2,9 = 5.87, eta 2 = 0.57; * P < 0.05 between indicated groups.