 Explore
 Validate
 Learn
Learn Western blot
Antibody data
- Antibody Data
- Antigen structure
- References [2]
- Comments [0]
- Validations
- Western blot [4]
- Immunocytochemistry [2]
- Flow cytometry [1]
- Other assay [4]
Submit
Validation data
Reference
Comment
Report error
- Product number
- 701379 - Provider product page

- Provider
- Invitrogen Antibodies
- Product name
- CD56 Recombinant Rabbit Monoclonal Antibody (3H15L12)
- Antibody type
- Monoclonal
- Antigen
- Recombinant full-length protein
- Description
- This antibody is predicted to react with bovine, canine, chimpanzee, feline, non-human primate and rabbit based on sequence homology.
- Antibody clone number
- 3H15L12
- Concentration
- 0.5 mg/mL
Submitted references NCAM regulates temporal specification of neural progenitor cells via profilin2 during corticogenesis.
HDAC1 and HDAC3 underlie dynamic H3K9 acetylation during embryonic neurogenesis and in schizophrenia-like animals.
Huang R, Yuan DJ, Li S, Liang XS, Gao Y, Lan XY, Qin HM, Ma YF, Xu GY, Schachner M, Sytnyk V, Boltze J, Ma QH, Li S
The Journal of cell biology 2020 Jan 6;219(1)
The Journal of cell biology 2020 Jan 6;219(1)
HDAC1 and HDAC3 underlie dynamic H3K9 acetylation during embryonic neurogenesis and in schizophrenia-like animals.
Večeřa J, Bártová E, Krejčí J, Legartová S, Komůrková D, Rudá-Kučerová J, Štark T, Dražanová E, Kašpárek T, Šulcová A, Dekker FJ, Szymanski W, Seiser C, Weitzer G, Mechoulam R, Micale V, Kozubek S
Journal of cellular physiology 2018 Jan;233(1):530-548
Journal of cellular physiology 2018 Jan;233(1):530-548
No comments: Submit comment
Supportive validation
- Submitted by
- Invitrogen Antibodies (provider)
- Main image
- Experimental details
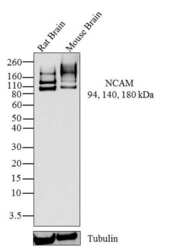
- Western blot analysis of NCAM was performed by loading 30 µg of Rat Brain (lane1) and Mouse Brain (lane2) lysates using Novex®NuPAGE®4-12% Bis-Tris gel (Product # NP0321BOX), XCell SureLock Electrophoresis System (Product # EI0002), Novex® Sharp Pre-Stained Protein Standard (Product # LC5800). Proteins were transferred to a PVDF membrane and blocked with 5% skim milk for 1 hour at room temperature. NCAM was detected at ~94, 140 and 180 kDa using NCAM Recombinant Rabbit Monoclonal Antibody (Product # 701379) at 0.5-1 µg/mL in 2.5% skim milk at 4°C overnight on a rocking platform. Goat anti-Rabbit IgG - HRP Secondary Antibody (Product # G-21234) at 1:5000 dilution was used and chemiluminescent detection was performed using Pierce™ ECL Western blotting Substrate (Product # 32106).

- Submitted by
- Invitrogen Antibodies (provider)
- Main image

- Experimental details
- Western blot was performed using Anti-CD56 Recombinant Rabbit Monoclonal Antibody (3H15L12) (Product # 701379) and a 150 kDa band corresponding to CD56 was observed in SH-SY5Y. Membrane enriched cell extracts (12.5 µg lysate) of SH-SY5Y-Untreated (Lane 1), SH-SY5Y-Control (50°C, 3 hrs) (Lane 2) and SH-SY5Y-Treated (500 U PNGaseF; 50°C, 3 hr) (Lane 3) were electrophoresed using NuPAGE™ 4-12% Bis-Tris Protein Gel (Product # NP0321BOX). Resolved proteins were transferred onto a Nitrocellulose membrane (Product # IB23001) by iBlot® 2 Dry Blotting System (Product # IB21001). The blot was probed with the primary antibody (1 µg/mL) and detected by chemiluminescence with Goat anti-Rabbit IgG (H+L) Superclonal™ Recombinant Secondary Antibody, HRP (Product # A27036, 1:20,000 dilution) using the iBright FL1500 (Product # A44115). Chemiluminescent detection was performed using SuperSignal™ West Dura Extended Duration Substrate (Product # 34076). CD56 migrates at ~150 kDa due to multiple glycosylations (Lane 1). To carry out deglycosylation of the protein, PNGase F Glycan Cleavage Kit was used (Product # A39245). Upon PNGaseF treatment, N-linked glycosylations are cleaved and deglycosylated CD56 can be seen at ~120 kDa (Lane 3). This mass shift can be attributed to deglycosylation as the control sample migrates at ~150 kDa (Lane 2).

- Submitted by
- Invitrogen Antibodies (provider)
- Main image
- Experimental details
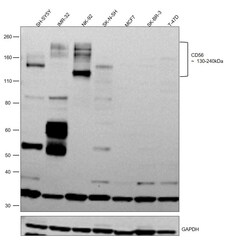
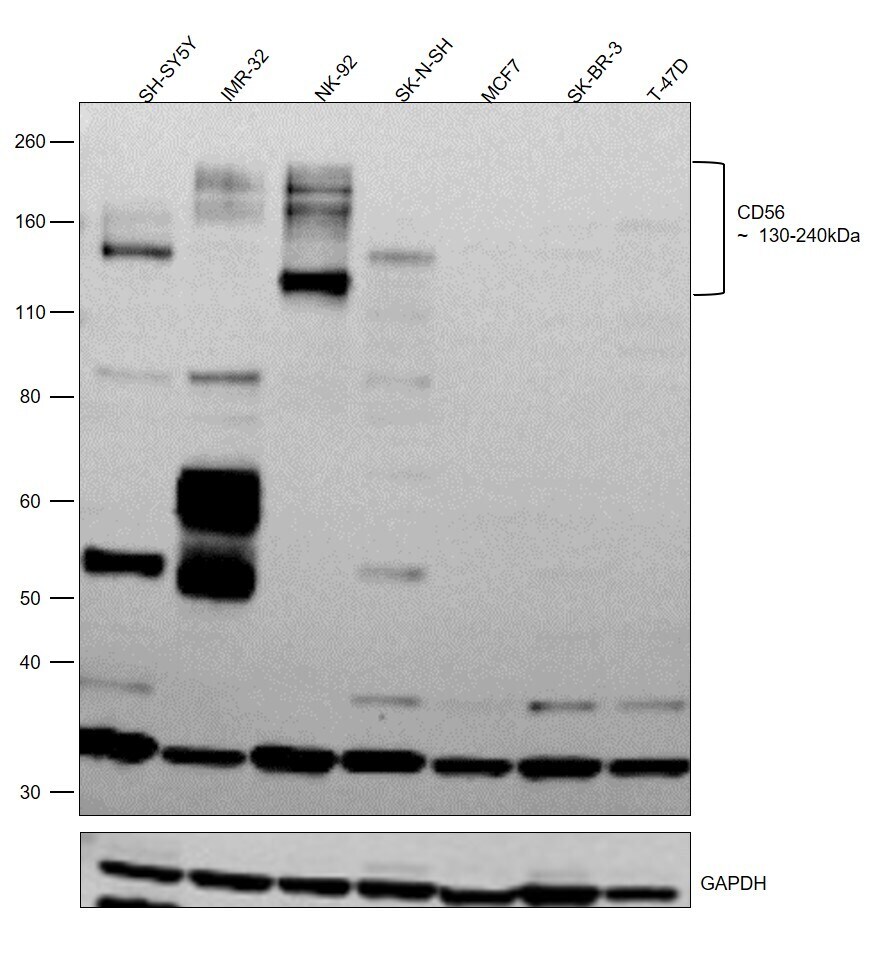
- Western blot was performed using Anti-CD56 Recombinant Rabbit Monoclonal Antibody (3H15L12) (Product # 701379) and bands in the range of 130-240kDa corresponding to Neural cell adhesion molecule 1 were observed. Membrane enriched extracts (30 µg lysate) of SH-SY5Y (Lane 1), IMR-32 (Lane 2), NK-92 (Lane 3), SK-N-SH (Lane 4), MCF7 (Lane 5), SK-BR-3 (Lane 6) and T-47D (Lane 7) were electrophoresed using NuPAGE™ 4-12% Bis-Tris Protein Gel (Product # NP0322BOX). Resolved proteins were then transferred onto a nitrocellulose membrane (Product # IB23001) by iBlot® 2 Dry Blotting System (Product # IB21001). The blot was probed with the primary antibody (1 ug/ml) and detected by chemiluminescence with Goat anti-Rabbit IgG (H+L) Superclonal™ Recombinant Secondary Antibody, HRP (Product # A27036,1:20,000 using the iBright™ FL1500 Imaging System (Product # A44115). Chemiluminescent detection was performed using SuperSignal™ West Pico PLUS Chemiluminescent Substrate (Product # 34580). Relative expression was observed between SH-SY5Y, IMR-32, NK-92, SK-N-SH and breast cancer cell lines such as MCF7, SK-BR-3 and T-47D as expected (DOI: 10.1038/s41598-019-45377-8).
- Submitted by
- Invitrogen Antibodies (provider)
- Main image

- Experimental details
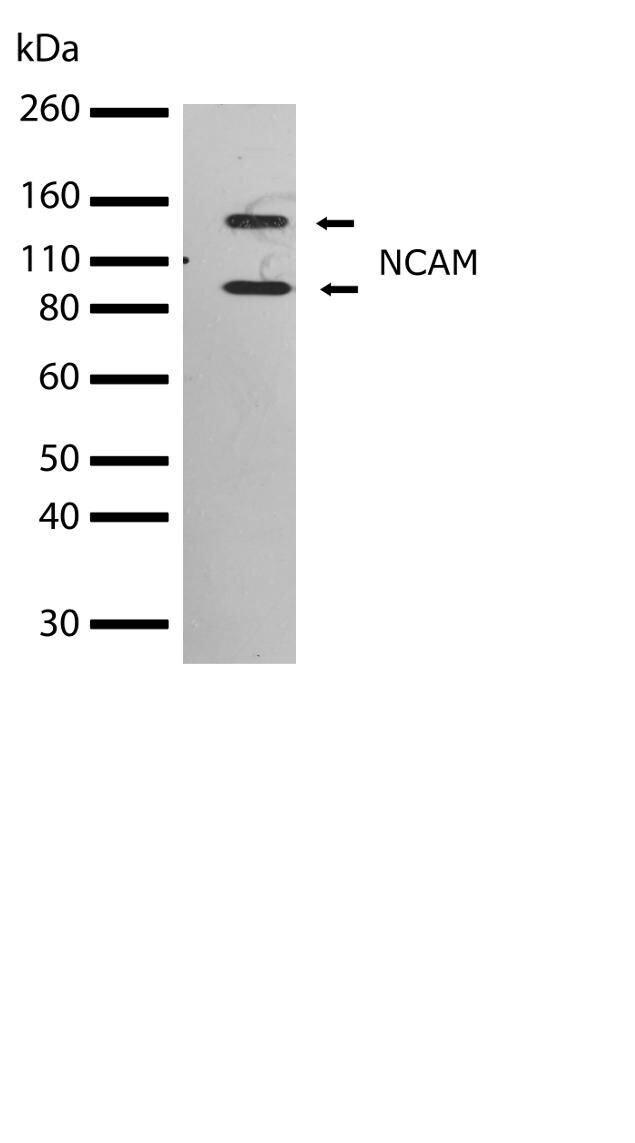
- Western blot analysis of NCAM in whole tissue extracts from rat brain using a NCAM recombinant rabbit monoclonal antibody (Product # 701379) at a dilution of 2 µg/mL. Samples were detected using chemiluminescence (ECL). Results show a band at ~94kDa.
Supportive validation
- Submitted by
- Invitrogen Antibodies (provider)
- Main image
- Experimental details
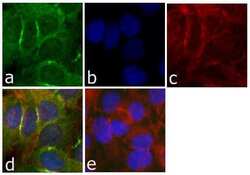
- Immunofluorescent analysis of NCAM was done on 80% confluent log phase HeLa cells. The cells were fixed with 4% paraformaldehyde for 15 minutes; permeabilized with 0.25% Triton X-100 for 10 minutes followed by blocking with 5% BSA for 1 hour at room temperature. The cells were incubated with NCAM Recombinant Rabbit Monoclonal Antibody (Product # 701379) at 1 µg\mL in 1% BSA and incubated for 3 hours at room temperature and then labeled with Alexa Fluor 488 Goat anti-Rabbit IgG Secondary Antibody (Product # A-11008) at a dilution of 1:400 for 30 minutes at room temperature (Panel a: green). Nuclei (Panel b: blue) were stained with SlowFade Gold Antifade Mountant with DAPI (Product # S36938). F-actin (Panel c: red) was stained with Alexa Fluor 594 Phalloidin (Product # A12381). Panel d is a merged image showing cytoplasmic and membrane localization of NCAM. Panel e shows no primary antibody. The images were captured at 20X magnification.

- Submitted by
- Invitrogen Antibodies (provider)
- Main image
- Experimental details
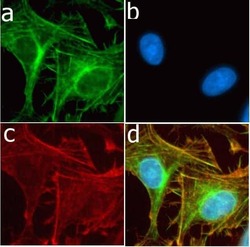
- Immunofluorescent analysis of NCAM in U2OS cells using a NCAM recombinant rabbit monoclonal antibody (Product # 701379) followed by detection using an Alexa Fluor 488-conjugated goat anti-rabbit secondary antibody (green) (Image A). Nuclei were stained using DAPI (Image B) and actin stained with Alexa Fluor 594 phalloidin (red) (image C). Image D is a composite image showing cytoplasmic localization of NCAM.

Supportive validation
- Submitted by
- Invitrogen Antibodies (provider)
- Main image
- Experimental details
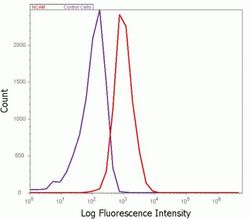
- Flow cytometry analysis of NCAM in K562 cells using a NCAM recombinant rabbit monoclonal antibody (Product # 701379). Cells were fixed and permeabilized using FIX & PERM (Product # GAS004) reagent, and detection was performed using an Alexa Fluor 488 goat anti-rabbit IgG (right peak) compared to an isotype control (left peak).

Supportive validation
- Submitted by
- Invitrogen Antibodies (provider)
- Main image
- Experimental details
- NULL
- Submitted by
- Invitrogen Antibodies (provider)
- Main image

- Experimental details
- NULL
- Submitted by
- Invitrogen Antibodies (provider)
- Main image

- Experimental details
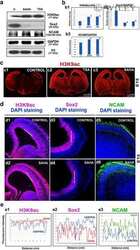
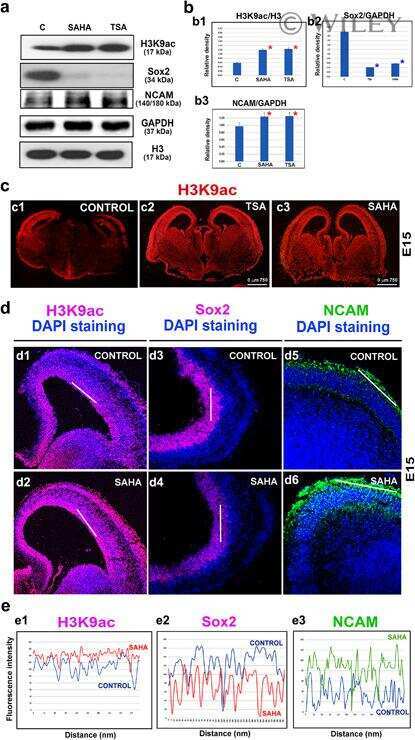
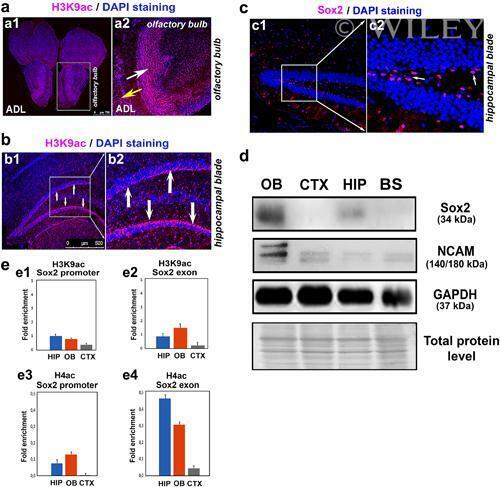
- H3K9 acetylation in the olfactory bulbs and hippocampal regions of adult mice. (a) H3K9 acetylation in (a1) an entire adult brain section and (a2) the olfactory bulb in an adult brain. The white arrow indicates the granular layer, and the yellow arrow indicates the glomerular layer of the adult olfactory bulb. (b) H3K9 acetylation (pink) in (b1) the hippocampal blade of the mouse hippocampus, and (b2) a magnification of the frame outlined in panel (b1). (c) The Sox2 (pink) distribution pattern in (c1) the mouse hippocampal blade, and (c2) a magnification of the frame outlined in panel (c1). The arrows shown in (cc2) indicate the Sox2-positive cell nuclei. (d) Western blot analysis revealed the levels of Sox2, NCAM, and GAPDH in isolated adult olfactory bulbs (OB), the cortex (CTX), the hippocampus (HIP) and brain stem (BS). (e) In the OB, HIP, and CTX, the levels of H3K9ac in (e1) the Sox2 promoter and (e2) the Sox2 exon and H4ac in (e3) the Sox2 promoter or (e4) the Sox2 exon were studied by ChIP-qPCR
- Submitted by
- Invitrogen Antibodies (provider)
- Main image
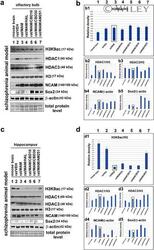
- Experimental details
- The epigenetics of the olfactory bulb and the hippocampus in control and schizophrenia-like rats. Schizophrenia was pharmacologically induced, and the resulting schizophrenia-like rats (labeled MAM) were treated with anti-psychotic drugs. The following proteins were studied using Western blot analysis: H3K9ac, HDAC1, HDAC3, total H3, NCAM, Sox2, and beta-actin. The effects of the following anti-psychotic drugs were tested: haloperidol, cannabidiol CBD10, CBD30 (two doses), and AM251. Panel (a) shows the original Western blot data for samples that were isolated from the olfactory bulbs. The protein loading was based on identical levels of total proteins. The quantification was performed using ImageJ, and Western blot bands were normalized to the total histone H3 levels (or to beta-actin for the neural markers), as shown in panel (b) for (b1) H3K9ac, (b2) HDAC1, (b3) HDAC3, (b4) NCAM, and (b5) Sox2. The Sox2 level was normalized not only to the level of beta-actin but also to the total protein level used for Western blot loading. After data normalization, the Sox2 level was decreased in the MAM samples compared to physiological brains. Panel (c) shows the original Western blot data for samples that were isolated from the hippocampi of the examined rats. (d) The quantification of levels of (d1) H3K9ac, (d2) HDAC1, (d3) HDAC3, (d4) NCAM, and (d5) Sox2. The analysis was performed using normal mouse and rat brains and brains explanted from schizophrenia-like rats that were treated
