 Explore
 Validate
 Learn
Learn Western blot
Antibody data
- Antibody Data
- Antigen structure
- References [1]
- Comments [0]
- Validations
- Western blot [1]
- Immunocytochemistry [1]
- Other assay [2]
Submit
Validation data
Reference
Comment
Report error
- Product number
- MA5-15606 - Provider product page

- Provider
- Invitrogen Antibodies
- Product name
- EGF Monoclonal Antibody (4E11)
- Antibody type
- Monoclonal
- Antigen
- Purifed from natural sources
- Description
- MA5-15606 targets EGF in IF and WB applications and shows reactivity with Human samples.
- Antibody clone number
- 4E11
- Concentration
- Conc. Not Determined
Submitted references Efficient Surface Immobilization of Chemically Modified Hyaluronans for Enhanced Bioactivity and Survival of In Vitro-Cultured Embryonic Salivary Gland Mesenchymal Cells.
Lee SW, Kim J, Cong X, Yu GY, Ryu JH, Park K
Polymers 2021 Apr 9;13(8)
Polymers 2021 Apr 9;13(8)
No comments: Submit comment
Supportive validation
- Submitted by
- Invitrogen Antibodies (provider)
- Main image
- Experimental details
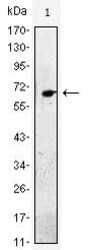
- Western blot analysis of EGF using EGF monoclonal antibody (Product # MA5-15606) in EGF (AA: 971-1023) human IgG Fc transfected HEK293 cell lysate.

Supportive validation
- Submitted by
- Invitrogen Antibodies (provider)
- Main image
- Experimental details
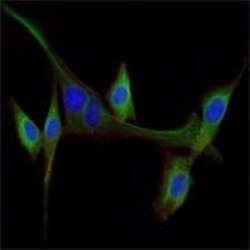
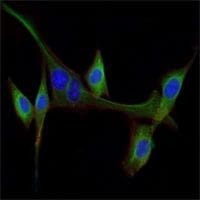
- Immunofluorescence analysis of NIH/3T3 cells using EGF monoclonal antibody (Product # MA5-15606) (Green). Blue: DRAQ5 fluorescent DNA dye. Red: actin filaments have been labeled with phalloidin.
Supportive validation
- Submitted by
- Invitrogen Antibodies (provider)
- Main image

- Experimental details
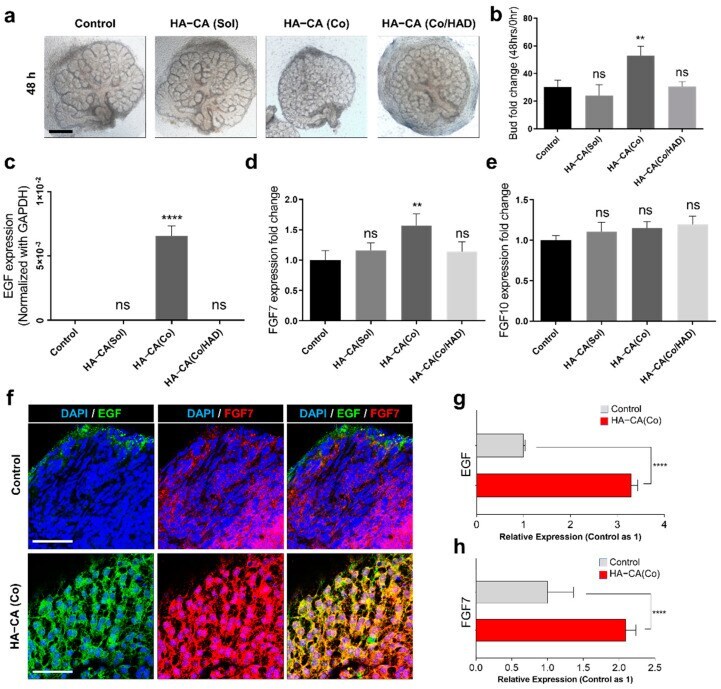
- Figure 4 ( a ) Bright-field images of E13 eSMGs cultured for 48 h in control, solubilized HA-CA (HA-CA (Sol) ), HA-CA-coated surfaces (HA-CA (Co) ), and hyaluronidase-treated HA-CA-coated surfaces (HA-CA (Co/HAD) ). Scale bar = 200 um ( n = 4). ( b ) Bud number fold changes (48 h/0 h) of eSMGs cultured in each group ( n = 4). ( c - e ) mRNA expression level of ( c ) EGF, ( d ) FGF7, and ( e ) FGF10 in eSMGs cultured for 48 h under each condition ( n = 3). ( f ) Immunofluorescence images of mesenchymal EGF (green) and FGF7 (red) expression in eSMGs cultured for 48 h on control and HA-CA-coated surface. DAPI (blue). Scale bar = 50 um ( n = 3). Quantification of mesenchymal ( g ) EGF and ( h ) FGF7 expression based on the immunofluorescence images. Control (gray) and HA-CA (Co) (red) ( n = 4). Data are expressed as average +- SEM ( Figure 4 b-h). ** p < 0.01, **** p < 0.001, ns = non-significant ( p > 0.05) by unpaired t -test ( Figure 4 g,h) and one-way ANOVA with Dunnett''s test ( Figure 4 b-e).
- Submitted by
- Invitrogen Antibodies (provider)
- Main image
- Experimental details
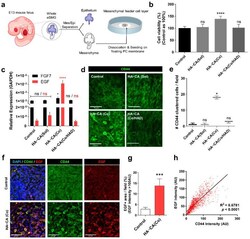
- Figure 5 ( a ) Schematic diagram of embryonic salivary gland mesenchymal (eSGM) feeder cell layer formation. ( b ) Cell viability of eSGM cells cultured for 48 h under each condition ( n = 6). ( c ) mRNA expression level of EGF and FGF7 in eSGM cells cultured for 48 h under each condition ( n = 3). ( d ) Immunofluorescence images of mesenchymal CD44s at 4 h after seeding. Scale bar = 50 um ( n = 3). ( e ) Quantification of CD44-clustered eSGM cells within a defined visual field area ( n = 3). ( f ) Immunofluorescence images of mesenchymal CD44s and EGF in eSGM cells cultured for 48 h on control or HA-CA-coated surfaces. Scale bar = 50 um ( n = 3). ( g ) Quantification of mesenchymal EGF expression in eSGM cells. Pixel area where EGF intensity is higher than 100 AU are measured and divided by the defined visual field area ( n = 4). ( h ) Linear correlation is plotted between signal intensities of CD44 and EGF in the immunofluorescence images. R 2 and p -values are noted in the graph. Data are expressed as average +- SEM ( Figure 5 b,c,g) or median with interquartile range ( Figure 5 e). * p < 0.05, *** p < 0.005, **** p < 0.001, ns = non-significant ( p > 0.05) by unpaired t -test ( Figure 5 g), one-way ANOVA with Dunnett''s tests ( Figure 5 b,c), and Kruskal-Wallis ANOVA with non-parametric Dunnett''s test ( Figure 5 e).
