Explore
 Validate
 Learn
Learn Flow cytometry
Antibody data
- Antibody Data
- Antigen structure
- References [51]
- Comments [0]
- Validations
- Flow cytometry [1]
- Other assay [55]
Submit
Validation data
Reference
Comment
Report error
- Product number
- 61-5698-82 - Provider product page

- Provider
- Invitrogen Antibodies
- Product name
- Ki-67 Monoclonal Antibody (SolA15), PE-eFluor™ 610, eBioscience™
- Antibody type
- Monoclonal
- Antigen
- Other
- Description
- Description: The monoclonal antibody SolA15 recognizes mouse and rat Ki-67, a 300 kDa nuclear protein. Ki-67 is present during all active phases of the cell cycle (G1, S, G2, and mitosis), but is absent from resting cells (G0). Ki-67 is detected within the nucleus during interphase but redistributes to the chromosomes during mitosis. Ki-67 is used as a marker for determining the growth fraction of a given population of cells. In studies of tumor cells, the "Ki-67 labeling index" refers to the number of Ki-67 positive cells within the population and this is used to predict outcome of particular cancer types. Ki-67 has been shown to interact with the DNA-bound protein chromobox protein homolog 3 (CBX3) (heterochromatin).
- Antibody clone number
- SolA15
- Concentration
- 0.2 mg/mL
Submitted references Macrophage LAMTOR1 Deficiency Prevents Dietary Obesity and Insulin Resistance Through Inflammation-Induced Energy Expenditure.
Shikonin Derivatives from Onsoma visianii Decrease Expression of Phosphorylated STAT3 in Leukemia Cells and Exert Antitumor Activity.
Mutant ASXL1 induces age-related expansion of phenotypic hematopoietic stem cells through activation of Akt/mTOR pathway.
HOXA11 plays critical roles in disease progression and response to cytarabine in AML.
Targeting Phosphatidylserine Enhances the Anti-tumor Response to Tumor-Directed Radiation Therapy in a Preclinical Model of Melanoma.
An mTORC1-dependent switch orchestrates the transition between mouse spermatogonial stem cells and clones of progenitor spermatogonia.
Treatment of mice with a ligand binding blocking anti-CD28 monoclonal antibody improves healing after myocardial infarction.
Mycobacterium tuberculosis-infected alveolar epithelial cells modulate dendritic cell function through the HIF-1α-NOS2 axis.
Discrete populations of isotype-switched memory B lymphocytes are maintained in murine spleen and bone marrow.
Follicular Regulatory T Cells Can Access the Germinal Center Independently of CXCR5.
Chemosensitization of prostate cancer stem cells in mice by angiogenin and plexin-B2 inhibitors.
CD103(+) cDC1 and endogenous CD8(+) T cells are necessary for improved CD40L-overexpressing CAR T cell antitumor function.
Cardiac fibroblast proliferation rates and collagen expression mature early and are unaltered with advancing age.
SCENITH: A Flow Cytometry-Based Method to Functionally Profile Energy Metabolism with Single-Cell Resolution.
FCRL5(+) Memory B Cells Exhibit Robust Recall Responses.
Pulsatile MEK Inhibition Improves Anti-tumor Immunity and T Cell Function in Murine Kras Mutant Lung Cancer.
ATF3 Sustains IL-22-Induced STAT3 Phosphorylation to Maintain Mucosal Immunity Through Inhibiting Phosphatases.
Pax6 Lengthens G1 Phase and Decreases Oscillating Cdk6 Levels in Murine Embryonic Cortical Progenitors.
SunRiSE - measuring translation elongation at single-cell resolution by means of flow cytometry.
Lymphotoxin α fine-tunes T cell clonal deletion by regulating thymic entry of antigen-presenting cells.
Adrenergic nerve degeneration in bone marrow drives aging of the hematopoietic stem cell niche.
Stem cell factor is selectively secreted by arterial endothelial cells in bone marrow.
The organic ester O,O'-diethyl-(S,S)-ethylenediamine-N,N'-di-2-(3-cyclohexyl)propanoate dihydrochloride attenuates murine breast cancer growth and metastasis.
Endothelial cells in the innate response to allergens and initiation of atopic asthma.
A Metabolite-Triggered Tuft Cell-ILC2 Circuit Drives Small Intestinal Remodeling.
Modulation of Myelopoiesis Progenitors Is an Integral Component of Trained Immunity.
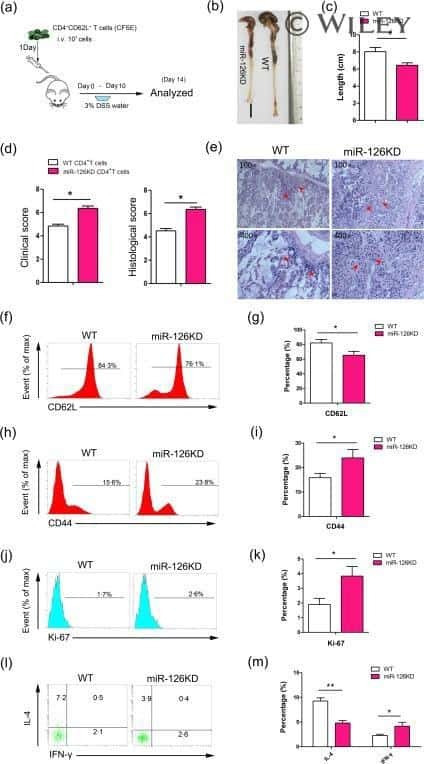
MicroRNA-126 deficiency enhanced the activation and function of CD4(+) T cells by elevating IRS-1 pathway.
Fc Effector Function Contributes to the Activity of Human Anti-CTLA-4 Antibodies.
1810011o10 Rik Inhibits the Antitumor Effect of Intratumoral CD8(+) T Cells through Suppression of Notch2 Pathway in a Murine Hepatocellular Carcinoma Model.
A somatic mutation in erythro-myeloid progenitors causes neurodegenerative disease.
Neonatal pancreatic pericytes support β-cell proliferation.
Differential cytokine contributions of perivascular haematopoietic stem cell niches.
Egr2 and 3 control adaptive immune responses by temporally uncoupling expansion from T cell differentiation.
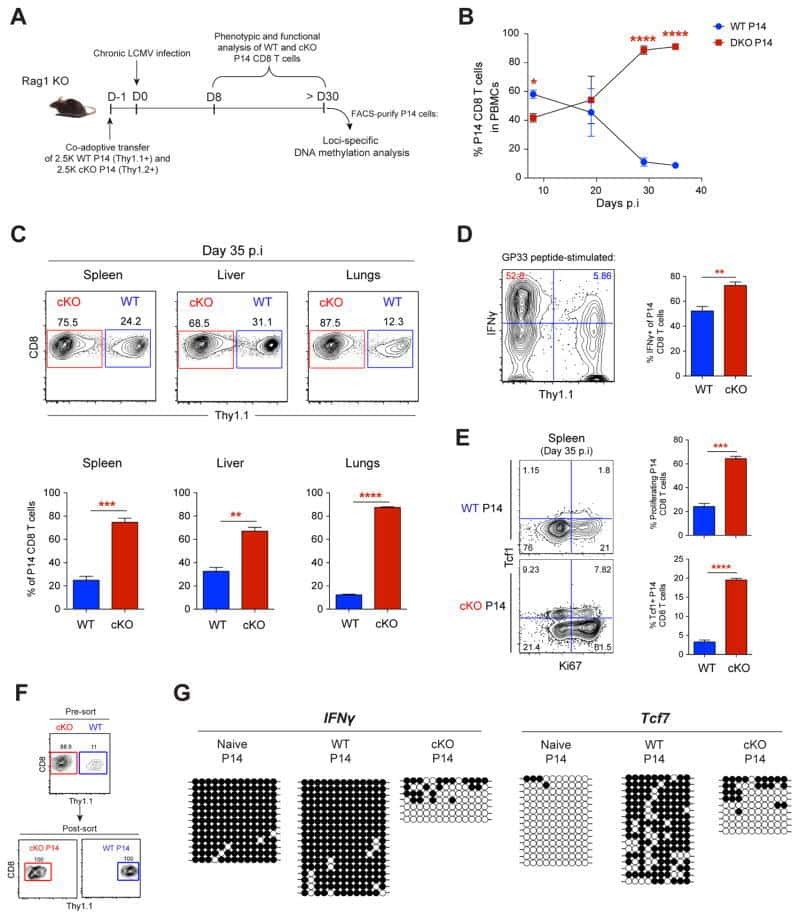
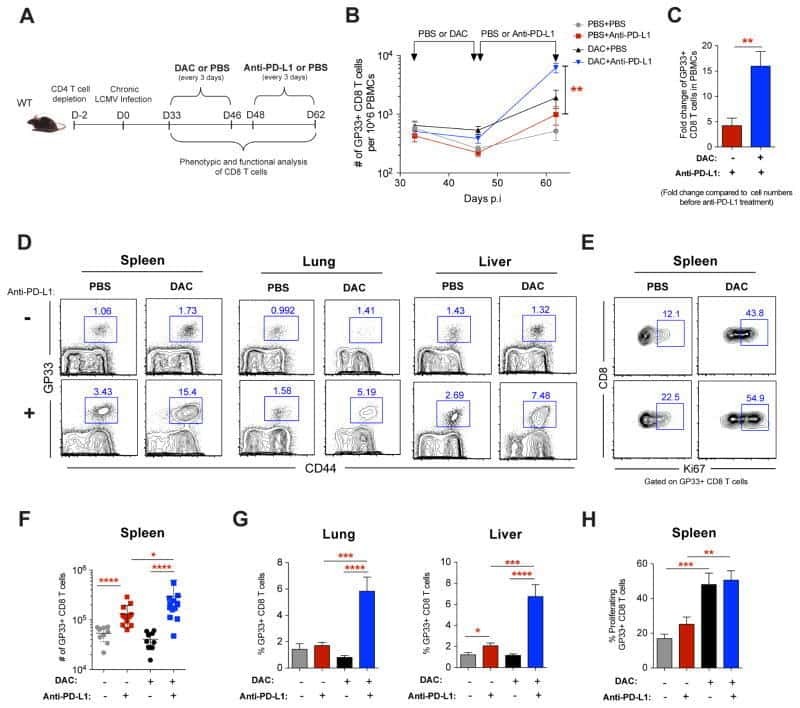
De Novo Epigenetic Programs Inhibit PD-1 Blockade-Mediated T Cell Rejuvenation.
White Adipose Tissue Is a Reservoir for Memory T Cells and Promotes Protective Memory Responses to Infection.
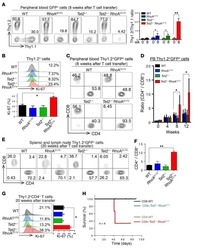
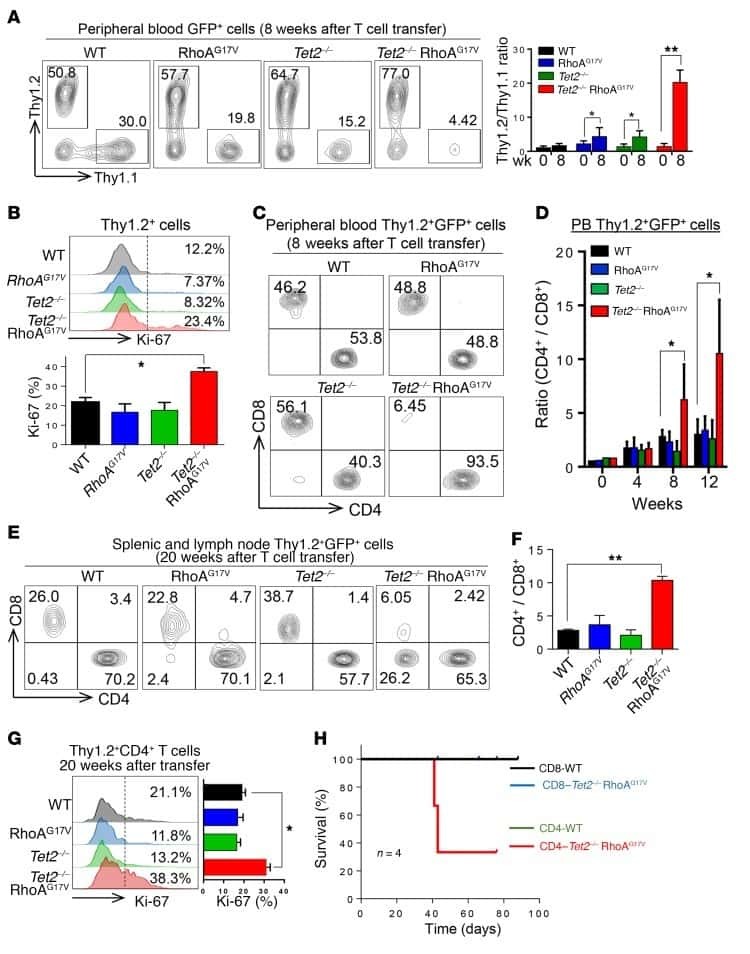
Mutations in 5-methylcytosine oxidase TET2 and RhoA cooperatively disrupt T cell homeostasis.
Myeloid progenitor cluster formation drives emergency and leukaemic myelopoiesis.
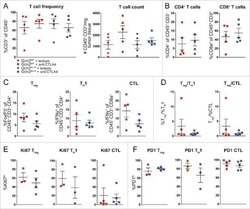
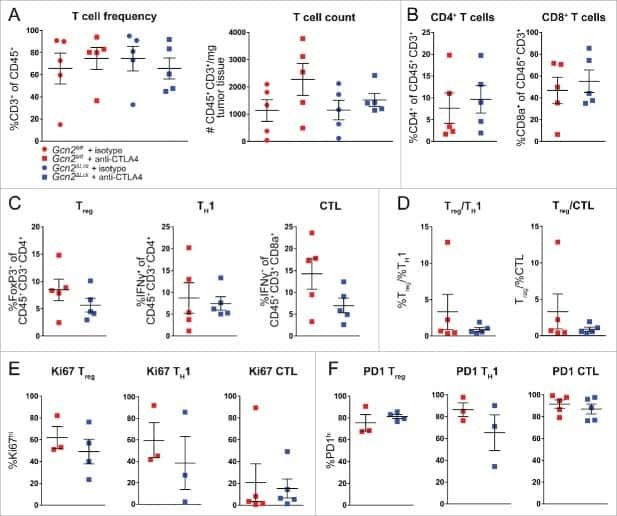
The stress kinase GCN2 does not mediate suppression of antitumor T cell responses by tryptophan catabolism in experimental melanomas.
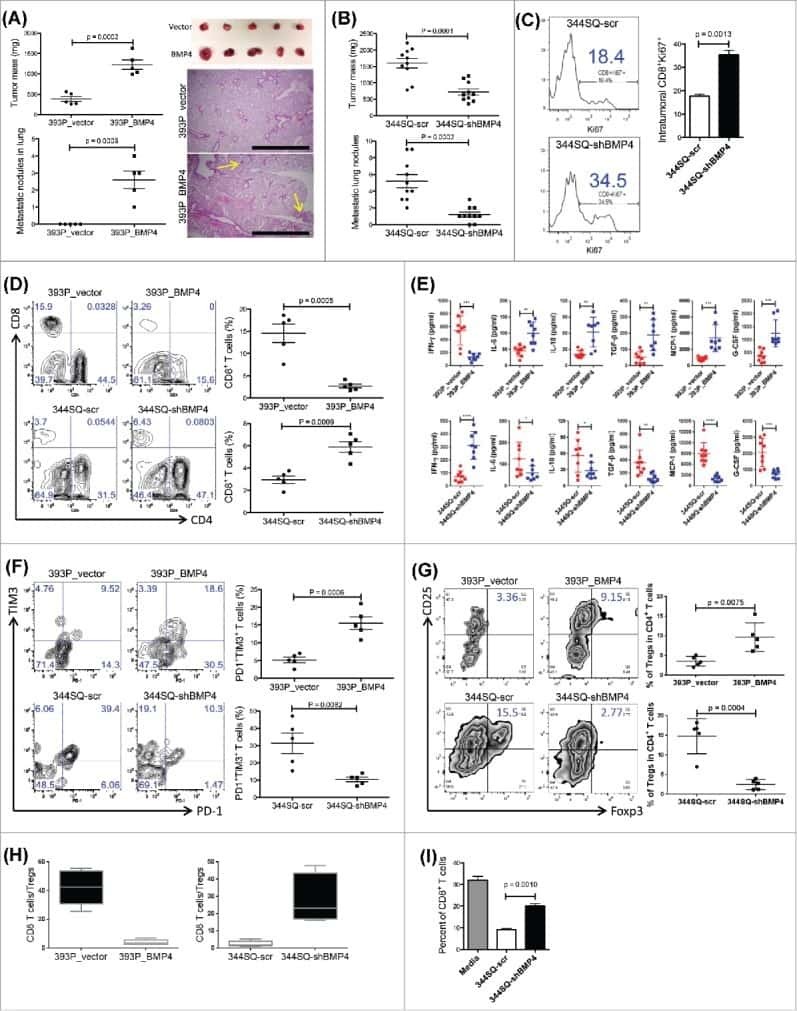
Growth and metastasis of lung adenocarcinoma is potentiated by BMP4-mediated immunosuppression.
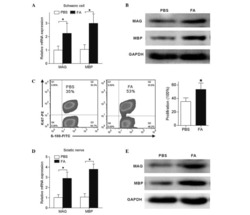
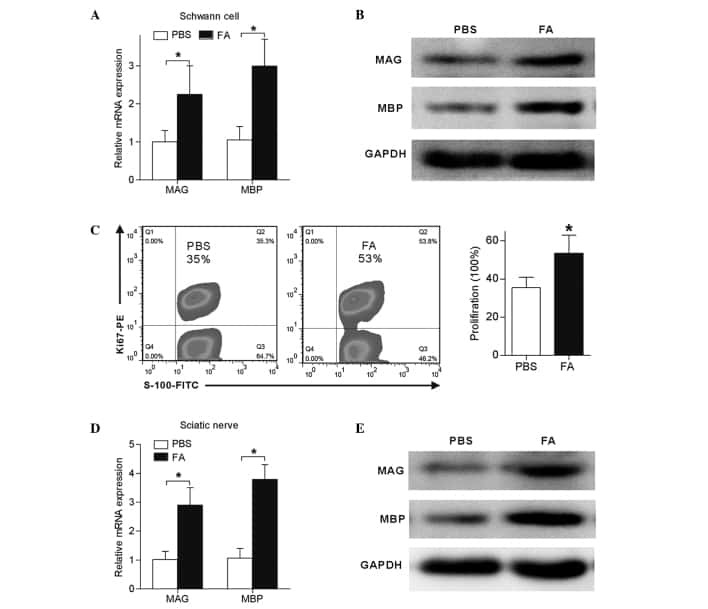
Schwann cell proliferation and differentiation that is induced by ferulic acid through MEK1/ERK1/2 signalling promotes peripheral nerve remyelination following crush injury in rats.
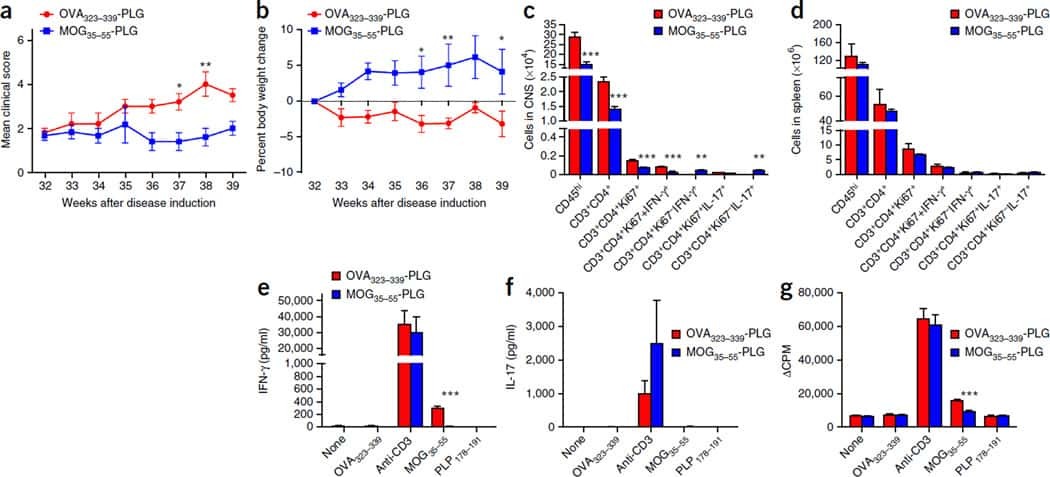
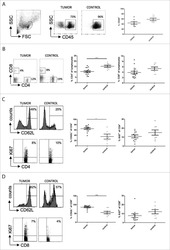
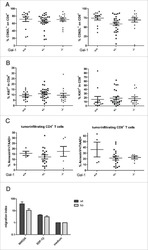
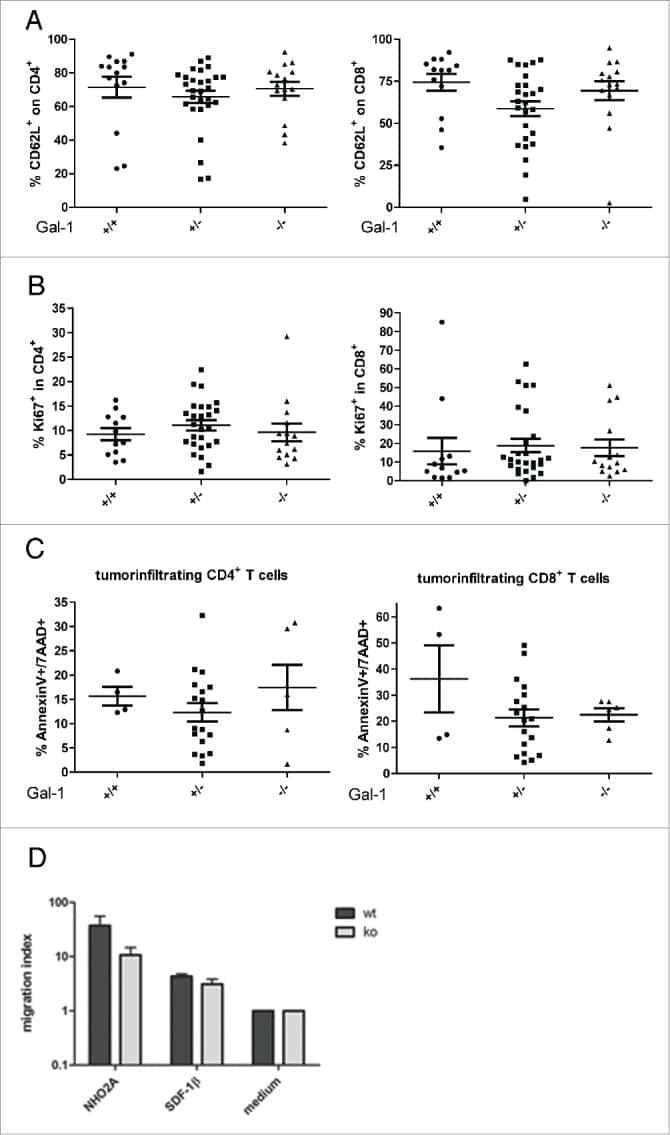
Immune response modulation by Galectin-1 in a transgenic model of neuroblastoma.
The cell proliferation antigen Ki-67 organises heterochromatin.
Oligodendrocyte death results in immune-mediated CNS demyelination.
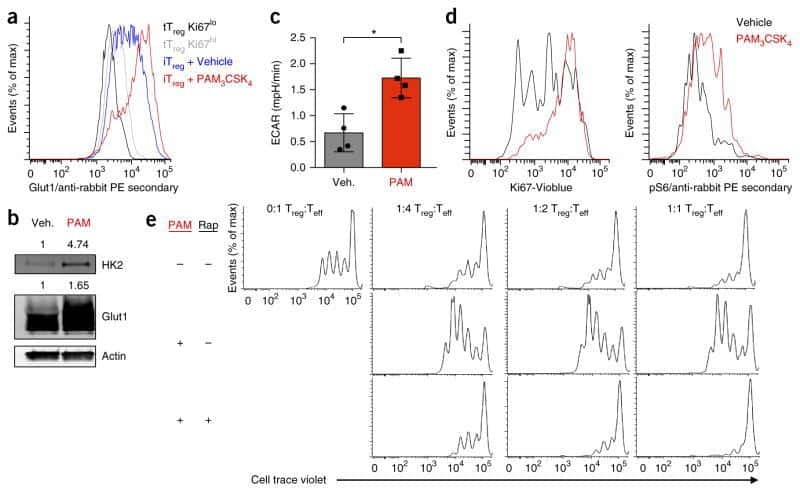
Foxp3 and Toll-like receptor signaling balance T(reg) cell anabolic metabolism for suppression.
Mammary Stem Cells and Tumor-Initiating Cells Are More Resistant to Apoptosis and Exhibit Increased DNA Repair Activity in Response to DNA Damage.
Frizzled-6 Regulates Hematopoietic Stem/Progenitor Cell Survival and Self-Renewal.
Metastasis is regulated via microRNA-200/ZEB1 axis control of tumour cell PD-L1 expression and intratumoral immunosuppression.
Myeloid cells expressing VEGF and arginase-1 following uptake of damaged retinal pigment epithelium suggests potential mechanism that drives the onset of choroidal angiogenesis in mice.
Small intestine inflammation in Roquin-mutant and Roquin-deficient mice.
IL-1R signaling in dendritic cells replaces pattern-recognition receptors in promoting CD8⁺ T cell responses to influenza A virus.
Primate B-1 cells generate antigen-specific B cell responses to T cell-independent type 2 antigens.
Ying L, Zhang M, Ma X, Si Y, Li X, Su J, Yin J, Bao Y
Frontiers in cell and developmental biology 2021;9:672032
Frontiers in cell and developmental biology 2021;9:672032
Shikonin Derivatives from Onsoma visianii Decrease Expression of Phosphorylated STAT3 in Leukemia Cells and Exert Antitumor Activity.
Todorovic Z, Milovanovic J, Arsenijevic D, Vukovic N, Vukic M, Arsenijevic A, Djurdjevic P, Milovanovic M, Arsenijevic N
Nutrients 2021 Mar 31;13(4)
Nutrients 2021 Mar 31;13(4)
Mutant ASXL1 induces age-related expansion of phenotypic hematopoietic stem cells through activation of Akt/mTOR pathway.
Fujino T, Goyama S, Sugiura Y, Inoue D, Asada S, Yamasaki S, Matsumoto A, Yamaguchi K, Isobe Y, Tsuchiya A, Shikata S, Sato N, Morinaga H, Fukuyama T, Tanaka Y, Fukushima T, Takeda R, Yamamoto K, Honda H, Nishimura EK, Furukawa Y, Shibata T, Abdel-Wahab O, Suematsu M, Kitamura T
Nature communications 2021 Mar 23;12(1):1826
Nature communications 2021 Mar 23;12(1):1826
HOXA11 plays critical roles in disease progression and response to cytarabine in AML.
Fu JF, Shih LY, Yen TH
Oncology reports 2021 Jul;46(1)
Oncology reports 2021 Jul;46(1)
Targeting Phosphatidylserine Enhances the Anti-tumor Response to Tumor-Directed Radiation Therapy in a Preclinical Model of Melanoma.
Budhu S, Giese R, Gupta A, Fitzgerald K, Zappasodi R, Schad S, Hirschhorn D, Campesato LF, De Henau O, Gigoux M, Liu C, Mazo G, Deng L, Barker CA, Wolchok JD, Merghoub T
Cell reports 2021 Jan 12;34(2):108620
Cell reports 2021 Jan 12;34(2):108620
An mTORC1-dependent switch orchestrates the transition between mouse spermatogonial stem cells and clones of progenitor spermatogonia.
Suzuki S, McCarrey JR, Hermann BP
Cell reports 2021 Feb 16;34(7):108752
Cell reports 2021 Feb 16;34(7):108752
Treatment of mice with a ligand binding blocking anti-CD28 monoclonal antibody improves healing after myocardial infarction.
Gladow N, Hollmann C, Ramos G, Frantz S, Kerkau T, Beyersdorf N, Hofmann U
PloS one 2020;15(4):e0227734
PloS one 2020;15(4):e0227734
Mycobacterium tuberculosis-infected alveolar epithelial cells modulate dendritic cell function through the HIF-1α-NOS2 axis.
Rodrigues TS, Alvarez ARP, Gembre AF, Forni MFPAD, de Melo BMS, Alves Filho JCF, Câmara NOS, Bonato VLD
Journal of leukocyte biology 2020 Oct;108(4):1225-1238
Journal of leukocyte biology 2020 Oct;108(4):1225-1238
Discrete populations of isotype-switched memory B lymphocytes are maintained in murine spleen and bone marrow.
Riedel R, Addo R, Ferreira-Gomes M, Heinz GA, Heinrich F, Kummer J, Greiff V, Schulz D, Klaeden C, Cornelis R, Menzel U, Kröger S, Stervbo U, Köhler R, Haftmann C, Kühnel S, Lehmann K, Maschmeyer P, McGrath M, Naundorf S, Hahne S, Sercan-Alp Ö, Siracusa F, Stefanowski J, Weber M, Westendorf K, Zimmermann J, Hauser AE, Reddy ST, Durek P, Chang HD, Mashreghi MF, Radbruch A
Nature communications 2020 May 22;11(1):2570
Nature communications 2020 May 22;11(1):2570
Follicular Regulatory T Cells Can Access the Germinal Center Independently of CXCR5.
Vanderleyden I, Fra-Bido SC, Innocentin S, Stebegg M, Okkenhaug H, Evans-Bailey N, Pierson W, Denton AE, Linterman MA
Cell reports 2020 Jan 21;30(3):611-619.e4
Cell reports 2020 Jan 21;30(3):611-619.e4
Chemosensitization of prostate cancer stem cells in mice by angiogenin and plexin-B2 inhibitors.
Li S, Goncalves KA, Lyu B, Yuan L, Hu GF
Communications biology 2020 Jan 15;3(1):26
Communications biology 2020 Jan 15;3(1):26
CD103(+) cDC1 and endogenous CD8(+) T cells are necessary for improved CD40L-overexpressing CAR T cell antitumor function.
Kuhn NF, Lopez AV, Li X, Cai W, Daniyan AF, Brentjens RJ
Nature communications 2020 Dec 2;11(1):6171
Nature communications 2020 Dec 2;11(1):6171
Cardiac fibroblast proliferation rates and collagen expression mature early and are unaltered with advancing age.
Wu R, Ma F, Tosevska A, Farrell C, Pellegrini M, Deb A
JCI insight 2020 Dec 17;5(24)
JCI insight 2020 Dec 17;5(24)
SCENITH: A Flow Cytometry-Based Method to Functionally Profile Energy Metabolism with Single-Cell Resolution.
Argüello RJ, Combes AJ, Char R, Gigan JP, Baaziz AI, Bousiquot E, Camosseto V, Samad B, Tsui J, Yan P, Boissonneau S, Figarella-Branger D, Gatti E, Tabouret E, Krummel MF, Pierre P
Cell metabolism 2020 Dec 1;32(6):1063-1075.e7
Cell metabolism 2020 Dec 1;32(6):1063-1075.e7
FCRL5(+) Memory B Cells Exhibit Robust Recall Responses.
Kim CC, Baccarella AM, Bayat A, Pepper M, Fontana MF
Cell reports 2019 Apr 30;27(5):1446-1460.e4
Cell reports 2019 Apr 30;27(5):1446-1460.e4
Pulsatile MEK Inhibition Improves Anti-tumor Immunity and T Cell Function in Murine Kras Mutant Lung Cancer.
Choi H, Deng J, Li S, Silk T, Dong L, Brea EJ, Houghton S, Redmond D, Zhong H, Boiarsky J, Akbay EA, Smith PD, Merghoub T, Wong KK, Wolchok JD
Cell reports 2019 Apr 16;27(3):806-819.e5
Cell reports 2019 Apr 16;27(3):806-819.e5
ATF3 Sustains IL-22-Induced STAT3 Phosphorylation to Maintain Mucosal Immunity Through Inhibiting Phosphatases.
Glal D, Sudhakar JN, Lu HH, Liu MC, Chiang HY, Liu YC, Cheng CF, Shui JW
Frontiers in immunology 2018;9:2522
Frontiers in immunology 2018;9:2522
Pax6 Lengthens G1 Phase and Decreases Oscillating Cdk6 Levels in Murine Embryonic Cortical Progenitors.
Mi D, Manuel M, Huang YT, Mason JO, Price DJ
Frontiers in cellular neuroscience 2018;12:419
Frontiers in cellular neuroscience 2018;12:419
SunRiSE - measuring translation elongation at single-cell resolution by means of flow cytometry.
Argüello RJ, Reverendo M, Mendes A, Camosseto V, Torres AG, Ribas de Pouplana L, van de Pavert SA, Gatti E, Pierre P
Journal of cell science 2018 May 31;131(10)
Journal of cell science 2018 May 31;131(10)
Lymphotoxin α fine-tunes T cell clonal deletion by regulating thymic entry of antigen-presenting cells.
Lopes N, Charaix J, Cédile O, Sergé A, Irla M
Nature communications 2018 Mar 28;9(1):1262
Nature communications 2018 Mar 28;9(1):1262
Adrenergic nerve degeneration in bone marrow drives aging of the hematopoietic stem cell niche.
Maryanovich M, Zahalka AH, Pierce H, Pinho S, Nakahara F, Asada N, Wei Q, Wang X, Ciero P, Xu J, Leftin A, Frenette PS
Nature medicine 2018 Jun;24(6):782-791
Nature medicine 2018 Jun;24(6):782-791
Stem cell factor is selectively secreted by arterial endothelial cells in bone marrow.
Xu C, Gao X, Wei Q, Nakahara F, Zimmerman SE, Mar J, Frenette PS
Nature communications 2018 Jun 22;9(1):2449
Nature communications 2018 Jun 22;9(1):2449
The organic ester O,O'-diethyl-(S,S)-ethylenediamine-N,N'-di-2-(3-cyclohexyl)propanoate dihydrochloride attenuates murine breast cancer growth and metastasis.
Jurisevic M, Arsenijevic A, Pantic J, Gajovic N, Milovanovic J, Milovanovic M, Poljarevic J, Sabo T, Vojvodic D, Radosavljevic GD, Arsenijevic N
Oncotarget 2018 Jun 15;9(46):28195-28212
Oncotarget 2018 Jun 15;9(46):28195-28212
Endothelial cells in the innate response to allergens and initiation of atopic asthma.
Asosingh K, Weiss K, Queisser K, Wanner N, Yin M, Aronica M, Erzurum S
The Journal of clinical investigation 2018 Jul 2;128(7):3116-3128
The Journal of clinical investigation 2018 Jul 2;128(7):3116-3128
A Metabolite-Triggered Tuft Cell-ILC2 Circuit Drives Small Intestinal Remodeling.
Schneider C, O'Leary CE, von Moltke J, Liang HE, Ang QY, Turnbaugh PJ, Radhakrishnan S, Pellizzon M, Ma A, Locksley RM
Cell 2018 Jul 12;174(2):271-284.e14
Cell 2018 Jul 12;174(2):271-284.e14
Modulation of Myelopoiesis Progenitors Is an Integral Component of Trained Immunity.
Mitroulis I, Ruppova K, Wang B, Chen LS, Grzybek M, Grinenko T, Eugster A, Troullinaki M, Palladini A, Kourtzelis I, Chatzigeorgiou A, Schlitzer A, Beyer M, Joosten LAB, Isermann B, Lesche M, Petzold A, Simons K, Henry I, Dahl A, Schultze JL, Wielockx B, Zamboni N, Mirtschink P, Coskun Ü, Hajishengallis G, Netea MG, Chavakis T
Cell 2018 Jan 11;172(1-2):147-161.e12
Cell 2018 Jan 11;172(1-2):147-161.e12
MicroRNA-126 deficiency enhanced the activation and function of CD4(+) T cells by elevating IRS-1 pathway.
Chu F, Hu Y, Zhou Y, Guo M, Lu J, Zheng W, Xu H, Zhao J, Xu L
Clinical and experimental immunology 2018 Feb;191(2):166-179
Clinical and experimental immunology 2018 Feb;191(2):166-179
Fc Effector Function Contributes to the Activity of Human Anti-CTLA-4 Antibodies.
Arce Vargas F, Furness AJS, Litchfield K, Joshi K, Rosenthal R, Ghorani E, Solomon I, Lesko MH, Ruef N, Roddie C, Henry JY, Spain L, Ben Aissa A, Georgiou A, Wong YNS, Smith M, Strauss D, Hayes A, Nicol D, O'Brien T, Mårtensson L, Ljungars A, Teige I, Frendéus B, TRACERx Melanoma, TRACERx Renal, TRACERx Lung consortia, Pule M, Marafioti T, Gore M, Larkin J, Turajlic S, Swanton C, Peggs KS, Quezada SA
Cancer cell 2018 Apr 9;33(4):649-663.e4
Cancer cell 2018 Apr 9;33(4):649-663.e4
1810011o10 Rik Inhibits the Antitumor Effect of Intratumoral CD8(+) T Cells through Suppression of Notch2 Pathway in a Murine Hepatocellular Carcinoma Model.
Dai K, Huang L, Huang YB, Chen ZB, Yang LH, Jiang YA
Frontiers in immunology 2017;8:320
Frontiers in immunology 2017;8:320
A somatic mutation in erythro-myeloid progenitors causes neurodegenerative disease.
Mass E, Jacome-Galarza CE, Blank T, Lazarov T, Durham BH, Ozkaya N, Pastore A, Schwabenland M, Chung YR, Rosenblum MK, Prinz M, Abdel-Wahab O, Geissmann F
Nature 2017 Sep 21;549(7672):389-393
Nature 2017 Sep 21;549(7672):389-393
Neonatal pancreatic pericytes support β-cell proliferation.
Epshtein A, Rachi E, Sakhneny L, Mizrachi S, Baer D, Landsman L
Molecular metabolism 2017 Oct;6(10):1330-1338
Molecular metabolism 2017 Oct;6(10):1330-1338
Differential cytokine contributions of perivascular haematopoietic stem cell niches.
Asada N, Kunisaki Y, Pierce H, Wang Z, Fernandez NF, Birbrair A, Ma'ayan A, Frenette PS
Nature cell biology 2017 Mar;19(3):214-223
Nature cell biology 2017 Mar;19(3):214-223
Egr2 and 3 control adaptive immune responses by temporally uncoupling expansion from T cell differentiation.
Miao T, Symonds ALJ, Singh R, Symonds JD, Ogbe A, Omodho B, Zhu B, Li S, Wang P
The Journal of experimental medicine 2017 Jun 5;214(6):1787-1808
The Journal of experimental medicine 2017 Jun 5;214(6):1787-1808
De Novo Epigenetic Programs Inhibit PD-1 Blockade-Mediated T Cell Rejuvenation.
Ghoneim HE, Fan Y, Moustaki A, Abdelsamed HA, Dash P, Dogra P, Carter R, Awad W, Neale G, Thomas PG, Youngblood B
Cell 2017 Jun 29;170(1):142-157.e19
Cell 2017 Jun 29;170(1):142-157.e19
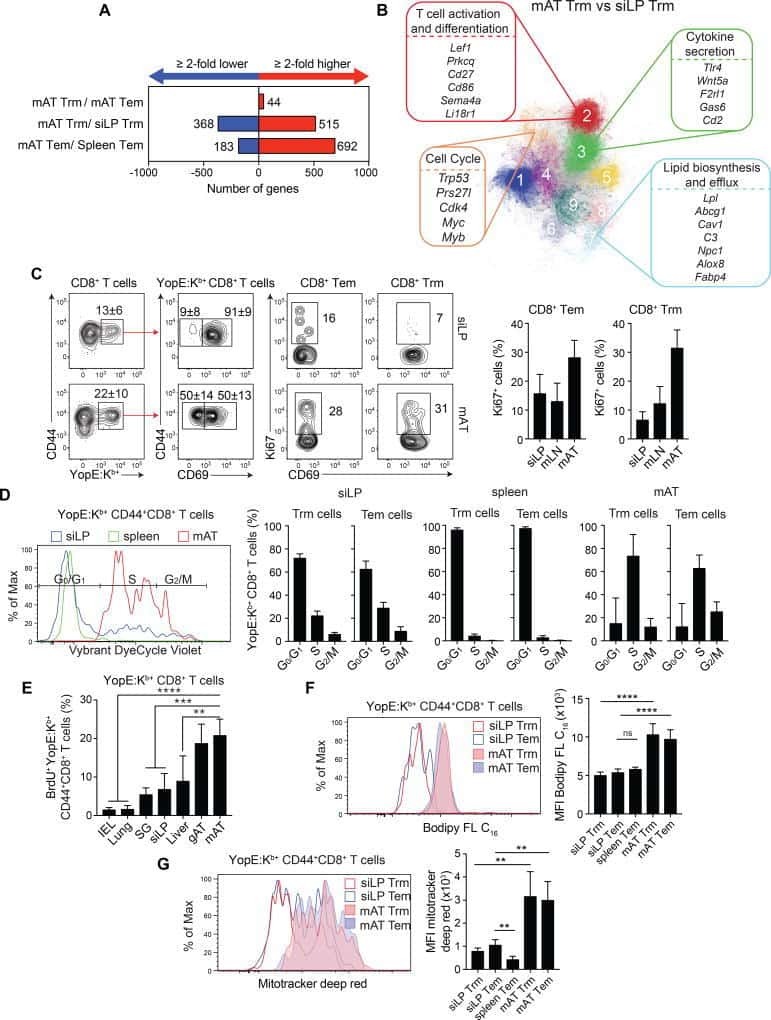
White Adipose Tissue Is a Reservoir for Memory T Cells and Promotes Protective Memory Responses to Infection.
Han SJ, Glatman Zaretsky A, Andrade-Oliveira V, Collins N, Dzutsev A, Shaik J, Morais da Fonseca D, Harrison OJ, Tamoutounour S, Byrd AL, Smelkinson M, Bouladoux N, Bliska JB, Brenchley JM, Brodsky IE, Belkaid Y
Immunity 2017 Dec 19;47(6):1154-1168.e6
Immunity 2017 Dec 19;47(6):1154-1168.e6
Mutations in 5-methylcytosine oxidase TET2 and RhoA cooperatively disrupt T cell homeostasis.
Zang S, Li J, Yang H, Zeng H, Han W, Zhang J, Lee M, Moczygemba M, Isgandarova S, Yang Y, Zhou Y, Rao A, You MJ, Sun D, Huang Y
The Journal of clinical investigation 2017 Aug 1;127(8):2998-3012
The Journal of clinical investigation 2017 Aug 1;127(8):2998-3012
Myeloid progenitor cluster formation drives emergency and leukaemic myelopoiesis.
Hérault A, Binnewies M, Leong S, Calero-Nieto FJ, Zhang SY, Kang YA, Wang X, Pietras EM, Chu SH, Barry-Holson K, Armstrong S, Göttgens B, Passegué E
Nature 2017 Apr 6;544(7648):53-58
Nature 2017 Apr 6;544(7648):53-58
The stress kinase GCN2 does not mediate suppression of antitumor T cell responses by tryptophan catabolism in experimental melanomas.
Sonner JK, Deumelandt K, Ott M, Thomé CM, Rauschenbach KJ, Schulz S, Munteanu B, Mohapatra S, Adam I, Hofer AC, Feuerer M, Opitz CA, Hopf C, Wick W, Platten M
Oncoimmunology 2016;5(12):e1240858
Oncoimmunology 2016;5(12):e1240858
Growth and metastasis of lung adenocarcinoma is potentiated by BMP4-mediated immunosuppression.
Chen L, Yi X, Goswami S, Ahn YH, Roybal JD, Yang Y, Diao L, Peng D, Peng D, Fradette JJ, Wang J, Byers LA, Kurie JM, Ullrich SE, Qin FX, Gibbons DL
Oncoimmunology 2016;5(11):e1234570
Oncoimmunology 2016;5(11):e1234570
Schwann cell proliferation and differentiation that is induced by ferulic acid through MEK1/ERK1/2 signalling promotes peripheral nerve remyelination following crush injury in rats.
Zhu X, Li K, Guo X, Wang J, Xiang Y
Experimental and therapeutic medicine 2016 Sep;12(3):1915-1921
Experimental and therapeutic medicine 2016 Sep;12(3):1915-1921
Immune response modulation by Galectin-1 in a transgenic model of neuroblastoma.
Büchel G, Schulte JH, Harrison L, Batzke K, Schüller U, Hansen W, Schramm A
Oncoimmunology 2016 May;5(5):e1131378
Oncoimmunology 2016 May;5(5):e1131378
The cell proliferation antigen Ki-67 organises heterochromatin.
Sobecki M, Mrouj K, Camasses A, Parisis N, Nicolas E, Llères D, Gerbe F, Prieto S, Krasinska L, David A, Eguren M, Birling MC, Urbach S, Hem S, Déjardin J, Malumbres M, Jay P, Dulic V, Lafontaine DLj, Feil R, Fisher D
eLife 2016 Mar 7;5:e13722
eLife 2016 Mar 7;5:e13722
Oligodendrocyte death results in immune-mediated CNS demyelination.
Traka M, Podojil JR, McCarthy DP, Miller SD, Popko B
Nature neuroscience 2016 Jan;19(1):65-74
Nature neuroscience 2016 Jan;19(1):65-74
Foxp3 and Toll-like receptor signaling balance T(reg) cell anabolic metabolism for suppression.
Gerriets VA, Kishton RJ, Johnson MO, Cohen S, Siska PJ, Nichols AG, Warmoes MO, de Cubas AA, MacIver NJ, Locasale JW, Turka LA, Wells AD, Rathmell JC
Nature immunology 2016 Dec;17(12):1459-1466
Nature immunology 2016 Dec;17(12):1459-1466
Mammary Stem Cells and Tumor-Initiating Cells Are More Resistant to Apoptosis and Exhibit Increased DNA Repair Activity in Response to DNA Damage.
Chang CH, Zhang M, Rajapakshe K, Coarfa C, Edwards D, Huang S, Rosen JM
Stem cell reports 2015 Sep 8;5(3):378-91
Stem cell reports 2015 Sep 8;5(3):378-91
Frizzled-6 Regulates Hematopoietic Stem/Progenitor Cell Survival and Self-Renewal.
Abidin BM, Owusu Kwarteng E, Heinonen KM
Journal of immunology (Baltimore, Md. : 1950) 2015 Sep 1;195(5):2168-76
Journal of immunology (Baltimore, Md. : 1950) 2015 Sep 1;195(5):2168-76
Metastasis is regulated via microRNA-200/ZEB1 axis control of tumour cell PD-L1 expression and intratumoral immunosuppression.
Chen L, Gibbons DL, Goswami S, Cortez MA, Ahn YH, Byers LA, Zhang X, Yi X, Dwyer D, Lin W, Diao L, Wang J, Roybal J, Patel M, Ungewiss C, Peng D, Antonia S, Mediavilla-Varela M, Robertson G, Suraokar M, Welsh JW, Erez B, Wistuba II, Chen L, Peng D, Wang S, Ullrich SE, Heymach JV, Kurie JM, Qin FX
Nature communications 2014 Oct 28;5:5241
Nature communications 2014 Oct 28;5:5241
Myeloid cells expressing VEGF and arginase-1 following uptake of damaged retinal pigment epithelium suggests potential mechanism that drives the onset of choroidal angiogenesis in mice.
Liu J, Copland DA, Horie S, Wu WK, Chen M, Xu Y, Paul Morgan B, Mack M, Xu H, Nicholson LB, Dick AD
PloS one 2013;8(8):e72935
PloS one 2013;8(8):e72935
Small intestine inflammation in Roquin-mutant and Roquin-deficient mice.
Schaefer JS, Montufar-Solis D, Nakra N, Vigneswaran N, Klein JR
PloS one 2013;8(2):e56436
PloS one 2013;8(2):e56436
IL-1R signaling in dendritic cells replaces pattern-recognition receptors in promoting CD8⁺ T cell responses to influenza A virus.
Pang IK, Ichinohe T, Iwasaki A
Nature immunology 2013 Mar;14(3):246-53
Nature immunology 2013 Mar;14(3):246-53
Primate B-1 cells generate antigen-specific B cell responses to T cell-independent type 2 antigens.
Yammani RD, Haas KM
Journal of immunology (Baltimore, Md. : 1950) 2013 Apr 1;190(7):3100-8
Journal of immunology (Baltimore, Md. : 1950) 2013 Apr 1;190(7):3100-8
No comments: Submit comment
Supportive validation
- Submitted by
- Invitrogen Antibodies (provider)
- Main image

- Experimental details
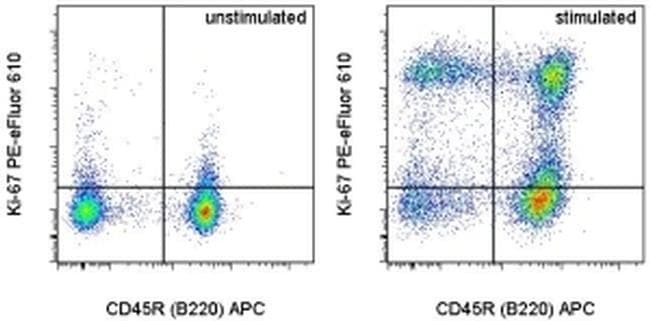
- Intracellular staining of unstimulated (left) or 2-day Anti-Mouse CD3e Functional Grade Purified (Product # 16-0031-82)-stimulated (right) BALB/c splenocytes with Anti-Human/Mouse CD45R (B220) APC (Product # 17-0452-82) and 0.06 µg of Anti-Mouse/Rat Ki-67 PE-eFluor® 610 (right) using the Foxp3/Transcription Factor Staining Buffer Set (Product # 00-5523-00) and protocol. Cells in the lymphocyte gate were used for analysis.
Supportive validation
- Submitted by
- Invitrogen Antibodies (provider)
- Main image

- Experimental details
- NULL
- Submitted by
- Invitrogen Antibodies (provider)
- Main image
- Experimental details
- NULL
- Submitted by
- Invitrogen Antibodies (provider)
- Main image
- Experimental details
- NULL
- Submitted by
- Invitrogen Antibodies (provider)
- Main image
- Experimental details
- NULL
- Submitted by
- Invitrogen Antibodies (provider)
- Main image
- Experimental details
- NULL

- Submitted by
- Invitrogen Antibodies (provider)
- Main image
- Experimental details
- NULL
- Submitted by
- Invitrogen Antibodies (provider)
- Main image
- Experimental details
- NULL
- Submitted by
- Invitrogen Antibodies (provider)
- Main image
- Experimental details
- NULL
- Submitted by
- Invitrogen Antibodies (provider)
- Main image
- Experimental details
- NULL
- Submitted by
- Invitrogen Antibodies (provider)
- Main image
- Experimental details
- NULL
- Submitted by
- Invitrogen Antibodies (provider)
- Main image
- Experimental details
- NULL

- Submitted by
- Invitrogen Antibodies (provider)
- Main image
- Experimental details
- NULL
- Submitted by
- Invitrogen Antibodies (provider)
- Main image
- Experimental details
- NULL
- Submitted by
- Invitrogen Antibodies (provider)
- Main image
- Experimental details
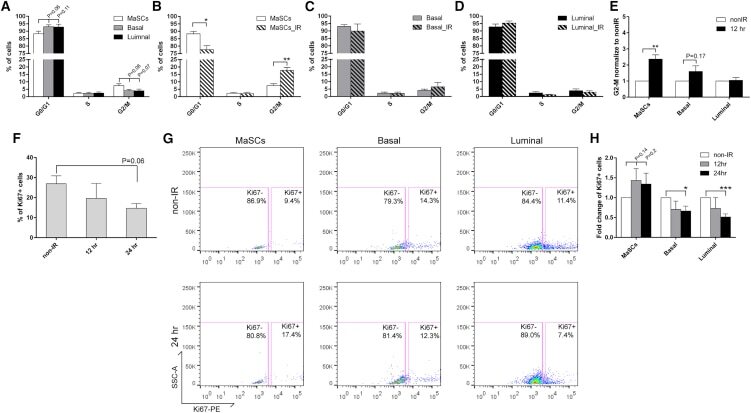
- Figure 2 Wild-Type MaSCs Exhibit Increased G2 Arrest and Evade Damage-Induced Quiescence after IR (A) Cell-cycle distributions of different subpopulations from MECs before IR were examined using PI staining (data are represented as mean +- SEM; n = 5). (B) A significant increase of cells in G2/M was observed in MaSCs 12 hr after IR (data are shown as mean +- SEM; n = 3; ** p < 0.01; * p < 0.05). (C and D) The cell-cycle profiles of basal and luminal compartments before and 12 hr after IR (data are shown as mean +- SEM; n = 3). (E) The fold change of cells in G2/M phase 12 hr after IR as compared to non-IR samples (data are shown as mean +- SEM; n = 3; ** p < 0.01). (F) Percentage of Ki67-positive MECs before and after IR (data are shown as mean +- SEM; n = 3). (G) Representative FACS plots of Ki67 in different subpopulations before and after IR. (H) Quantification of Ki67 positivity shows that basal and luminal cells became significantly more quiescent after IR (data are shown as mean +- SEM; n = 3; *** p < 0.001; * p < 0.05).
- Submitted by
- Invitrogen Antibodies (provider)
- Main image
- Experimental details
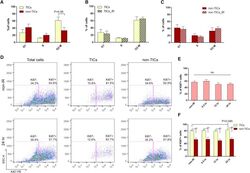
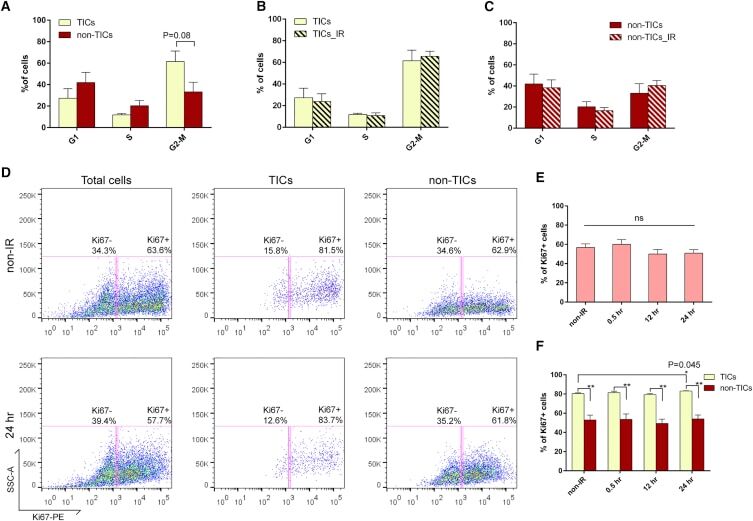
- Figure 6 p53- Tumor Cells Are Highly Proliferative and Fail to Exhibit Proper Cell-cycle Regulation after IR (A) Cell-cycle distribution of TICs and non-TICs before IR (data are shown as mean +- SEM; n = 4). (B and C) Twelve hours after IR, both subpopulations exhibit similar cell-cycle profiles as compared to their non-IR counterparts (data are shown as mean +- SEM; n = 4). (D) Representative FACS plots of Ki67 staining in total tumor cells, TICs, and non-TICs before and after IR. (E) Percentage of Ki67-positive cells in total tumor cells before and after IR (data are shown as mean +- SEM; n = 3). (F) Percentage of Ki67-positive cells in TICs and non-TICs before and after IR (data are shown as mean +- SEM; n = 3; * p < 0.05; ** p < 0.01).
- Submitted by
- Invitrogen Antibodies (provider)
- Main image
- Experimental details
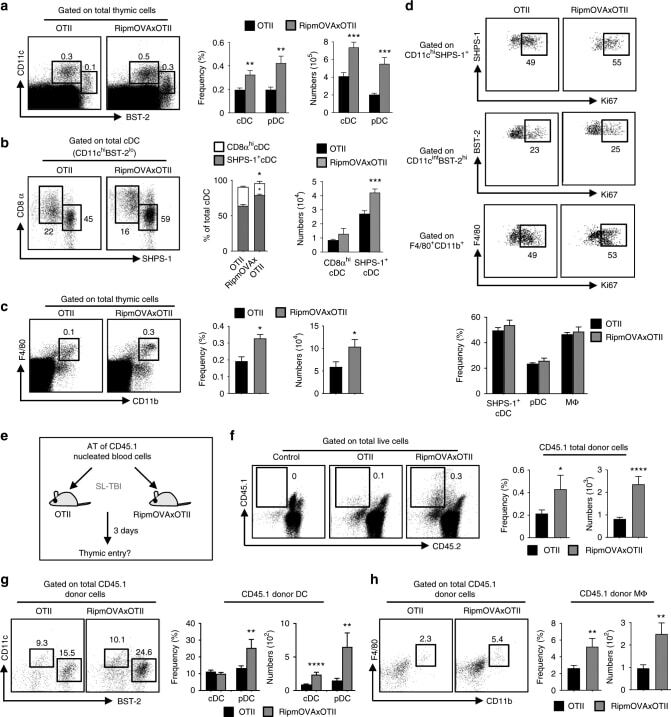
- Fig. 1 Ag-specific interactions between mTECs and CD4 + T cells increase the thymic entry of circulating DCs and macrophages. a - c Flow cytometry profiles, frequencies and numbers of cDCs (CD11c hi BST-2 lo ), pDCs (CD11c int BST-2 hi ) ( a ), resident cDCs (CD8alpha hi SHPS-1 - ), migratory cDCs (CD8alpha lo SHPS-1 + ) ( b ) and macrophages (F4/80 + CD11b + ) ( c ) in the thymus from OTII- Rag2 -/- and RipmOVAxOTII- Rag2 -/- mice. Data are representative of three independent experiments ( n = 3 mice per group and per experiment). d Flow cytometry profiles and frequencies of proliferating Ki-67 + thymic DC subsets and macrophages. Data are representative of two independent experiments ( n = 3 mice per group and per experiment). e Experimental setup: nucleated blood cells from CD45.1 WT congenic mice were adoptively transferred into sublethally irradiated CD45.2 OTII- Rag2 -/- and RipmOVAxOTII- Rag2 -/- recipients. Three days after i.v . adoptive transfer (AT), the thymic entry of DCs and macrophages of CD45.1 donor origin was analysed. SL-TBI: sublethal total body irradiation. f - h Flow cytometry profiles, frequencies and numbers of CD45.1 total donor cells ( f ) as well as cDCs, pDCs ( g ) and macrophages ( h ) of CD45.1 donor origin in the thymus from OTII- Rag2 -/- and RipmOVAxOTII- Rag2 -/- recipients. Control: non-injected irradiated OTII- Rag2 -/- mice. Data are representative of three independent experiments ( n = 3-4 mice per group and per experiment). d , h MPhi: m
- Submitted by
- Invitrogen Antibodies (provider)
- Main image
- Experimental details
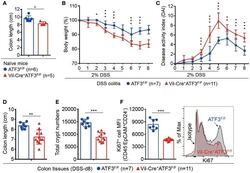
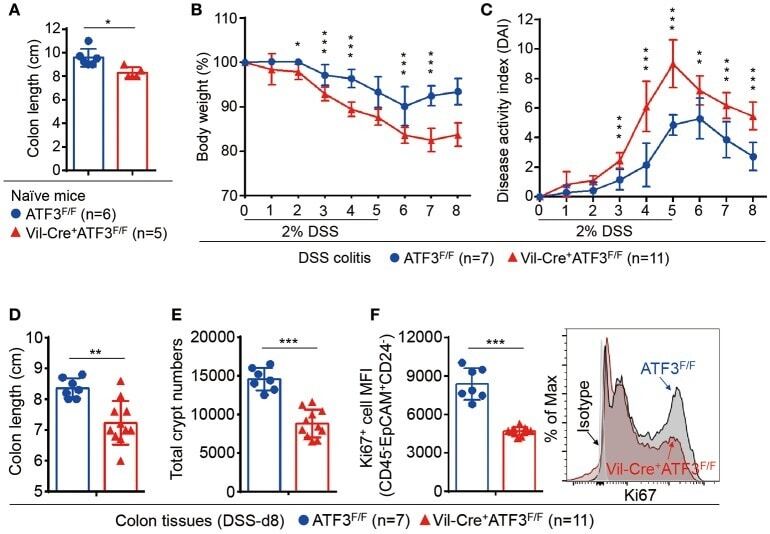
- Figure 4 Epithelial ATF3 is required for protection against DSS colitis. (A) Comparison of colon length between 3-month-old naive mice as indicated. (B-F) Analysis of colitis severity during DSS treatment. (B) Percentage of body weight loss during DSS colitis. (C) Disease activity index (weight loss percentage, stool consistency, and blood in stools) was indicated in each group of mice during DSS colitis. (D) Colon length, (E) total colon crypt numbers, and (F) Ki67 + proliferating crypt cells by flow cytometry analysis, were measured at day-8 post DSS treatment. Results were from two independent experiments. ""n"" refers to the number of mice analyzed. Statistical analysis was done using Multiple T -test on Prism software. * P < 0.05, ** P < 0.005, *** P < 0.0005.
- Submitted by
- Invitrogen Antibodies (provider)
- Main image
- Experimental details
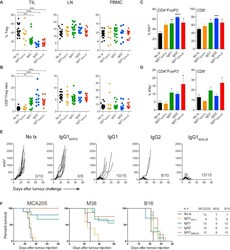
- Figure 4 Intra-tumoral Treg Cell Depletion Is Required for the Anti-tumor Activity of Anti-CTLA-4 Mice were treated with 200 mug of anti-CTLA-4 on days 6 and 9 after s.c. inoculation of MCA205 tumor cells (n = 9-21). TILs, LNs, and PBMCs were processed on day 11 and stained for flow cytometry analysis. (A) Percentage of FoxP3 + CD4 + Treg cells from total CD4 + T cells. (B) CD8 + /Treg cell ratio in the indicated sites. Horizontal bars represent the mean. (C) Percentage of Ki67-expressing CD4 + FoxP3 - and CD8 + T cells. (D) Percentage of CD4 + FoxP3 - and CD8 + T cells expressing IFNgamma following re-stimulation with phorbol 12-myristate 13-acetate (PMA) and ionomycin; cumulative data of three separate experiments. Error bars show +-SEM. (E and F) hFcgammaR mice were treated with anti-CTLA-4 on days 6, 9, and 12 after s.c. inoculation of MCA205 (50 mug/dose), MC38 (100 mug/dose) or B16 (200 mug/dose) tumor cells. (E) MCA205 tumor growth in individual hFcgammaR mice in each treatment group. Inset numbers show the fraction of mice with complete long-term response. (F) Kaplan-Meier curves demonstrating survival of hFcgammaR mice for each tumor model. The total number of mice in each treatment group is shown at the right. * p < 0.05; ** p < 0.01; *** p < 0.001; **** p < 0.0001. See also Figure S4 .
- Submitted by
- Invitrogen Antibodies (provider)
- Main image
- Experimental details
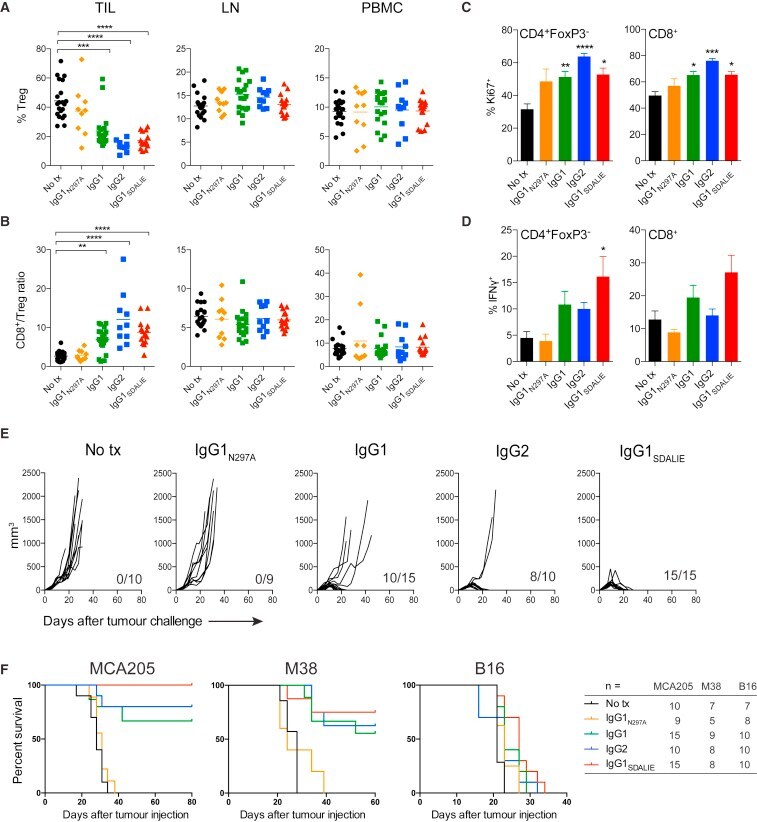
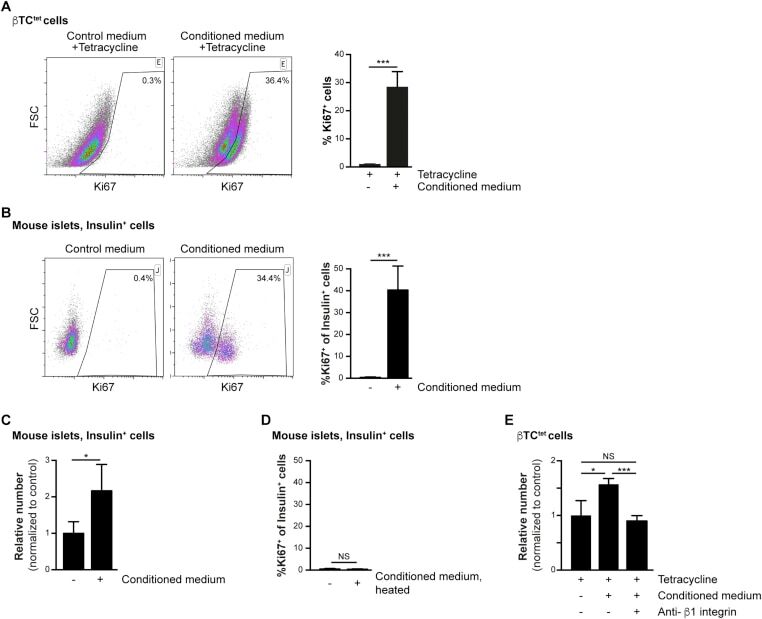
- Figure 2 Increased beta-cell proliferation upon exposure to pericyte-conditioned medium . A ) Tetracycline-treated betaTC-tet cells were cultured in either control (complete DMEM; 'Control medium') or neonatal pericyte-conditioned ('Conditioned medium'; described in Figure 1 B) medium, both supplemented with tetracycline. After incubation for 96 h, cells were fixed and stained for the proliferative marker Ki67. Left , representative dotplots showing flow-cytometry analysis of Ki67 expression by betaTC-tet cells. Gated are Ki67 + cells; the numbers represent the percentage of gated cells out of the analyzed cell population. Right , Bar diagrams (mean +- SD) represent the percentage of Ki67 + cells. N = 3. ***P < 0.005 (Student's t -test), as compared to the control medium. A representative of three independent experiments is shown. B ) Isolated islets from 3-month-old wild-type mice were cultured in either control (complete DMEM; 'Control medium') or neonatal pericyte-conditioned ('Conditioned medium'; described in Figure 1 B) medium for 24 h. Islets were dispersed to single cells, fixed, and stained for insulin and the proliferative marker Ki67. Left , representative dotplots showing flow-cytometry analysis of Ki67 expression by insulin + cells. Gated are Ki67 + cells; the numbers represent the percentage of gated cells out of the total insulin + cell population. Right , Bar diagrams (mean +- SD) represent the percentage of Ki67 +
- Submitted by
- Invitrogen Antibodies (provider)
- Main image
- Experimental details
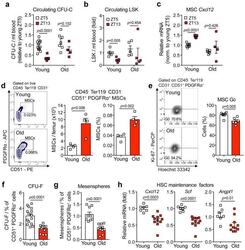
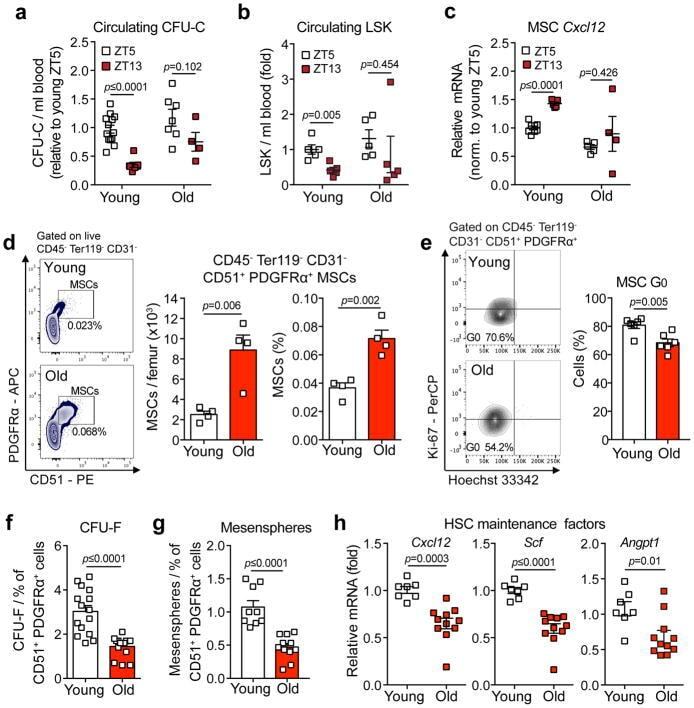
- Figure 3 Aging expands MSCs and reduces their HSC maintenance activity (a, b) Circadian oscillations of circulating CFU-C (normalized to young at ZT5; n=13 young ZT5, 7 old ZT5, 7 young ZT13 and 4 old ZT13 mice) (a) and lineage - Sca-1 + c-Kit + (LSK) progenitors (normalized to young at ZT5; n=5 mice per group) (b) in peripheral blood of young and old C57BL/6 mice. (c) Quantification of Cxcl12 mRNA levels relative to Actb in sorted MSCs from young and old C57BL/6 mice at ZT5 and ZT13 (normalized to young at ZT5; n=8 young ZT5, 5 old ZT5, 5 young ZT13 and 4 old ZT13 mice). (d) Left, representative FACS plots showing the gating strategy for CD45 - Ter119 - CD31 - CD51 + PDGFRalpha + MSCs in young (top) and old (bottom) C57BL/6 mice. Right, absolute numbers and frequency of MSCs in young and old C57BL/6 mice (n=4 mice per group). (e) Left, representative FACS plots showing the gating strategy for MSCs Ki-67 and Hoechst 33342 staining in young (top) and old (bottom) C57BL/6 mice. Right, quantification of Ki-67 - G0 MSCs in young and old C57BL/6 mice (n=6 mice per group). (f, g) Frequency of CFU-F (n=15 cultures per group) (f) and mesenspheres (n=9 young, 11 old cultures) (g) from sorted MSCs plated at equal numbers and clonal densities under CFU-F or mesensphere culture conditions (n=5 mice per group). (h) Quantification of mRNA levels of Cxcl12, Scf and Angpt1 relative to Gapdh in sorted MSCs (normalized to young; n=7 young, 11 old mice)
- Submitted by
- Invitrogen Antibodies (provider)
- Main image
- Experimental details
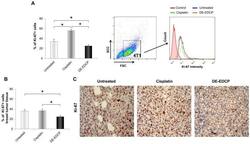
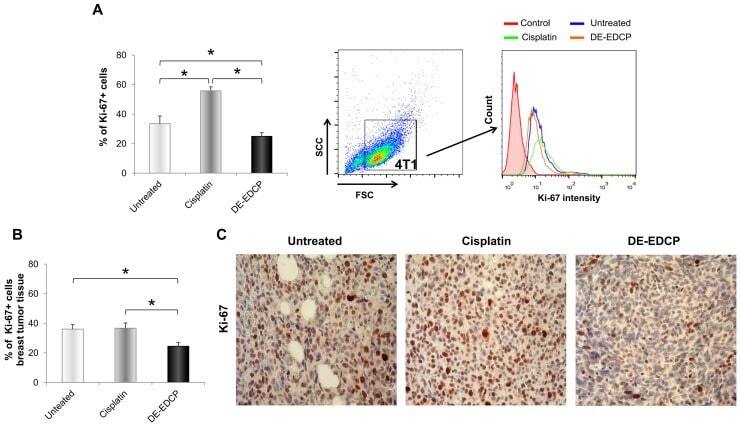
- Figure 6 DE-EDCP treatment attenuates expression of Ki-67 in murine breast cancer (A) Analysis of Ki-67 expression in 4T1 cells exposed to DE-EDCP or cisplatin (31.25 muM) for 24h using flow cytometry by first gaiting out cell debris and cell clumps in forward/side scatter plot. Data are presented as the mean +- SD, ( * DE-EDCP vs. untreated p=0.020; DE-EDCP vs. cisplatin p=0.002; cisplatin vs. untreated p=0.009). Representative histograms of three independent experiments are shown. (B, C) At 36 th day of the experiment, tumors were harvested from tumor-bearing mice treated with DE-EDCP, cisplatin and vehicle and Ki-67 expression was detected using immunohistochemical method. Representative images and quantitative analysis of the percentage of Ki-67- positive cells are shown. Ki-67-positive cells were counted in five random fields (magnification at x 400), and data were summarized as the mean percentage of positive cells (four tumors per group). Data are presented as mean +- SE. ( * DE-EDCP vs. untreated p=0.006; DE-EDCP vs. cisplatin p=0.004)
- Submitted by
- Invitrogen Antibodies (provider)
- Main image
- Experimental details
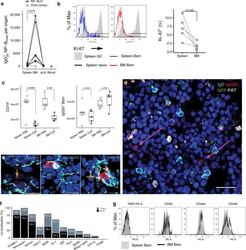
- Fig. 1 The bone marrow contains a major population of isotype-switched non-proliferating memory B cells. a Quantification of NP-specific IgG2a/b + spleen, peripheral lymph nodes, blood and bone marrow (BM) memory B cells. Female C57BL/6 mice immunized with NP-KLH/LPS SC. Numbers of NP-binding IgG2b + cells in Spleen, BM, blood, and peripheral lymph nodes (pLN) determined by flow-cytometry on d421 or d426 post immunization; pooled from two independent experiments. OVA ctrl: staining controls from mice immunized with the irrelevant antigen ovalbumin (OVA). Gated for IgG2b + CD19 + CD38 + CD138 - GL7 - CD11c - IgM - IgD - PI - small lymphocytes (cf. Supplementary Fig. 5 ). Lines connect samples from one individual, paired one-sided t -test for spleen and BM samples. b Flow-cytometric quantification of Ki-67 expression in IgG2b + Bsm (IgG2b + CD19 + CD38 + CD138 - GL7 - CD11c - IgM - IgD - PI - small lymphocytes) splenic naive (IgM + IgD + IgG2b - CD19 + CD38 + CD138 - GL7 - CD11c - PI - small lymphocytes) and germinal center (GC) (CD19 + CD38 lo GL7 + CD11c - PI - lymphocytes) B cells. Frequencies of Ki-67 + cells within the subset, data in right graph from two independent experiments using pooled cells from 4 to 20 C57BL/6 mice, paired one-sided t -test. c Flow-cytometric quantification of CD19 + B cells and IgG2b + memory B cells in female C57BL/6J mice treated with Cyclophosphamide (CyP) or untreated controls (PBS) after immunization with 3x NP-CGG/IFA. Analysis performed aft

- Submitted by
- Invitrogen Antibodies (provider)
- Main image
- Experimental details
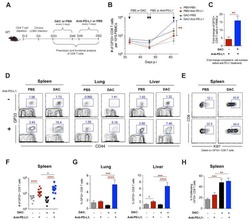
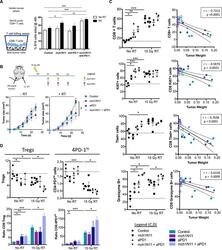
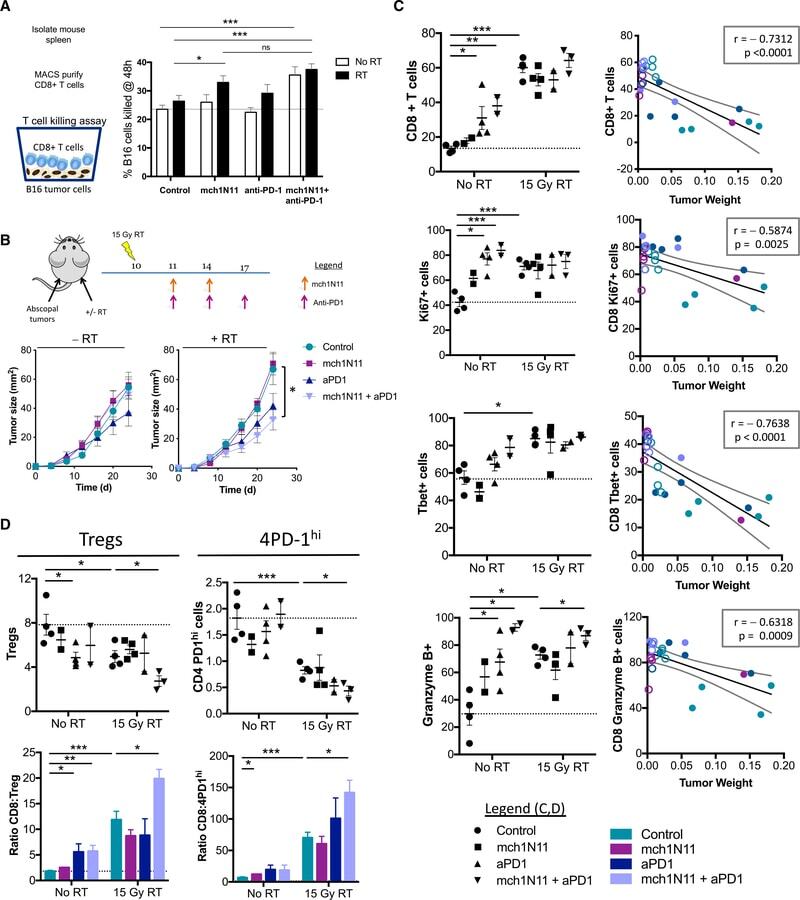
- Figure 6. Targeting PS in Combination with Radiation Therapy and Anti-PD-1 Promotes CD8+ T Cell Activation in the Tumor (A) C57BL/6 mice were injected with B16F10 cells and treated according to the experiment schema outlined in Figure 5 . 10 days after RT, 10 6 CD8+ T cells purified from spleens of treated animals were co-cultured with 10 4 B16 tumor cells as targets for 48 h in 24-well plates for a T cell killing assay as previously described (). Shown are the average percentage +- SEM of B16 cells killed from 5 mice/group. (B) C57BL/6 mice were injected with B16F10 cells on the right hindlimb on day 0 and left flank on day 5 and treated with RT on day 10, as outlined in the schema and described in STAR Methods . Shown are average tumor size (in square millimeters) +- SEM of abscopal tumors only (10 mice/group). Statistics were calculated at day 25 post-tumor implantation. (C and D) C57BL/6 mice were injected with B16F10 cells and treated according to the experiment schema outlined in Figure 5 . 10 days after the initial treatment, tumors were isolated from each treatment group, weighed, and analyzed by flow cytometry. (C) CD8+ T cell infiltration and activation. Left: frequencies of CD8+ T cells in tumors and their activation markers. Right: correlation between frequencies and tumor weight (in grams); closed circles represent no RT, and open circles represent RT groups. (D) Frequencies of CD4+ Foxp3+ Tregs and CD4+ Foxp3- PD-1 hi T cells (CD4+ PD-1 hi or 4PD-1 hi ) infiltra
- Submitted by
- Invitrogen Antibodies (provider)
- Main image
- Experimental details
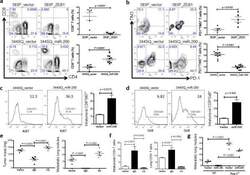
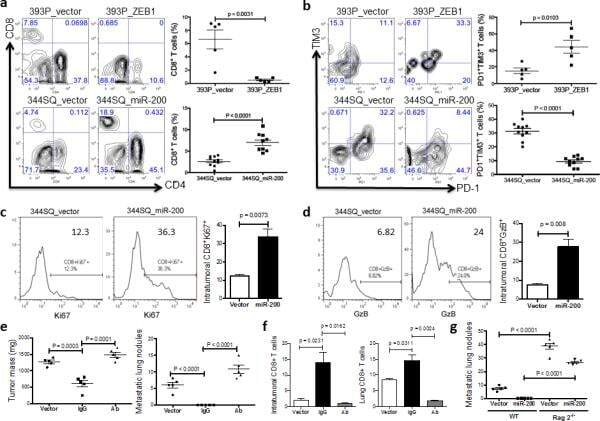
- Figure 4 The miR-200/ZEB1 axis controls tumor metastasis through regulating CD8 + TILs ( a , b ) FACS analysis of ( a ) CD8 + TIL frequency; ( b ) PD1 and TIM3 marker expression on CD8 + T cells from 393P_vector and 393P_ZEB1 (n = 5), as well as 344SQ_vector and 344SQ_miR-200 (n = 10) primary tumors. Analysis was done 2 weeks post-cancer cell injection. ( c , d ) ( c ) Intratumoral Ki67 + CD8 + T cells; ( d ) granzyme B (GzB) + CD8 + T cells in 344SQ_vector or 344SQ_miR-200 primary tumors 6 weeks post-subcutaneous injection of cancer cells into 129/Sv mice. Representative Ki67 or GzB staining in an individual tumor sample is shown on the left, and mean Ki67 + or GzB + populations of gated CD8 + T cells in total T cells are shown on the right (n = 5). ( e ) CD8 + T cell depletion results in tumor growth and metastasis in mice (n = 5) that received subcutaneous tumor cell injections. No treatment (344SQ_vector (Vector)), IgG (344SQ_miR-200 + IgG control), or Ab (344SQ_miR-200 + anti-CD8 Ab). The analysis was done 6 weeks post-injection. ( f ) Relative abundance of CD8 + T cells in the tumor (left) or lung (right) from 129/Sv mice (n =5) with syngeneic control 344SQ tumors (Vector), 344SQ_miR-200 tumors with control IgG treatment (IgG) or anti-CD8 antibody treatment (Ab). ( g ) Lung metastases of 344SQ_vector (Vector) and 344SQ_miR-200 (miR-200) tumors in wild-type (WT) or 129/Sv Rag2 -/- ( Rag2 -/- ) mice (n = 5). The analysis was done 6 weeks post-tumor cell subcutaneous injec
- Submitted by
- Invitrogen Antibodies (provider)
- Main image

- Experimental details
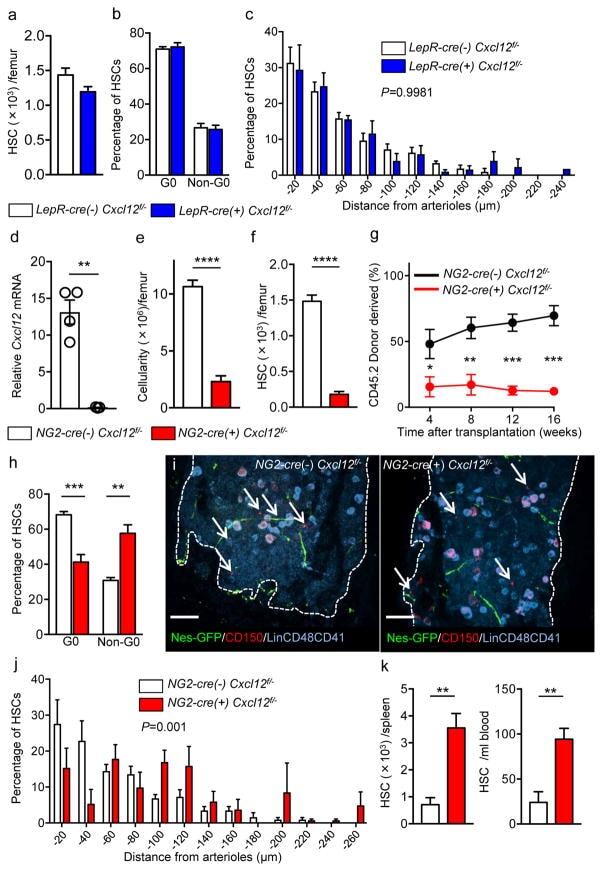
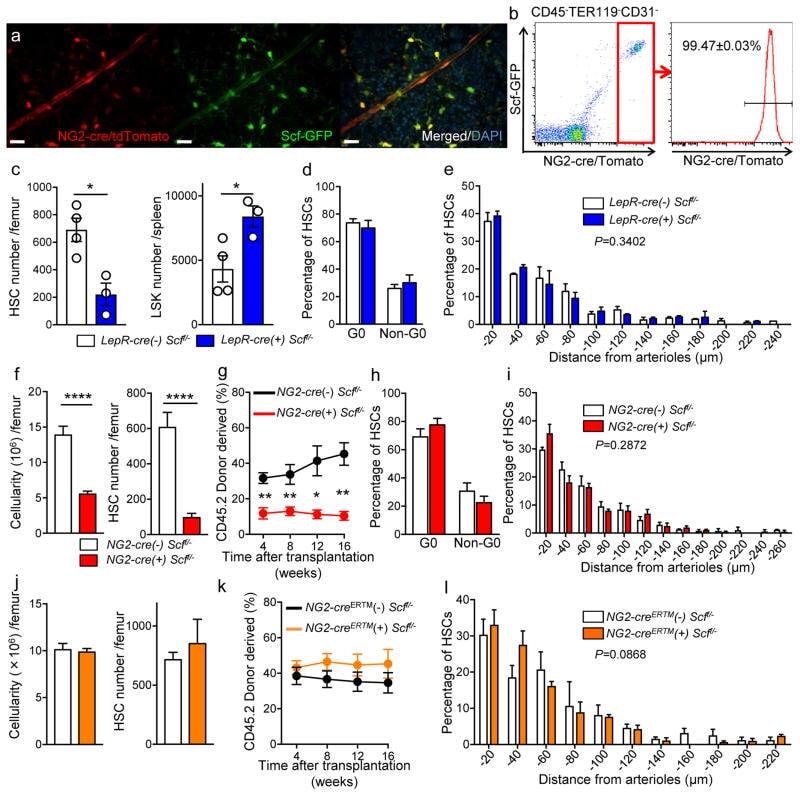
- Figure 3 Cxcl12 from distinct peri-vascular niche cells contributes differentially to HSC functions (a-c) Analyses of LepR-cre/ Cxcl12 fl/- mice. (a) Absolute numbers of HSCs in BM. n=6 mice for each group. (b) FACS analyses of cell cycle of HSCs with Ki-67 and Hoechst 33342 staining. n=5 mice per group. (c) HSC localization relative to arterioles. Error bars: n=3 mice. The p value has been calculated using n=129 HSCs for cre (-), 160 HSCs for cre (+), pooled from 3 mice per group. P =0.9981. (d-k) Analyses of NG2-cre / Cxcl12 flox/-. mice (d) Cxcl12 mRNA expression relative to beta-actin in CD45 - TER119 - CD31 - Nes-GFP + cells from NG2-cre(-) Cxcl12 f/- and NG2-cre(+) Cxcl12 f/- mice. n=4 mice for cre (-), n=3 mice for cre (+), from two independent experiments. (e,f) Bone marrow cellularity (e) and absolute numbers of phenotypic CD150 + CD48 - Lineage - Sca-1 + c-kit + (LSK) HSCs (f) per one femur. n=10 mice. (g) Percentages of donor-derived cells after competitive reconstitution. n=5 mice per group. (h) Quantification of cell cycle of HSCs with Ki-67 and Hoechst 33342 staining. n=5 mice for cre (-), n=7 mice for cre (+). (i) Representative images of whole-mount immunofluorescent staining of the sternal bone marrow from 3 mice. Arrows indicate CD150 + CD48 - CD41 - Lineage - HSCs. Dashed lines depict the border between bone and bone marrow. Scale bars, 100 muH. (j) HSC localization relative to arterioles. Error bars: n=3 mice for cre (-), n=4 mice for cre (+). The p value
- Submitted by
- Invitrogen Antibodies (provider)
- Main image
- Experimental details
- Figure 5 NG2-cre, but not NG2-cre ERTM , targeted cells are the source of Scf in the bone marrow (a) Whole-mount sternum from NG2-cre/ iTdTomato/ Scf-GFP mice, anti-VE-cadherin. Representative images from 3 mice. Scale bars, 20 mum. (b) Representative FACS plot showing percentage of NG2-cre/ iTdTomato + cells within CD45 - TER119 - CD31 - Scf-GFP + cells. n=3 mice. (c-e) Analyses of LepR-cre/ Scf fl/- mice. (c) Numbers of HSCs (left) in BM and LSK cells in spleen (right). n=4 mice for cre (-), n=3 mice for cre (+). (d) FACS analyses of HSC (CD150 + CD48 - LSK) cell cycle with Ki-67 and Hoechst 33342 staining. n=5 mice for cre (-), n=6 mice for cre (+). (e) HSC localization relative to arterioles. Error bars: n=3 mice. P value has been calculated using n=272 HSCs for cre (-), 293 HSCs for cre (+) pooled from 3 mice per group. P =0.3402. (f-i) Analyses of NG2-cre/ Scf fl/- mice. (f) Numbers of total BM cells (left) and CD150 + CD48 - LSK HSCs (right) in BM. n=5 mice for cre (-), n=7 mice for cre (+). (g) Percentages of donor-derived cells after competitive reconstitution. n=5 mice for cre (-), n=7 mice for cre (+). (h) FACS analyses of HSC cell cycle with Ki-67 and Hoechst 33342 staining. n=6 mice for cre (-), n=7 mice for cre (+). (i) HSC localization relative to arterioles. Error bars: n=3 mice. P value has been calculated using n=224 HSCs for cre (-), 274 HSCs for cre (+) pooled from 3 mice per group. P =0.2872. (j-l) Analyses of NG2-cre ERTM / Scf fl/- mice. (j) Absolute nu
- Submitted by
- Invitrogen Antibodies (provider)
- Main image
- Experimental details
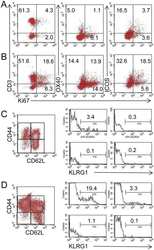
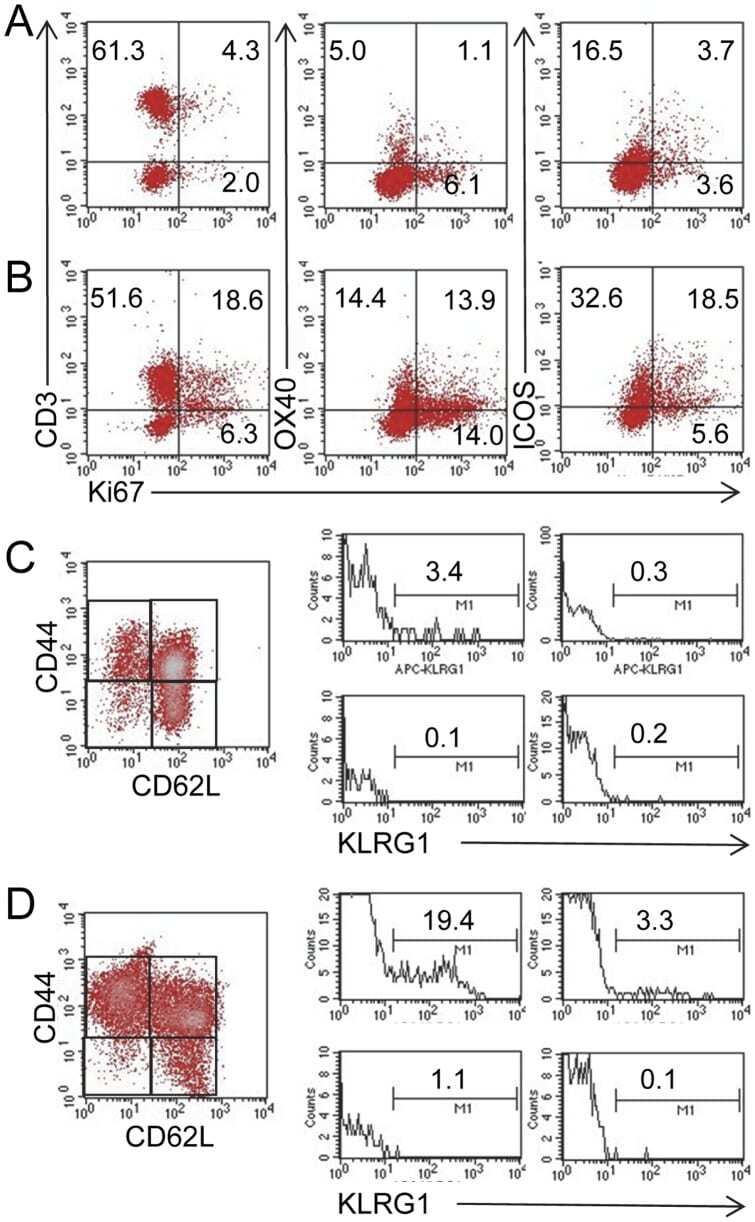
- Figure 5 MLN cells from Roquin san/san mice are proliferative and have more SLECs. Based on Ki67 staining, (panel B ) a greater proportion of OX40 + cells and ICOS + MLN cells were proliferating T cells compared to MLN cells from (panel A ) normal mice. Representative staining from 1 normal and 2 Roquin san/san mice. Similarly, there was a greater proportion of CD44 hi CD62L lo KLRG1 + SLECs present in MLN cells of (panel D ) Roquin san/san mice compared to (panel C ) normal mice. Representative data from 3 normal and 3 Roquin san/san mice.
- Submitted by
- Invitrogen Antibodies (provider)
- Main image
- Experimental details
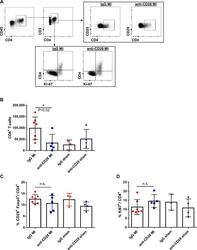
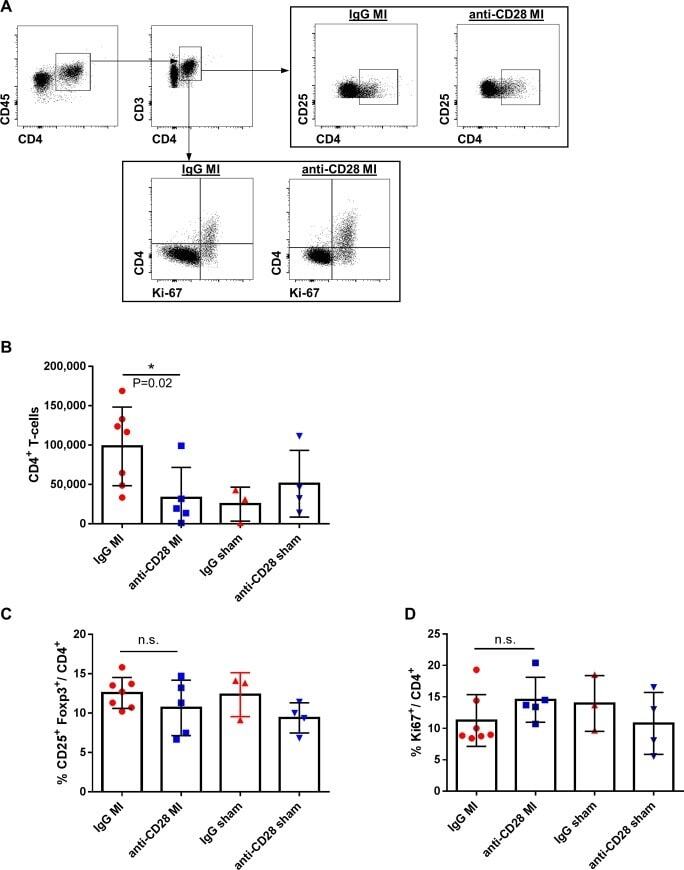
- Fig 4 Flow cytometric gating strategy (A) and quantitative analysis of CD4 + T-cell subsets in mediastinal lymph nodes (B-D) after MI or sham operation and anti-CD28 or IgG mAb administration 5 days after surgery. (* P
- Submitted by
- Invitrogen Antibodies (provider)
- Main image

- Experimental details
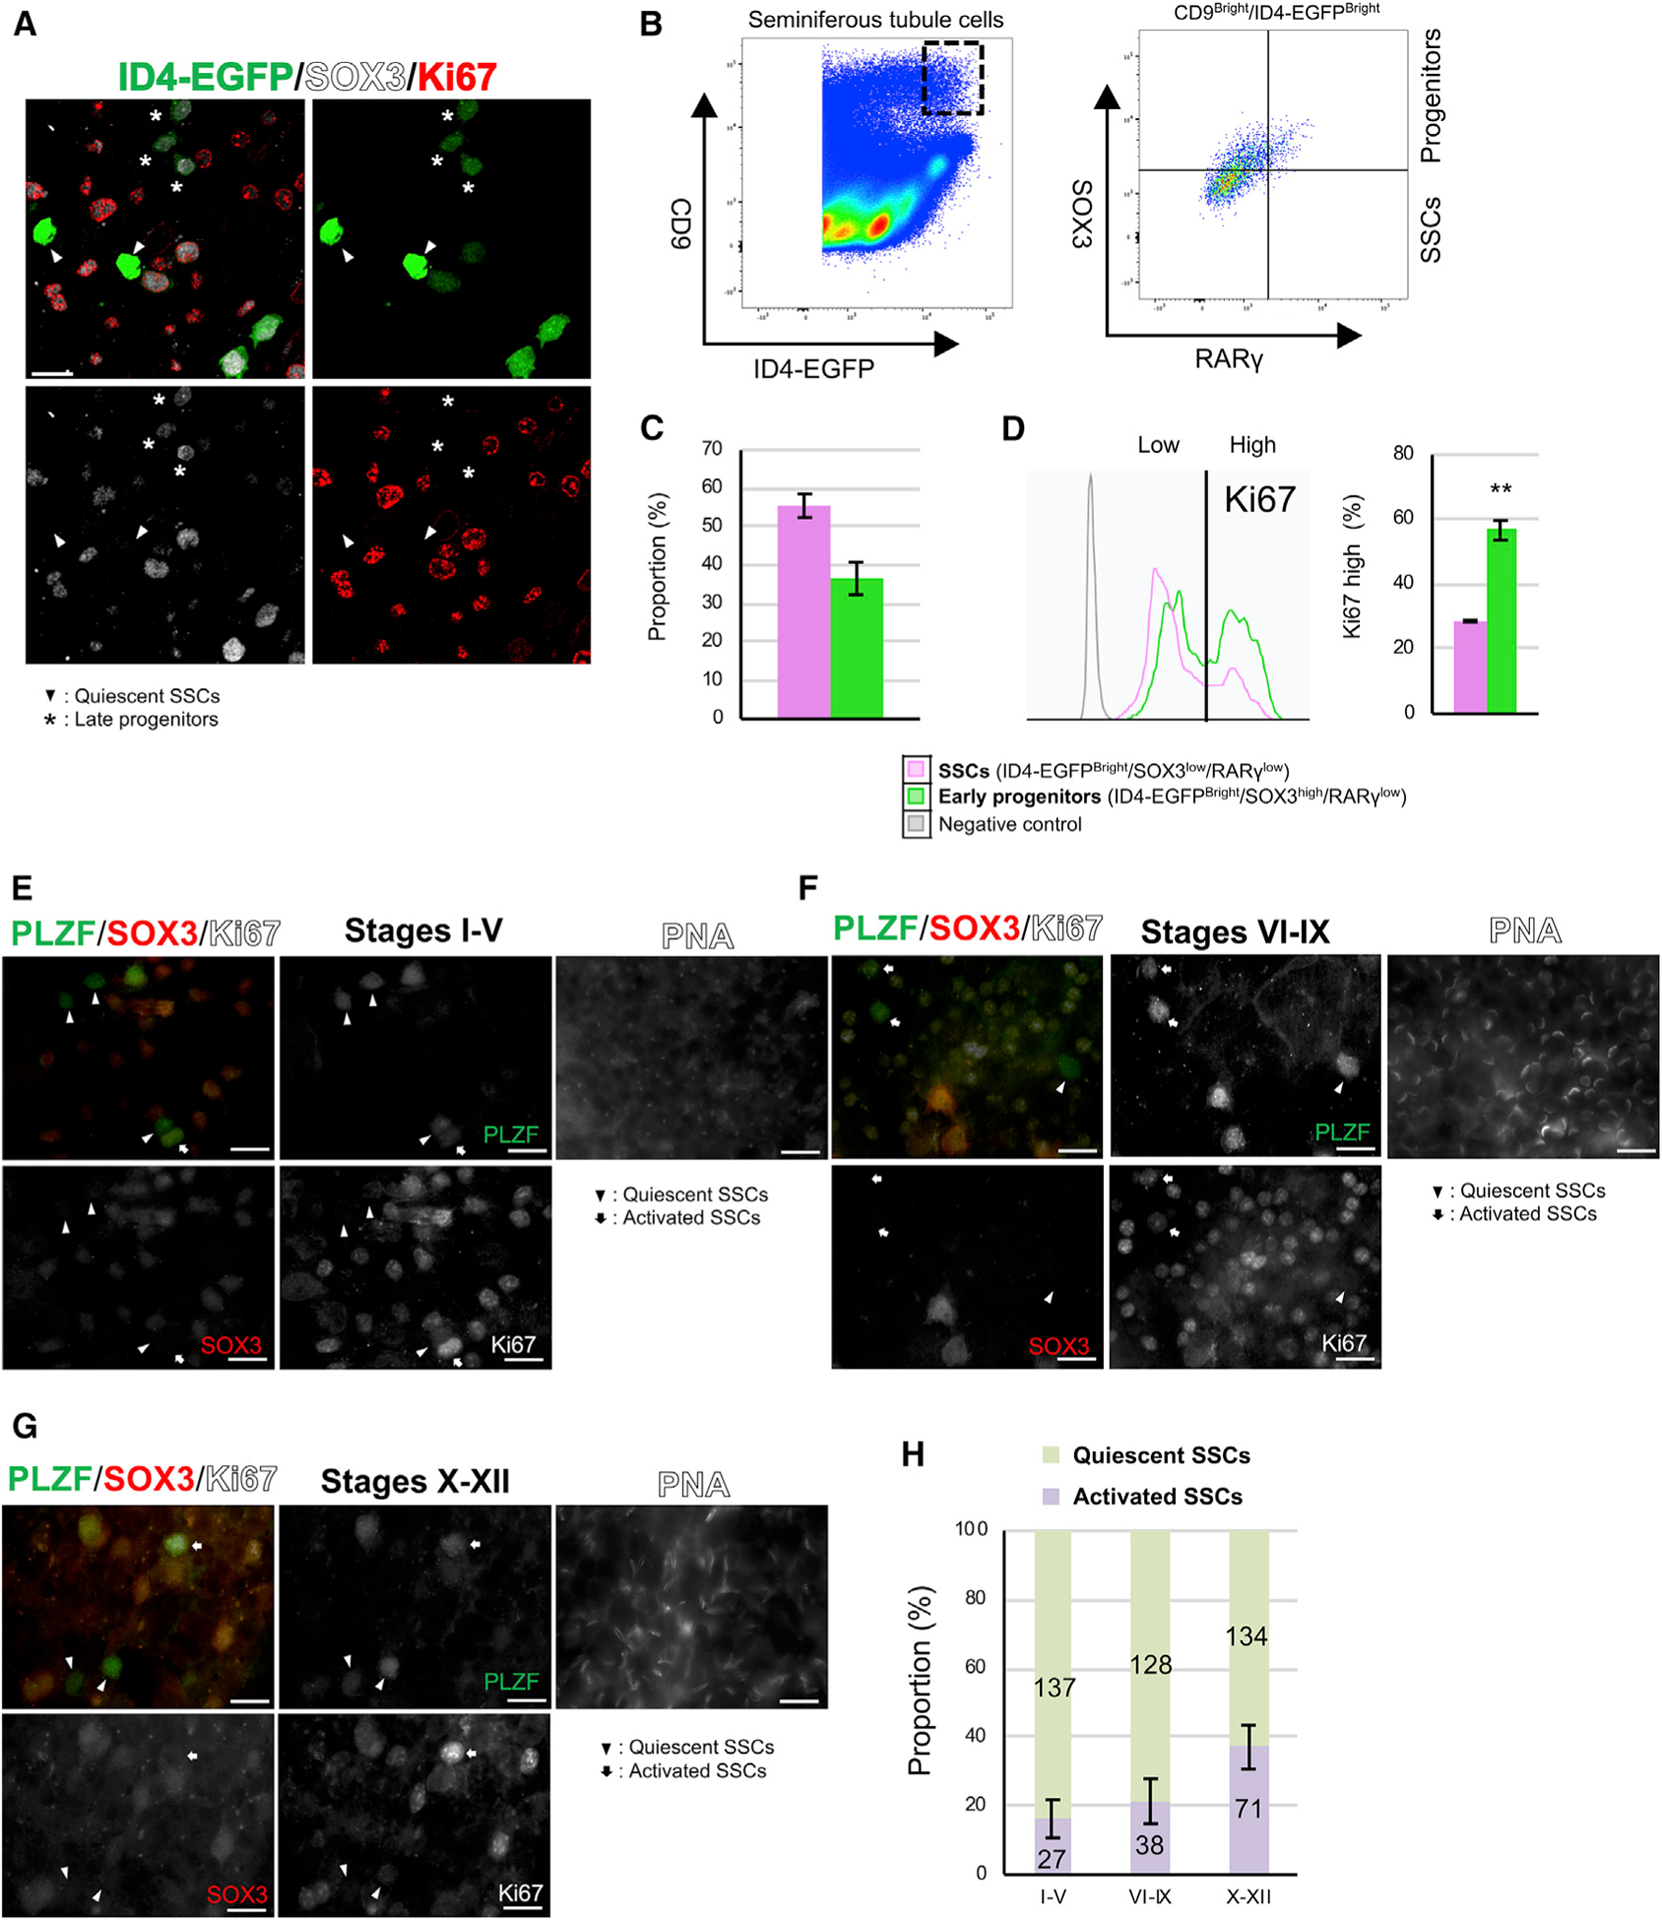
- Figure 2. Cell-cycle-activated and quiescent SSCs are present throughout the cycle of the seminiferous epithelium in vivo (A) Whole-mount immunofluorescence (WM-IIF) of SOX3 (white) and Ki67 (red), together with ID4-EGFP epifluorescence (green) in seminiferous tubules from adult Id4 - Egfp mice. Scale bar, 20 mum. Arrowhead, quiescent SSCs (ID4-EGFP Bright /SOX3-/Ki67-); asterisk, late progenitors (ID4-EGFP Dim /SOX3+/Ki67-). (B) Flow cytometry analysis of adult Id4 - Egfp mouse seminiferous tubule cells sequentially gated for SSC-enriched CD9 Bright /ID4-EGFP Bright spermatogonia (left) and SOX3 and RARgamma staining (right). Figure S3H shows negative controls. (C) Quadrant statistics from the right panel of (B). Data are mean +- SEM (n = 3 adult Id4-Egfp mice). (D) Quantification of Ki67 staining intensity in cells from (B) grouped by ID4-EGFP Bright /SOX3 low /RARgamma low (SSCs) or ID4-EGFP Bright /SOX3 high /RARgamma low (early progenitors). Data are mean +- SEM. Two-tailed Student''s t test (**p < 0.01). (E-G) WM-IIF of PLZF (green), SOX3 (red), Ki67 (white), and peanut agglutinin (PNA) in adult C57BL/6 mice (n = 4). Scale bar, 20 mum. Arrowhead, quiescent SSCs (PLZF+/SOX3-/Ki67-); arrow, activated SSCs (PLZF+/SOX3-/Ki67+). (H) Proportion of quiescent SSCs and activated SSCs in each stage from (E) and (F). Data are mean +- SEM. The proportion of Ki67+ SSCs was not significantly different according to ANOVA (p = 0.093).
- Submitted by
- Invitrogen Antibodies (provider)
- Main image
- Experimental details
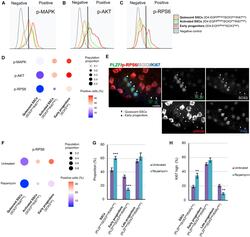
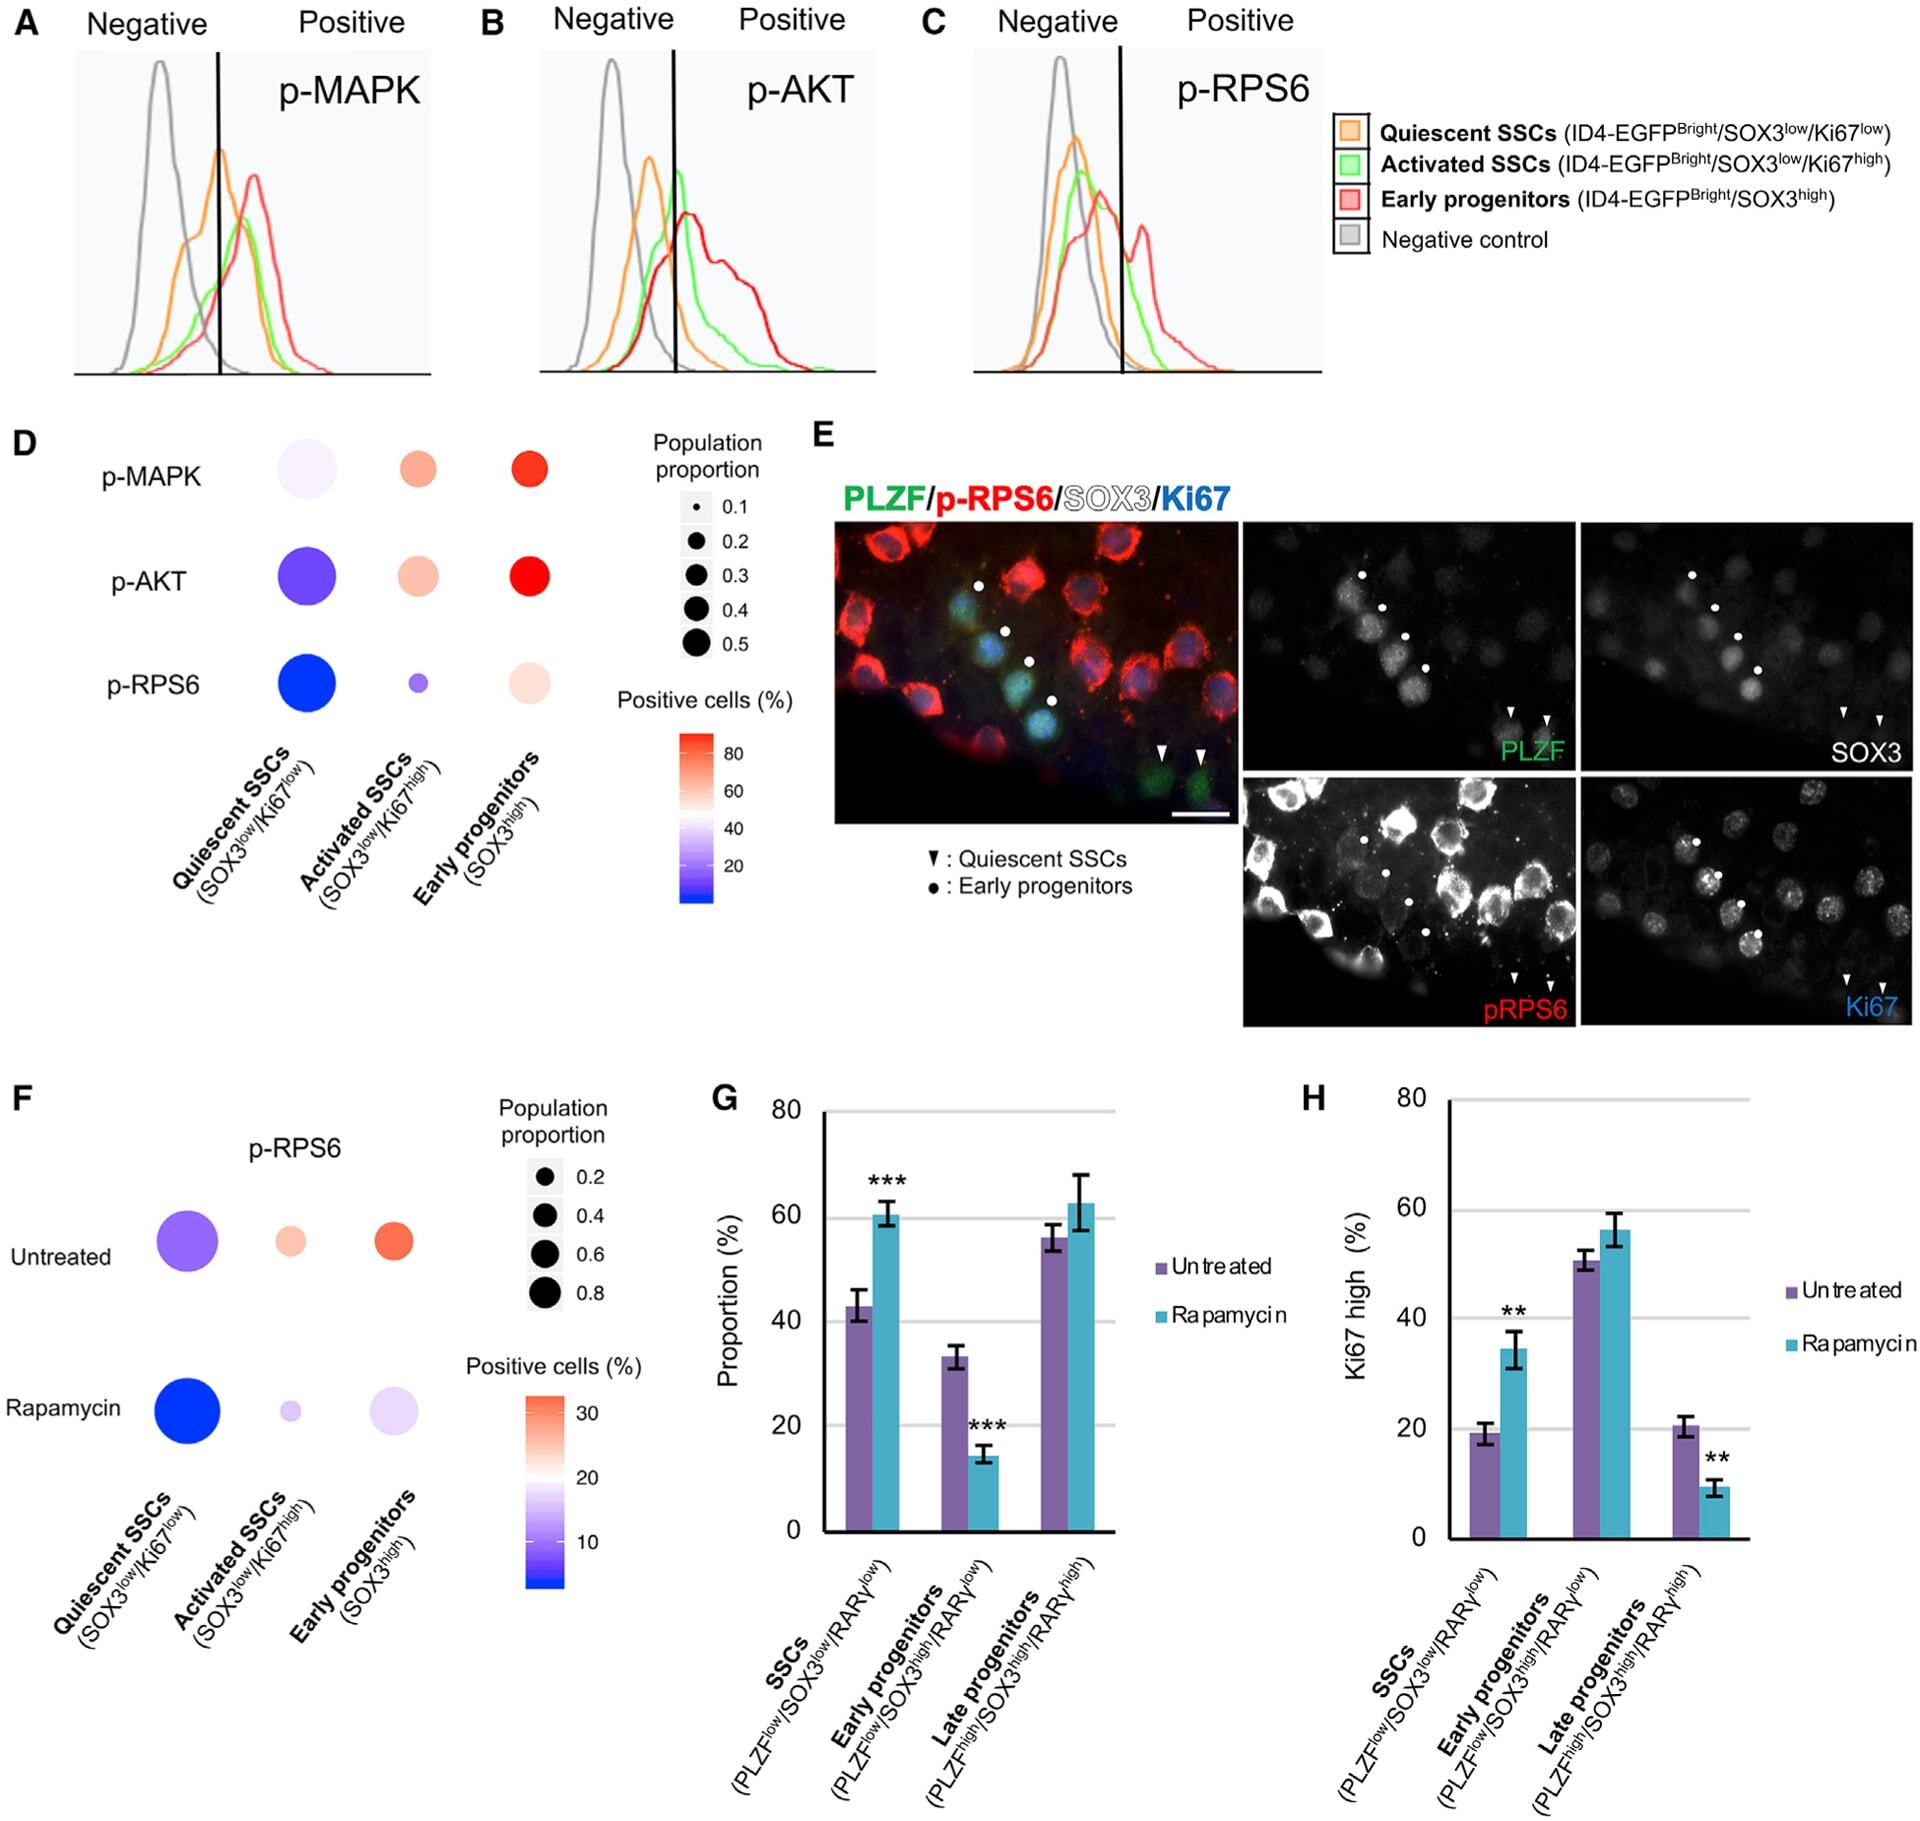
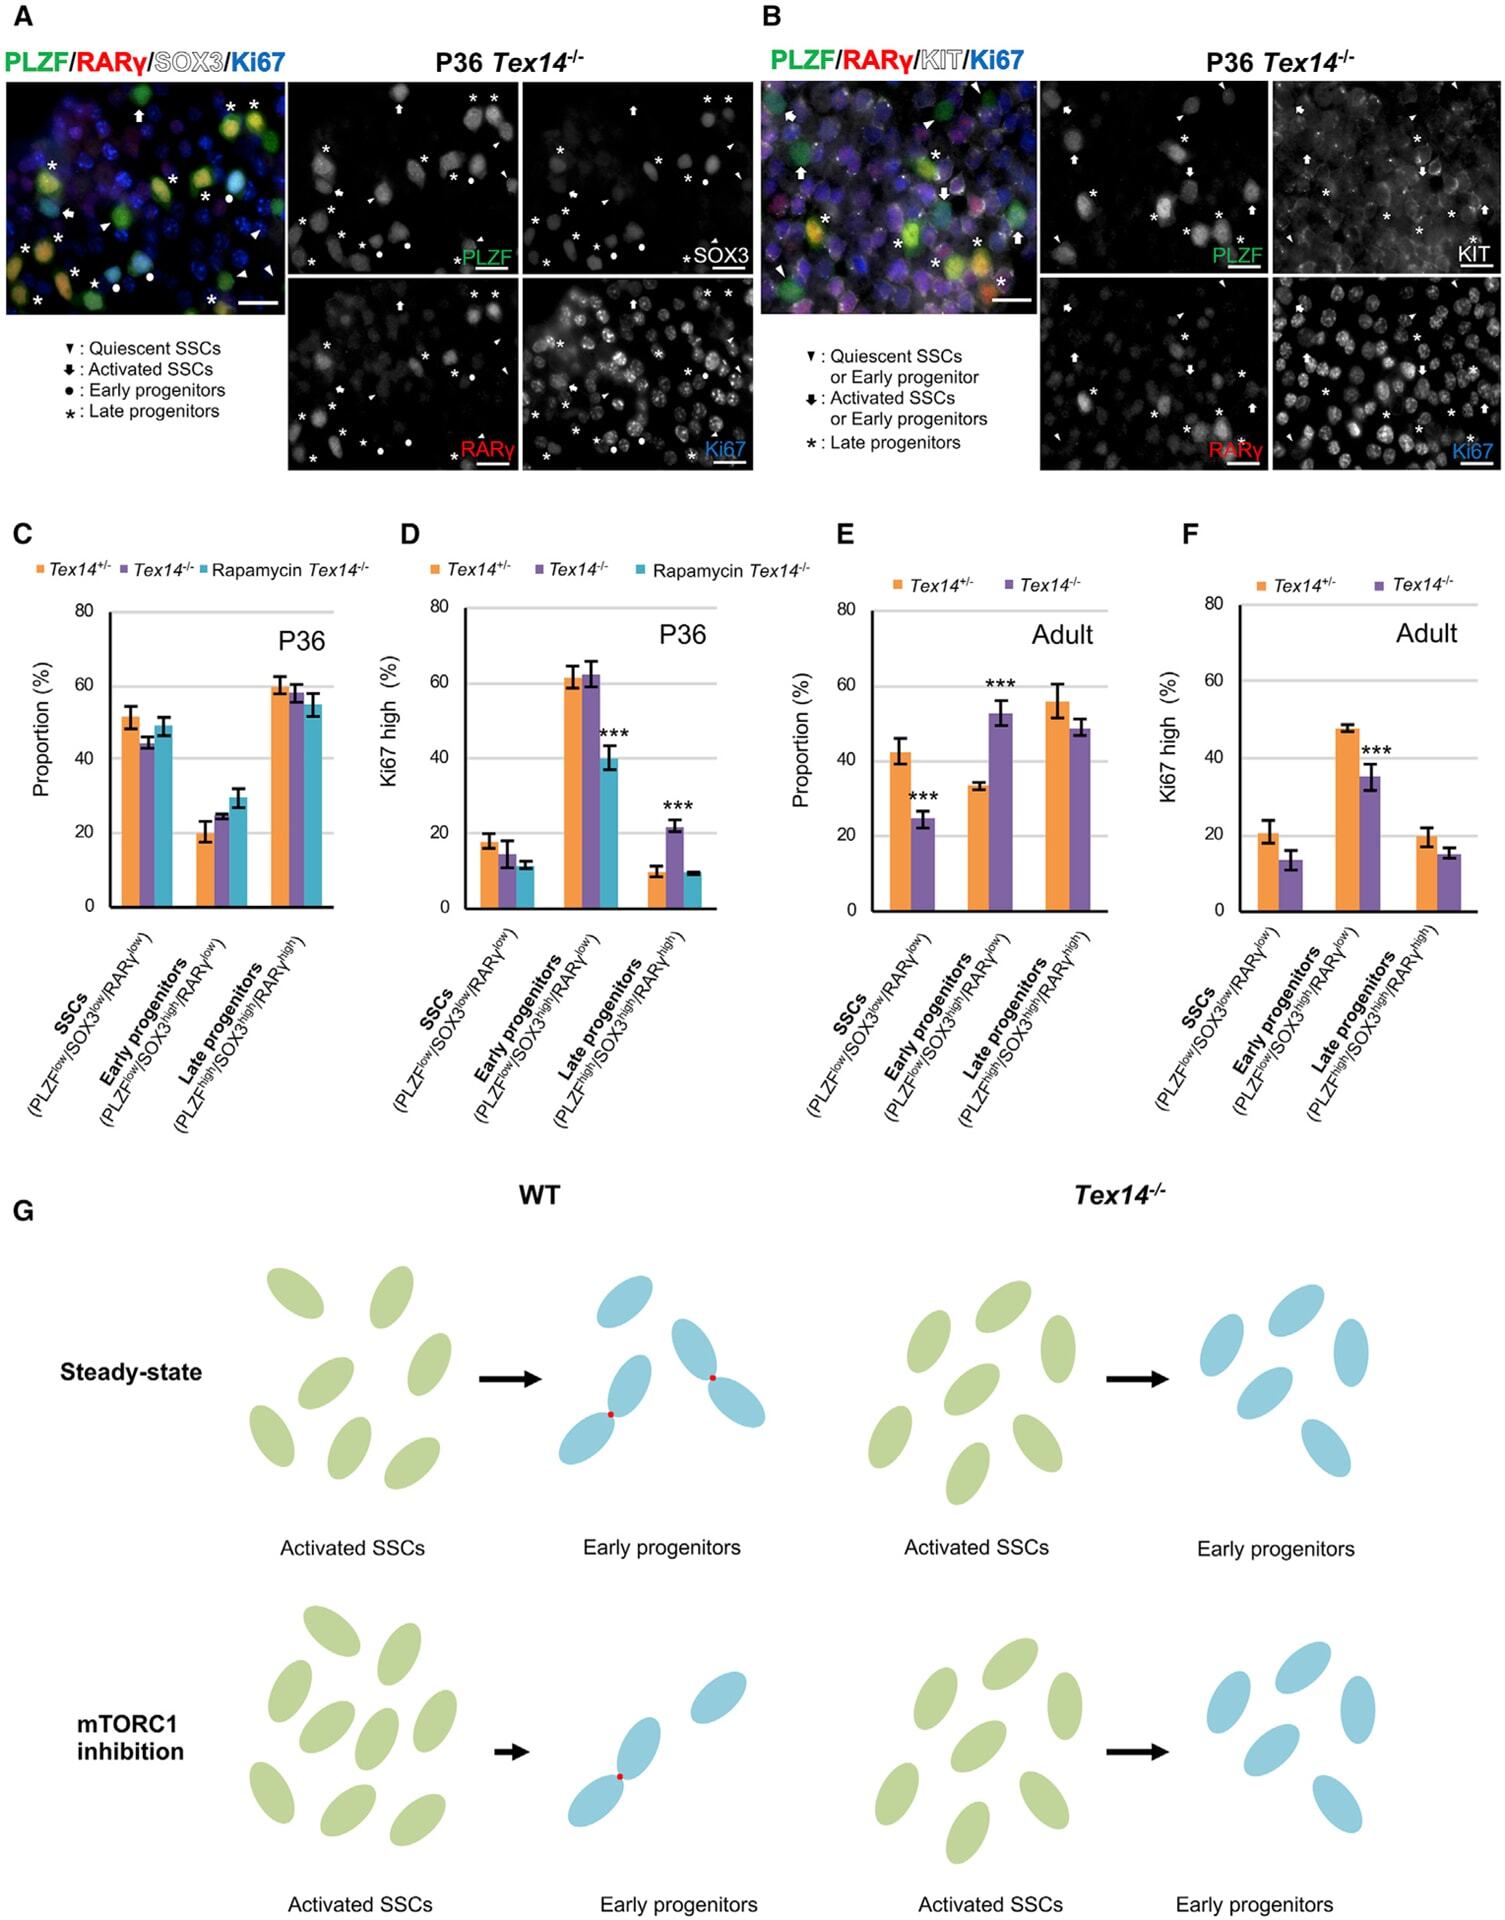
- Figure 3. Signaling pathways that regulate transitions in cell state among mouse SSCs and progenitors (A-C) Phosphorylated MAPK (phospho-MAPK) (A), phosphorylated AKT (phospho-AKT) (B), and p-RPS6 (C) levels in isolated seminiferous tubule cells from adult Id4-Egfp mice gated for quiescent SSCs (ID4-EGFP Bright /SOX3 low /Ki67 low , orange), activated SSCs (ID4-EGFP Bright /SOX3 low /Ki67 high , green), and early progenitors (ID4-EGFP Bright /SOX3 high , red) compared with unstained negative control cells (gray). Gating controls are in Figure S3H . (D) Quantification of flow cytometry from (A)-(C) (n = 3 adult Id4-Egfp mice). Dot size, proportion of undifferentiated spermatogonia; color, percentage that are marker positive. (E) WM-IIF of PLZF (green, spermatogonia), p-RPS6 (red, mTORC1 activity), SOX3 (white, early/late progenitors), and Ki67 (blue, proliferation) in adult C57BL/6 mice. Arrowhead, quiescent SSCs (PLZF+/SOX3-/Ki67-); circle, early progenitors (PLZF+/SOX3+/Ki67+). Scale bar, 20 mum. (F) Quantification of p-RPS6 levels in quiescent SSCs (ID4-EGFP Bright /SOX3 low /Ki67 low ), activated SSCs (ID4-EGFP Bright /SOX3 low /Ki67 high ), and early progenitors (ID4-EGFP Bright /SOX3 high ) in untreated and rapamycin-treated adult Id4-Egfp mice (n = 3 adult Id4-Egfp mice). Dot size, proportion of undifferentiated spermatogonia; color, percentage marker positive. (G) Proportion of SSCs (KIT-/PLZF low /SOX3 low /RARgamma low ), early progenitors (KIT-/PLZF low /SOX3 high /
- Submitted by
- Invitrogen Antibodies (provider)
- Main image

- Experimental details
- Figure 5. mTORC1 inhibition fails to drive activated SSC accumulation and early progenitor depletion in the absence of intercellular bridges (A and B) WM-IIF of PLZF (green, spermatogonia), RARgamma (red, late progenitors), SOX3 (white, early/late progenitors) or KIT (white, differentiating spermatogonia), and Ki67 (blue, proliferation) in seminiferous tubules from P36 Tex14 -/- mice. Arrowhead, quiescent SSCs (PLZF+/SOX3-/RARgamma/Ki67-) or early progenitors (PLZF+/KIT-/RARgamma-/Ki67-); arrow, activated SSCs (PLZF+/SOX3-/RARgamma-/Ki67+) or early progenitors (PLZF+/KIT-/RARgamma-/Ki67+); circle, early progenitors (PLZF+/SOX3+/RARgamma-/Ki67+); asterisk, late progenitors (PLZF+/SOX3+ or KIT-/RARgamma+/Ki67-). Scale bar, 20 mum. (C) Proportion of SSCs (KIT-/PLZF low /SOX3 low /RARgamma low ), early progenitors (KIT-/PLZF low /SOX3 high /RARgamma low ), and late progenitors (KIT-/PLZF high /SOX3 high /RARgamma high ) in seminiferous tubule cells from control (n = 3) and rapamycin-treated (n = 3) Tex14 -/- mice at P36 (see controls in Figure S3J ). Data are mean +- SEM. (D) Ki67 staining intensity in SSCs (KIT-/PLZF low /SOX3 low /RARgamma low ), early progenitors (KIT-/PLZF low /SOX3 high /RARgamma low ), and late progenitors (KIT-/PLZF high /SOX3 high /RARgamma high ) in seminiferous tubule cells from Tex14 +/- , Tex14 -/- , and rapamycin-treated Tex14 -/- mice (n = 3 each) at P36 (see controls in Figure S3J ). Data are mean +- SEM. Two-tailed Student''s t test (***p < 0.001)
- Submitted by
- Invitrogen Antibodies (provider)
- Main image
- Experimental details
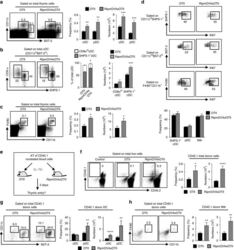
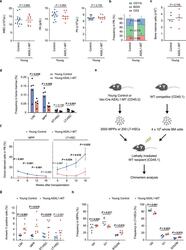
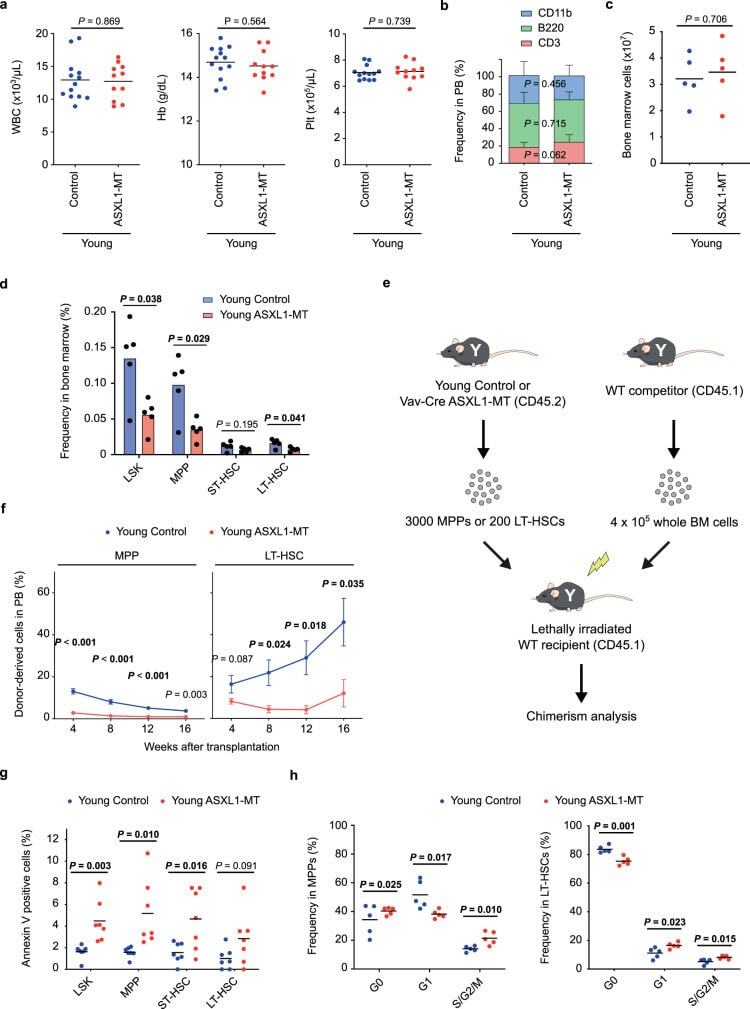
- Fig. 1 ASXL1-MT causes dysfunction of HSPCs associated with increased apoptosis and altered cell cycle status. a Enumeration of white blood cells (WBC), hemoglobin (Hb), and platelets (Plt) in peripheral blood of young Vav-Cre ASXL1-MT KI mice ( n = 13 (Control), 11 (ASXL1-MT)). b Frequency of myeloid cells (CD11b + ), B cells (B220 + ), and T cells (CD3 + ) in peripheral white blood cells of young Vav-Cre ASXL1-MT KI mice ( n = 13 (Control), 11 (ASXL1-MT)). c Absolute numbers of bone marrow cells per leg in young Vav-Cre ASXL1-MT KI mice ( n = 5). d Frequency of LSK cells, multipotent progenitors (MPPs), short-term HSCs (ST-HSCs) and long-term HSCs (LT-HSCs) in bone marrow cells of young Vav-Cre ASXL1-MT KI mice ( n = 5). e The experimental design for competitive transplantation assays. 3000 MPPs or 200 LT-HSCs isolated from young control or young Vav-Cre ASXL1-MT KI mice were transplanted into lethally irradiated recipient mice with 4 x 10 5 whole bone marrow cells. f Levels of donor chimerism in peripheral blood were analyzed at the indicated weeks after transplantation ( n = 3 (Control), 4 (ASXL1-MT)). Data are mean +- s.e.m. g Apoptosis analysis of HSPCs of young Vav-Cre ASXL1-MT KI mice ( n = 7). h Cell cycle analysis with Ki-67/DAPI staining of MPPs (left panel) and LT-HSCs (right panel) of young Vav-Cre ASXL1-MT KI mice ( n = 5). Data are mean +- s.d. unless otherwise noted. * P
- Submitted by
- Invitrogen Antibodies (provider)
- Main image
- Experimental details
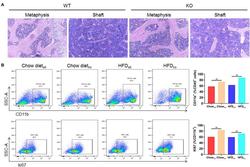
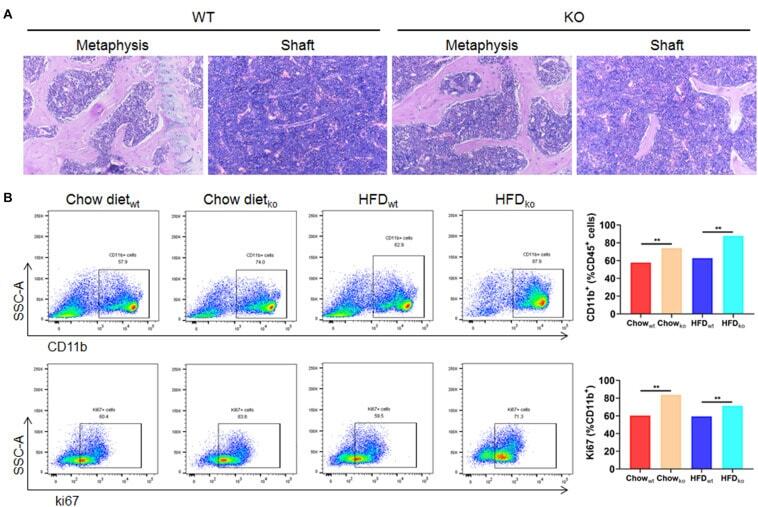
- FIGURE 6 The proliferation of cells from the bone marrow mononuclear phagocyte system is increased in LAMTOR1 MKO mice. (A) HE staining of the bone marrow. (B) Flow cytometry analysis of bone marrow cells. The results refer to the bone marrow of the left femurs since both left and right femoral bone marrow displayed the same results. n = 4. ** P < 0.01 vs. WT. HFD, high-fat diet; KO, myeloid-specific knockout mice; WT, wild-type.
- Submitted by
- Invitrogen Antibodies (provider)
- Main image

- Experimental details
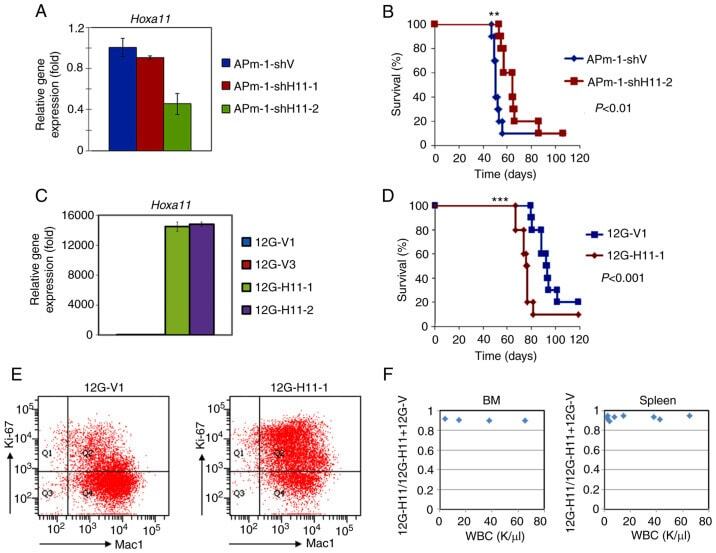
- Figure 4. Expression of Hoxa11 affects survival of MLL/AF10 leukemia mice. (A and C) Reverse transcription-quantitative PCR analyses were performed to determine Hoxa11 expression in (A) Hoxa11 -knockdown APm-1 (APm-1-shH11-1, APm-1-shH11-2) and control (APm-1-shV) cell lines, or in (C) Hoxa11 -overexpression 12G (12G-H11-1, 12G-H11-2) and control (12G-V1 and 12G-V3) cell lines. Assays were performed in triplicate and data shown are representative of three independent experiments. Error bars indicate SD. (B and D) Survival curves of mice i.p. injected with (B) APm-1-shV or APm-1-shH11-2, and (D) 12G-V1 or 12G-H11-1 cells. Survival analysis was conducted according to the Kaplan-Meier method. **P
- Submitted by
- Invitrogen Antibodies (provider)
- Main image
- Experimental details
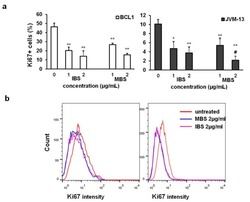
- Figure 3 IBS and MBS attenuate the expression of Ki67 in BCL1 and JVM-13 cells. ( a ) Percentage of Ki-67 positive BCL1 and JVM-13 cells exposed to IBS and MBS (concentrations = 1 and 2 ug/mL) for 24 h determined by flow cytometry presented as the mean + SD from three independent experiments. Data were analyzed with Student's t -test: * p < 0.05; ** p < 0.01, # p < 0.05 (indicates differences between two doses of MBS). ( b ) Representative histograms of Ki67 expression (mean fluorescence intensity) in BCL1 and JVM-13 cells.

- Submitted by
- Invitrogen Antibodies (provider)
- Main image

- Experimental details
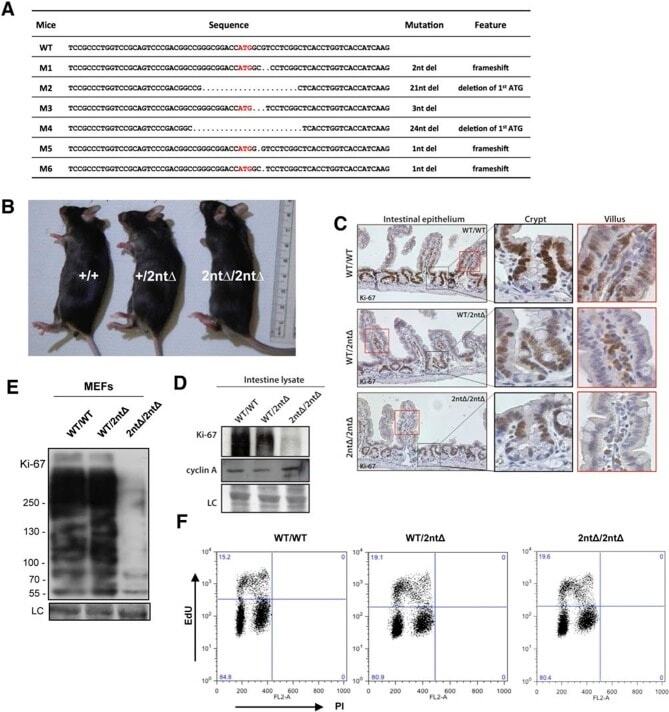
- Figure 3. Mouse development with a mutated Ki-67 gene. ( A ) Table describing Ki-67 mutant mouse lines resulting from germline transmission of mutations generated by cytoplasmic injection of TALEN-encoding mRNA into zygotes. ( B ) Macroscopic appearance of littermate female mice at 10 weeks of age. Genotypes are specified. ( C ) IHC staining of Ki-67 in sagittal section of intestine from Mki67 WT/WT , Mki67 WT/2nt and Mki67 2nt/2nt mice. ( D ) Western blots of Ki-67 and cyclin A expression from intestine isolated from Mki67 WT/WT , Mki67 WT/2nt and Mki67 2nt/2nt mice. LC, loading control. ( E ) Western blot of Ki-67 in MEFs from WT, Mki67 WT/2nt and Mki67 2nt/2nt mice. LC, loading control. ( F ) Flow cytometry profiles in WT, Mki67 WT/2nt and Mki67 2nt/2nt MEFs showing EdU incorporation upon a 1 hr pulse and DNA content. DOI: http://dx.doi.org/ Figure 3--figure supplement 1. Ki-67 mutant mice develop normally. ( A ) Pair of TALE-nucleases designed to target the initiator ATG of mouse Mki67 gene. ( B ) Sequencing traces of initiator ATG (underlined) of Mki67 gene in WT Mki67 +/+ (WT/WT), heterozygous Mki67 +/2nt (WT/2nt) and homozygous Mki67 2nt/2nt (2nt/2nt) mice. ( C ) Sequencing traces of initiator ATG (underlined) of Mki67 gene in WT Mki67 +/+ (WT/WT), heterozygous Mki67 +/21nt (WT/21nt) and homozygous Mki67 21nt/21nt (21nt/21nt) mice. ( D ) WT Mki67 +/+ (+/+), heterozygous Mki67 +/21nt (+/21nt) and homozygous Mki67 21nt/21nt (21nt/21nt) mice. DOI: http://dx.doi.org/ Figur
- Submitted by
- Invitrogen Antibodies (provider)
- Main image

- Experimental details
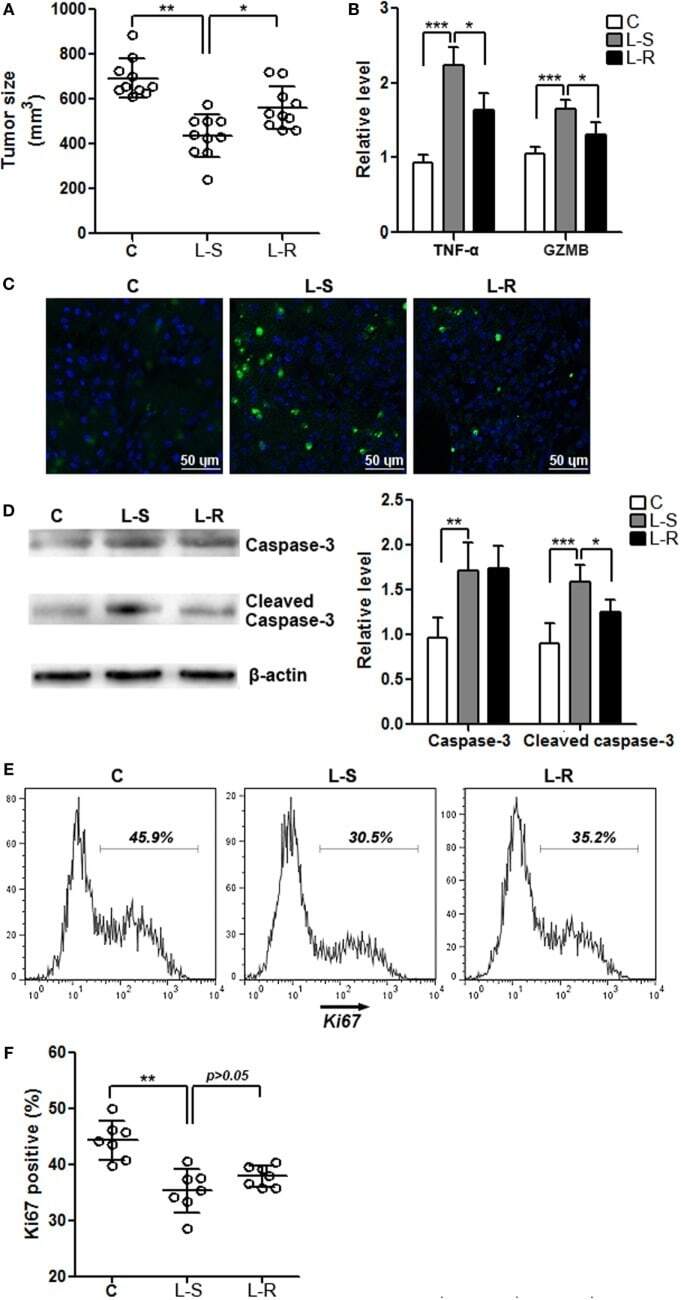
- Figure 5 Rik expression in CD8 + T cells favors tumor survival . (A) Tumor size. C: control mice receiving phosphate-buffered saline. L-S: mice receiving CD8 + T cells transduced with scramble lentiviruses. L-R: mice receiving CD8 + T cells transduced with Rik-expressing lentiviruses. Each circle represents an individual mouse. (B) mRNA levels of TNF-alpha and granzyme B in tumor tissues. N = 4 per group. (C) Tumor cell apoptosis is indicated by terminal deoxynucleotidyl transferase dUTP nick end labeling. This is a representative of three independent experiments. (D) Activation of caspase-3 in tumor tissues. Left panel: representative Immunoblot image. Right panel: statistics of caspase-3. N = 5 per group. (E,F) Tumor cell proliferation is demonstrated by Ki67 staining. Tumor implants were digested as described in Section "" Materials and Methods ."" Then the whole tissue was pressed through a 70-mum nylon mesh to prepare a single cell suspension, followed by staining with APC anti-CD45 and APC anti-CD31 antibodies. Cells were then stained for Ki67 as described in Section "" Materials and Methods ."" CD45 - CD31 - tumor cells were shown here. Representative histograms are shown in panel (E) , and statistical analysis for Ki67 + cells were shown in panel (F) . N = 7 per group (* p < 0.05; ** p < 0.01; *** p < 0.001).
- Submitted by
- Invitrogen Antibodies (provider)
- Main image
- Experimental details
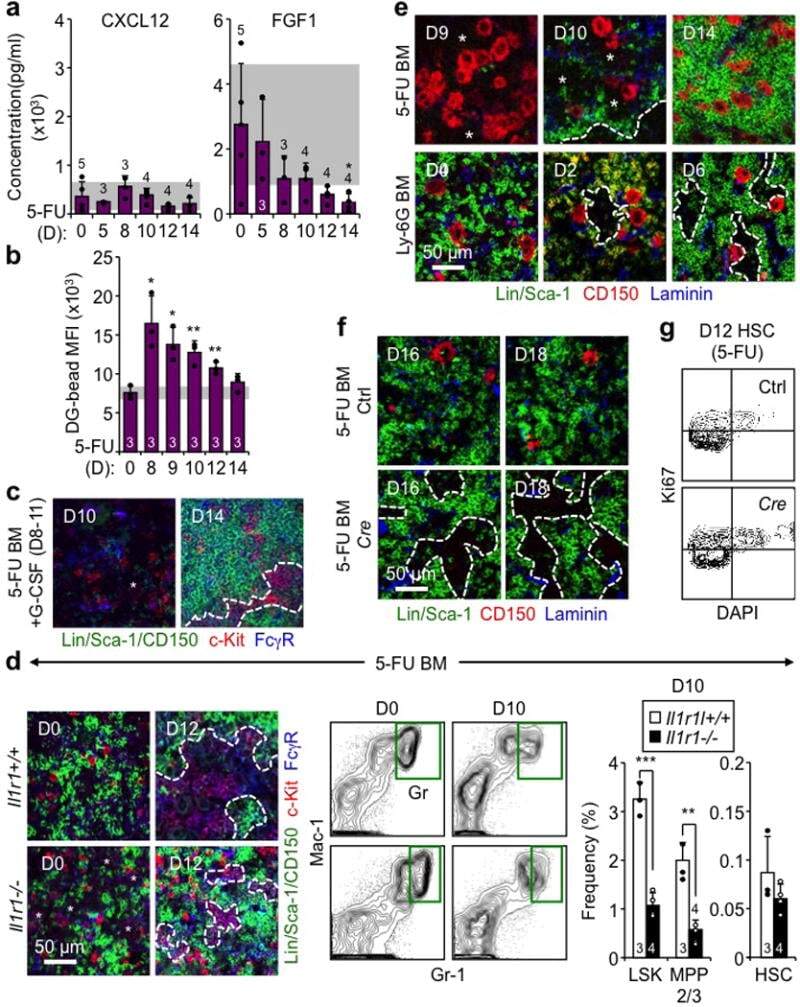
- Extended Data Fig. 9 Mechanisms controlling GMP cluster formation during regeneration a , ELISA measurement of cytokine levels in BM fluids of 5-FU-treated WT mice at the indicated days post-treatment. b , Quantification of vascular leakage in 5-FU-treated BM at the indicated days post-treatment. Results are expressed as dragon green (DG) microsphere MFI upon masking of laminin + blood vessels. c , Representative IF staining showing GMPs (purple) in 5-FU-treated BM with concomitant daily injections of G-CSF (+G) on d8-11. d , Investigation of 5-FU-treated Il1r1 +/+ and Il1r1 -/- mice at the indicated days post-treatment showing representative IF staining of GMPs (purple), FACS plots of Gr regeneration, and quantification of the indicated BM populations. e , Representative IF staining of CD150 + megakaryocytes (red) in 5-FU- and Ly-6G-treated BM. f , g , Megakaryocyte depletion studies in diphtheria toxin (DT) injected iDtr (Ctrl) and Cxcl4-Cre:iDtr ( Cre ) mice showing (f) representative IF staining of CD150 + megakaryocytes (red) at the indicated days post-5-FU, and (g) representative Ki67/DAPI staining of HSCs at d12 post-5-FU. Stars indicate pGMPs and dotted lines cGMPs. Results are expressed as mean +- S.D. (grey bars, reference range); *p
- Submitted by
- Invitrogen Antibodies (provider)
- Main image
- Experimental details
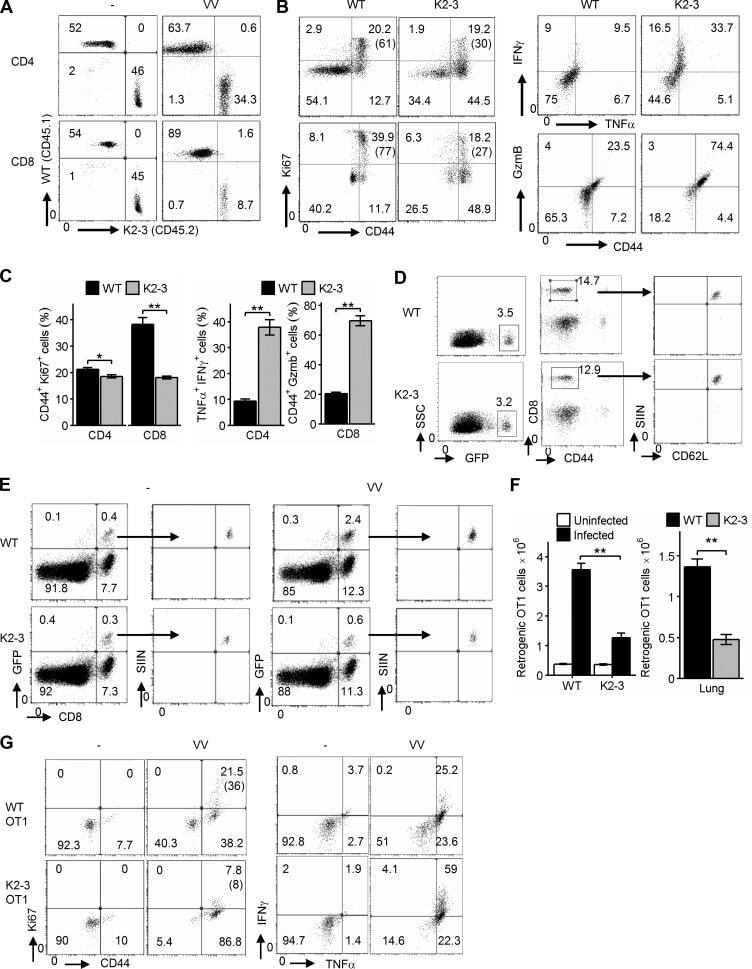
- Figure 4. Egr2 and 3 function is cell intrinsic. (A-C) Irradiated WT mice were adoptively transferred with an equal number of BM cells from WT and CD2-Egr2/3 -/- (K2-3) mice. 8 wk after transfer, mice were infected with OVA-VV WR and analyzed 7 d after infection. (A) Splenic cells from chimeric mice were stained with CD45.1, CD45.2, CD4, and CD8, and the proportion of WT (CD45.1) and K2-3 (CD45.2) CD4 and CD8 cells was determined by flow cytometry. (B and C) Gated WT (CD45.1) and K2-3 (CD45.2) CD4 and CD8 cells were analyzed for expression of the activation marker CD44 and the proliferation marker Ki67 (left) and TNF and IFNgamma for CD4 cells and granzyme B for CD8 cells (right). The percentages of Ki67 + cells among the CD44 high population are indicated in parentheses in B. (D-G) WT and K2-3 OT1 retrogenic T cells were analyzed in recipient mice before and after infection. (D) GFP + CD8 + CD44 lo cells were isolated from WT and K2-3 OT1 retrogenic mice (left and middle) and confirmed as CD62L + Kb-SIINFEKL-tetramer + cells (right). 3 x 10 5 to 5 x 10 5 WT or Egr2/3 -/- retrogenic-OT1 cells were adoptively transferred to separate naive WT mice. 1 d after transfer, mice were infected with OVA-VV WR and analyzed 7 d after infection. (E and F) Retrogenic-OT1 GFP + CD8 + Kb-SIINFEKL-tetramer + cells among spleen and lymph node cells from recipient mice were identified (E), and the numbers of WT and K2-3 retrogenic-OT1 cells in spleen and lymph nodes (left) and lung (right) were
- Submitted by
- Invitrogen Antibodies (provider)
- Main image

- Experimental details
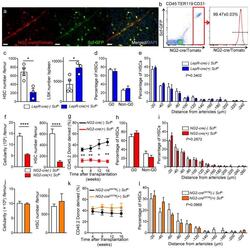
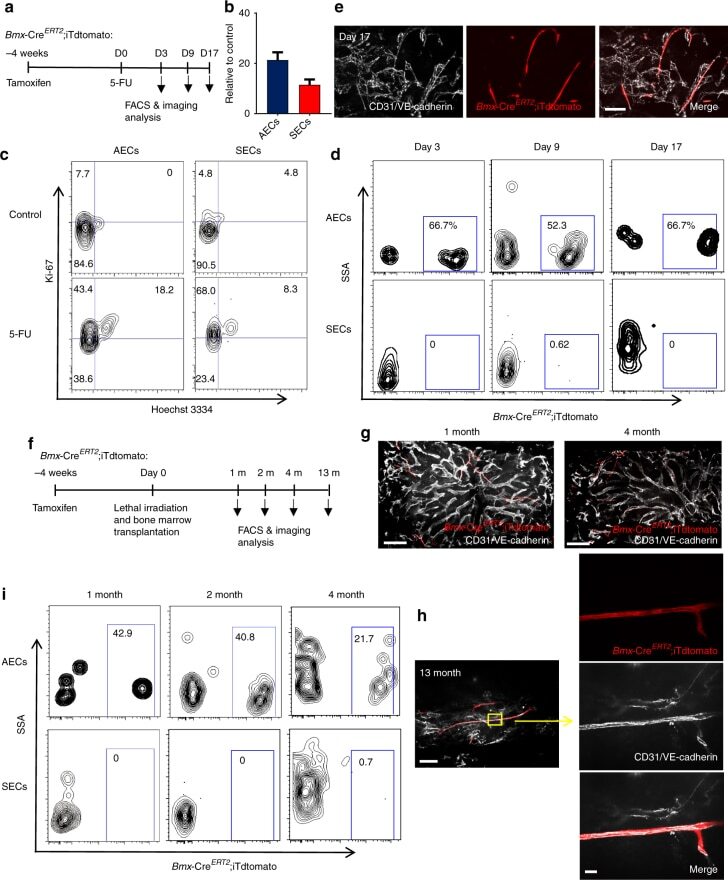
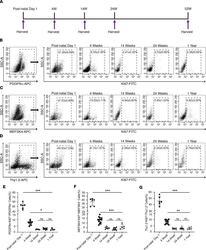
- Fig. 6 AECs self-regenerate, and do not regenerate SECs. a Scheme of experiment design. Bmx -Cre ERT2 ;iTdtomato mice were injected with Tamoxifen to activate Cre expression. Four weeks later, 5-FU was given to these mice and BM ECs were analysed by FACS and immunofluorescence analysis. b Numbers of AECs and SECs 3 days after 5-FU treatment. Data are represented as mean +- SEM. c Representative FACS plot of cell cycle analysis of AECs and SECs from control mice and mice treated with 5-FU (9 days after 5-FU) using Hoechst 3334 and Ki-67. d FACS plot of the labelling of AECs and SECs by Bmx -Cre ERT2 at different time points after 5-FU treatment. e Representative image of whole-mount sternum from mice treated as in ( a ). The bone was harvested on day 17 after 5-FU injection. Mice were injected i.v. with anti-VE-cadherin and anti-CD31. All panels show the same area for different channels. Scale bar, 50 mum. f Scheme of experiment design. Bmx -Cre ERT2 ;iTdtomato mice were injected with Tamoxifen to activate Cre expression. Four weeks later, these mice were lethally irradiated and transplanted with BM cells from wild-type mice. BM ECs were analysed by FACS and immunofluorescence analysis at different time points after lethal irradiation. g Representative images from whole-mount sternum at 1 month (left panel) and 4 months (right panel) after lethal irradiation. Mice were injected i.v. with anti-VE-cadherin and anti-CD31. Scale bar, 200 mum. h Images from whole-mount sternum in w
- Submitted by
- Invitrogen Antibodies (provider)
- Main image
- Experimental details
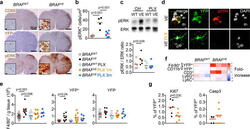
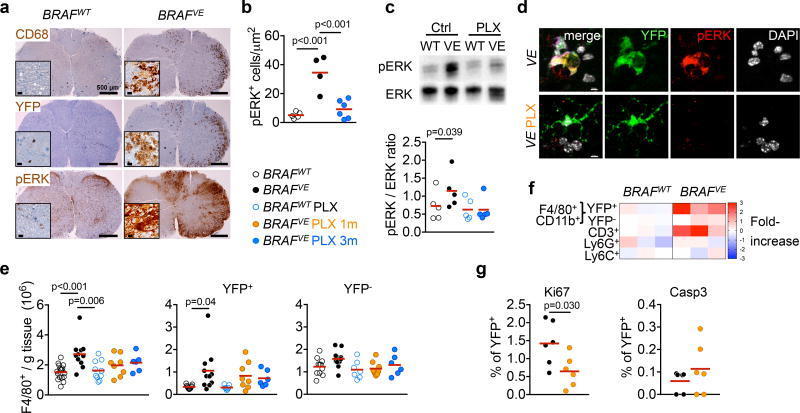
- Figure 3 ERK activation in BRAF V600E microglia (a) CD68, YFP and pERK staining in spinal cord from 7-month old mice. Scale bars=500um, 10um for insets. n=4 per group. (b) pERK + microglia in brainstem. Circles represent individual mice. One-way ANOVA. (c) ERK phosphorylation in spinal cords and brains from 6-9 month-old mice. Top: representative western blot, bottom: pERK/ERK ratio, n=5 per group. One-way ANOVA. (d) pERK expression in YFP + microglia from BRAF VE mice. n=5 per group. Scale bars=5um. (e) Numbers of microglia from 5-9 month-old mice Circles represent individual mice. One-way ANOVA. (f) Heatmap representation of cell frequency among CD45 + cells in the brain. n=3 per group. (g) Ki67 + and cleaved Caspase 3 + (Casp3) expression in YFP + microglia from 5-9 month-old BRAF VE mice, n=6 per group. Unpaired two-tailed t -test. See also Extended data Fig. 7 .
- Submitted by
- Invitrogen Antibodies (provider)
- Main image
- Experimental details
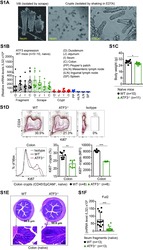
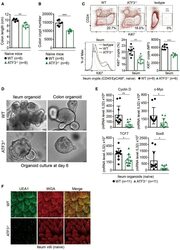
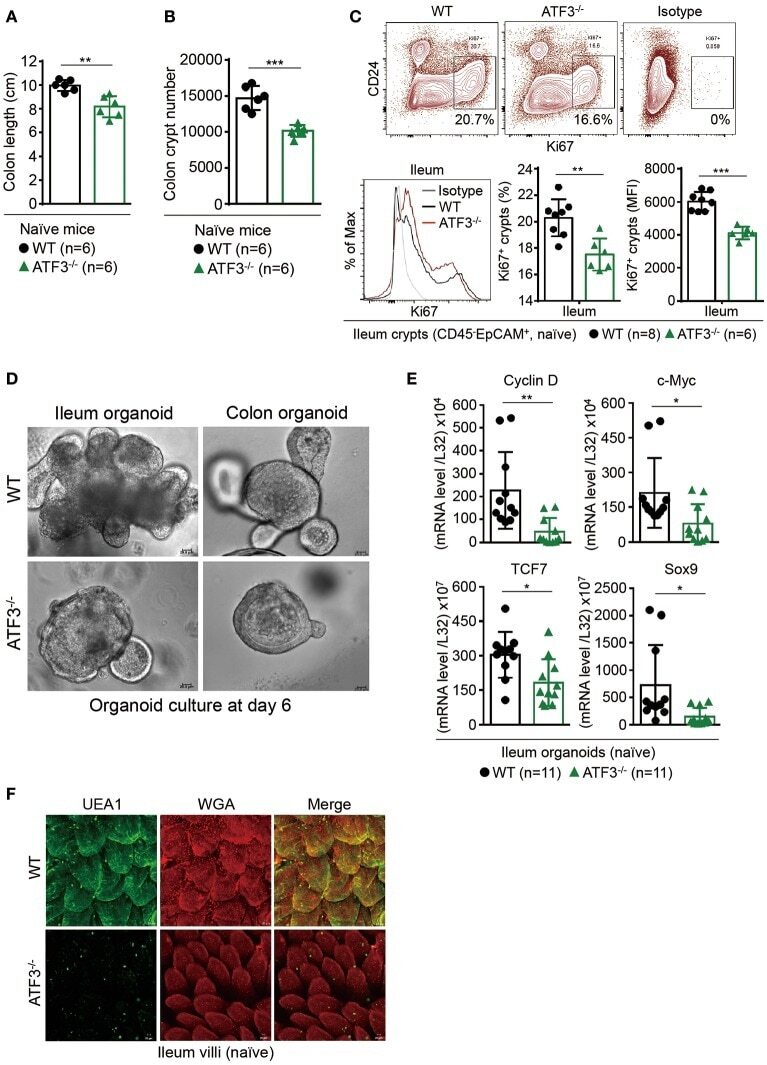
- Figure 1 ATF3 maintains intestinal homeostasis. (A) Comparison of colon length between naive mice as indicated. (B) Colon crypts from mice were isolated by shaking colon fragments in EDTA and counted under light microscopy. (C) Flow cytometry analysis of Ki67 and CD24 expression in ileum crypts, gated on the CD45 - EpCAM + populations, from the indicated naive mice. (D) Representative micrographs showing intestinal organoids derived from naive mice. (E) Quantitative real-time PCR analysis of cell cycle genes in naive ileum organoids at day 6 of culture (""n"" indicates organoids derived from 4 mice each group). (F) Representative confocal images of whole mount tissues with co-immunofluorescence staining of UEA-1 and WGA in naive ileum villi. Results were from at least two independent experiments and ""n"" refers to the number of mice unless indicated otherwise. All mice were at the age of 2~3 months old when analyzed. Statistical analysis was done using Multiple T -test on Prism software. * P < 0.05, ** P < 0.005, *** P < 0.0005.
- Submitted by
- Invitrogen Antibodies (provider)
- Main image
- Experimental details
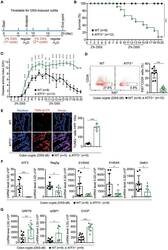
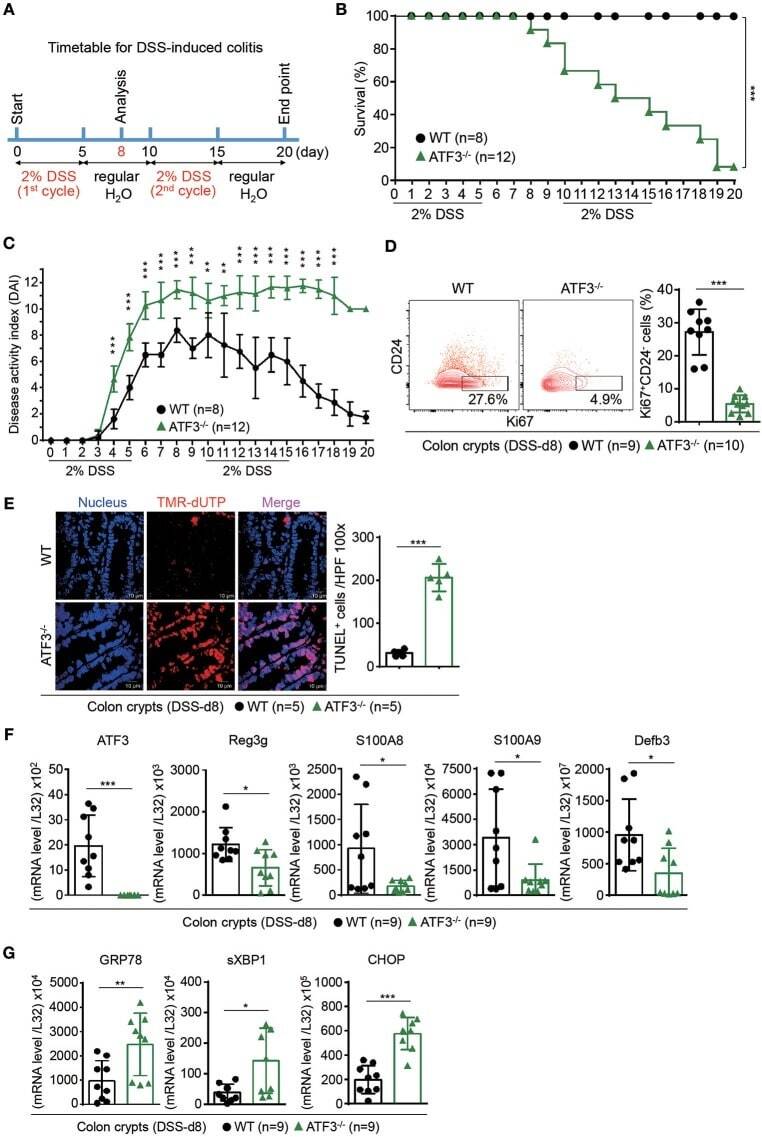
- Figure 3 ATF3 protects mice from DSS-induced colitis. (A) Experimental protocol of DSS-induced colitis was shown. (B) Survival rate in mice after DSS treatment. (C) Disease activity index (DAI), a composite measurement of weight loss percentage, stool consistency, and blood in stools, was indicated in each group of mice during DSS colitis. (D-G) Analysis of colitis severity at day-8 post DSS treatment. (D) Flow cytometry of Ki67 + proliferating crypt cells in CD24 low/- cell population. (E) TUNEL assay showing apoptotic cells in colon tissues. Magenta positive apoptotic cells were quantified per 100x high-power field (HPF) from 10 different views of colon section from each mouse. (F-G) Quantitative real-time PCR analysis of crypt cells at day-8 post DSS. (F) Expression of ATF3 and anti-microbial peptide-related genes. (G) Expression of ER stress-related genes. Results were from two independent experiments. ""n"" refers to the number of mice analyzed. Survival curve was calculated using the Kaplan-Meier method and statistical significance was calculated using Log rank (Mantel-Cox) test. Statistical analysis was done using Multiple T -test on Prism software. * P < 0.05, ** P < 0.005, *** P < 0.0005.
- Submitted by
- Invitrogen Antibodies (provider)
- Main image
- Experimental details
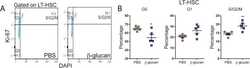
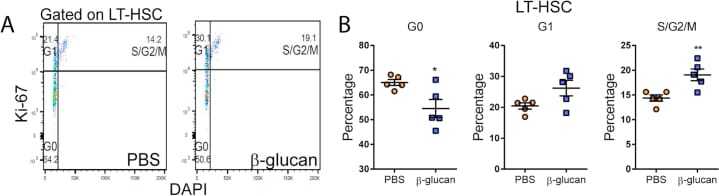
- Figure S1 Administration of beta-Glucan Promotes Cell Proliferation of LT-HSCs, Related to Figure 1 (A and B) Cell cycle analysis was performed in LT-HSC at 24h after the administration of PBS or beta-glucan by staining for Ki67 and DAPI. (A) Representative flow cytometry plots and (B) frequency of LT-HSC at different phases of the cell cycle (n = 5 mice per group). Data presented as mean +- SEM. * p < 0.05, ** p < 0.01.
- Submitted by
- Invitrogen Antibodies (provider)
- Main image
- Experimental details
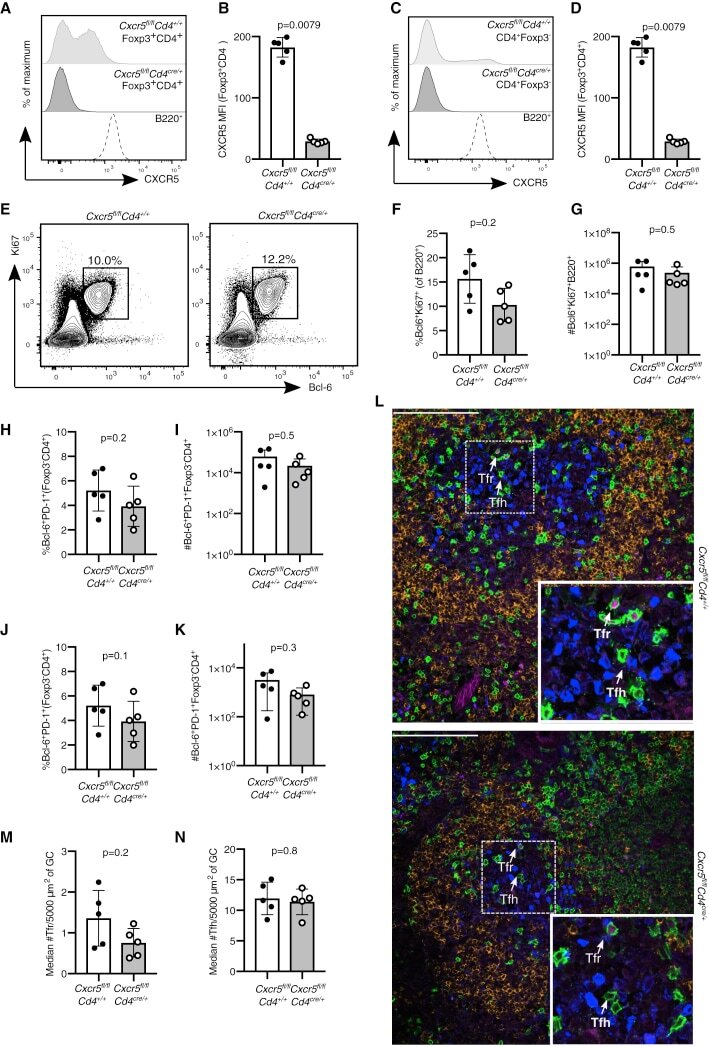
- Figure 4 Cxcr5 fl/fl Cd4 cre/+ Mice Have an Intact GC Response after Influenza Infection Analysis of the GC response in Cxcr5 fl/fl Cd4 cre/+ mice 14 days after influenza A virus (HKx31) infection. (A) Representative histogram of CXCR5 expression in Foxp3 + CD4 + Treg cells and B220 + B cells. (B) Quantification of the MFI (geometric mean) of CXCR5 in Foxp3 + CD4 + Treg cells. (C) Representative histogram of CXCR5 expression in Foxp3 - CD4 + T cells and B220 + B cells. (D) Quantification of the MFI (geometric mean) of CXCR5 in Foxp3 - CD4 + T cells. (E) Flow cytometry contour plots of GC B cells, gated as Bcl6 + Ki67 + cells of B220 + cells. (F and G) Quantification of the (F) frequency and (G) absolute number of Bcl6 + Ki67 + B cells. (H and I) Quantification of the (H) percentage and (I) number of Bcl6 + PD-1 + Foxp3 - CD4 + Tfh cells. (J and K) Quantification of the (J) percentage and (K) number of Bcl6 + PD-1 + Foxp3 + CD4 + Tfr cells. (L) Cryosections were stained for Foxp3 (magenta), Ki67 (blue), CD3 (green), and IgD (orange). Scale bar, 100 mum. Representative confocal image of the GC, with Tfr cells and Tfh cells indicated by the arrows. (M) Quantification of the median number of Tfr cells, defined as CD3 + Foxp3 + cells, per 5,000 mum 2 . (N) Quantification of the median number of Tfh cells, defined as CD3 + Foxp3 - cells, per 5,000 mum 2 . Each symbol represents one mouse, the horizontal bars represent mean values, and the error bars show the SD. The p values were d
- Submitted by
- Invitrogen Antibodies (provider)
- Main image
- Experimental details
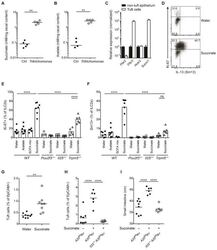
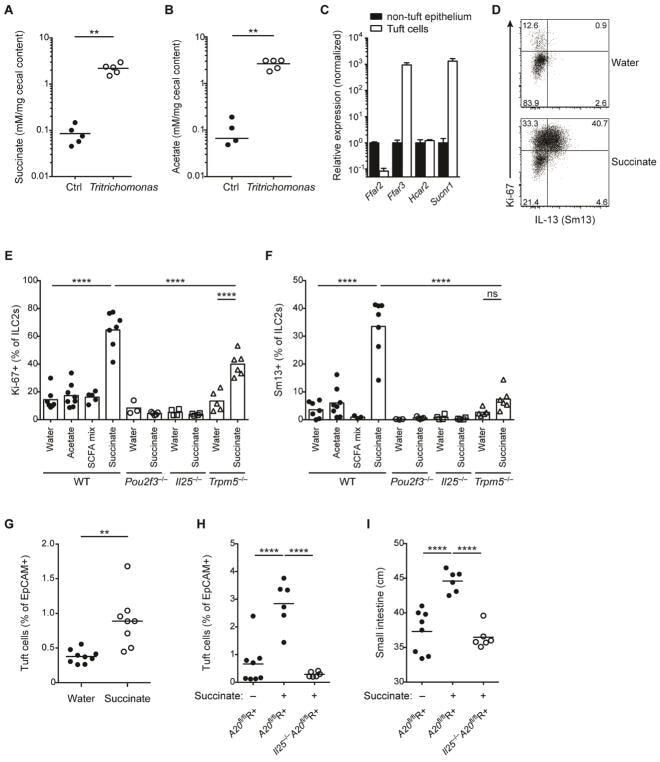
- Figure 6 Succinate is produced by Tritrichomonas and sufficient to activate the tuft cell - ILC2 circuit (A and B) GF mice monocolonized with Tritrichomonas and concentrations of acetate (A) and succinate (B) measured in the cecal content after 6 weeks. (C) Metabolite receptor mRNA expression quantified by qPCR in tuft cells versus other epithelial cells sorted from small intestine (SI) and normalized to levels in non-tuft epithelial cells. (D-F) Tritrichomonas -free IL-13-reporter (Sm13) mice were treated with succinate, acetate or a SCFA mix (acetate, butyrate, propionate) in drinking water for 4 days. Expression of Ki-67 and IL-13 by ILC2s in SI quantified by flow cytometry and representative dot plot from wild-type (WT) mice shown (D). Expression of Ki-67 (E) and IL-13 (F) by ILC2s from WT, Pou2f3 -/- , Il25 -/- and Trpm5 -/- mice treated with indicated solutions. (G) Tritrichomonas -free WT mice treated with 100 mM succinate in drinking water for 10 days. Frequencies of tuft cells in SI by flow cytometry. (H and I) Tritrichomonas -free A20 fl R+ and Il25 -/- A20 fl R+ mice treated with 100 mM succinate in drinking water for 25 days and frequencies of tuft cells (H) and SI length (I) analyzed. Data from one experiment (A, B) or from one experiment representative of at least two independent experiments (C, D, G-I) or pooled from multiple independent experiments (E, F). C, mean and s.e.m.; n = 3. **p < 0.01, ****p < 0.0001; ns, not significant by M
- Submitted by
- Invitrogen Antibodies (provider)
- Main image
- Experimental details
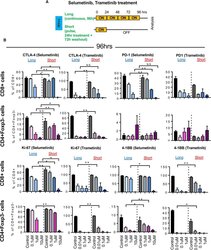
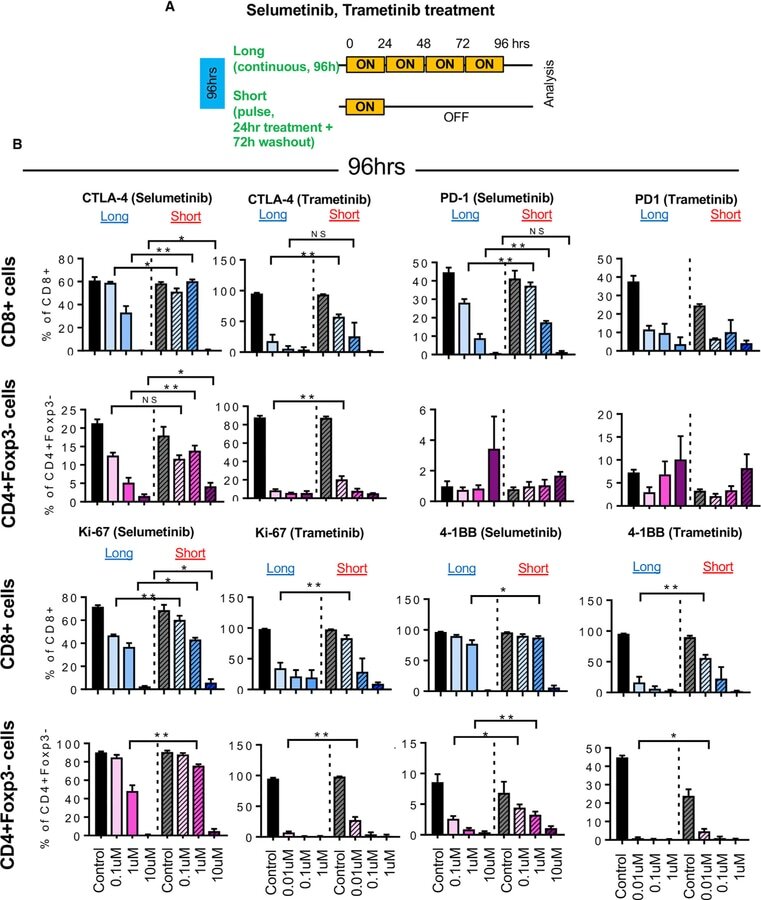
- Figure 2 Short Schedule of MEKi Treatment Alters T Cell Activation Status ExVivo (A) Schema of ex vivo short versus long treatmentexperiment. (B) CTLA-4, PD1, Ki-67, and 4-1BB expression in CD8+ T cells andCD4+Foxp3 cells by flow cytometry after selumetinib (left) or trametinib (right)treatment for 96 hr. *p < 0.05; **p < 0.01, Welch'stest. Error bars represent SD. Samples were biological replicates. Theexperiment was performed twice, and representative results are shown here.
- Submitted by
- Invitrogen Antibodies (provider)
- Main image
- Experimental details
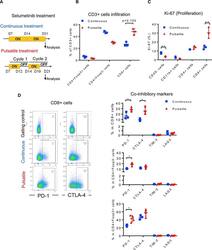
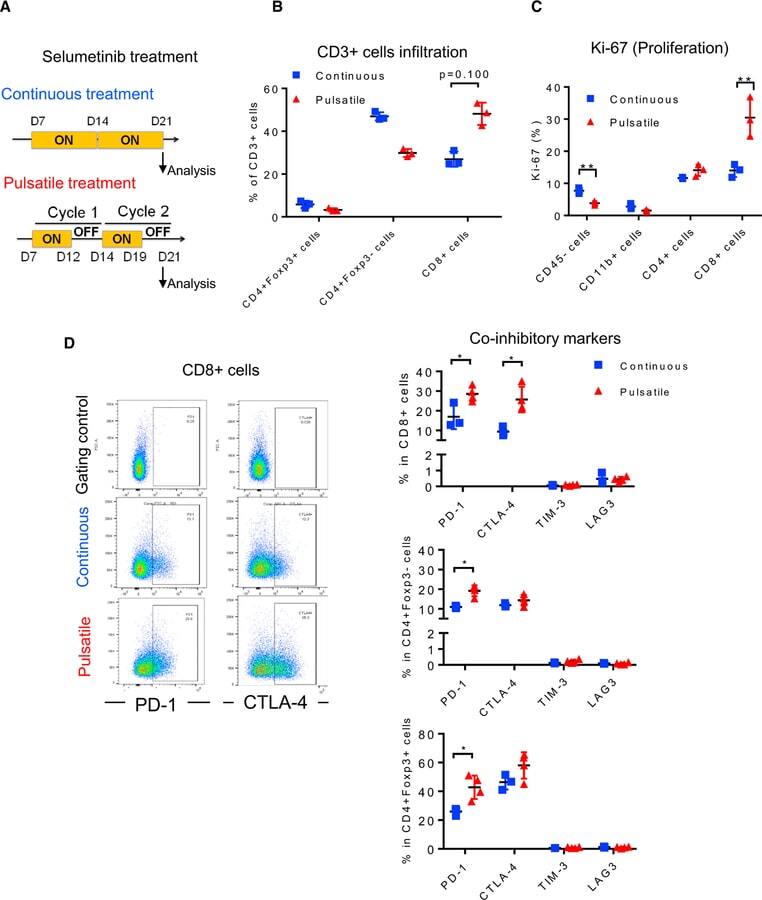
- Figure 4 Pulsatile Treatment of Selumetinib Induces CTLA-4 and PD-1 Expression In Vivo HKP1 transplantable lung-tumor-bearing mice were treated withselumetinib (25 mg/kg, BID) as presented in (A). After 2 weeks of treatment,lungs were collected and analyzed by flow cytometry. (A) Schema of selumetinib treatment in HKP1 lung-tumor-bearing mice in vivo . (B) Frequency of CD3+ T cell subsets in lung tumors by flowcytometry. (C) Ki-67 of diverse cell populations in lung tumors by flowcytometry. (D) Scatterplots of PD-1 and CTLA-4 marker (left) and co-inhibitorymarker expression from CD3+ T cell subsets of lung tumors by flow cytometry(right). Gating controls are samples without either PD-1 or CTLA-4antibodies. *p < 0.05; **p < 0.01; ***p < 0.001, Mann-Whitneytest. Samples were biological replicates. The experiment was performed 3 times,and representative results are shown here.
- Submitted by
- Invitrogen Antibodies (provider)
- Main image
- Experimental details
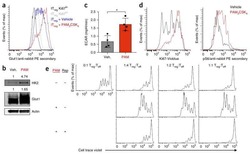
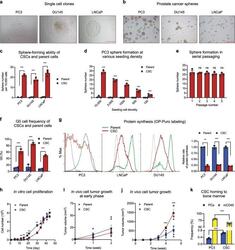
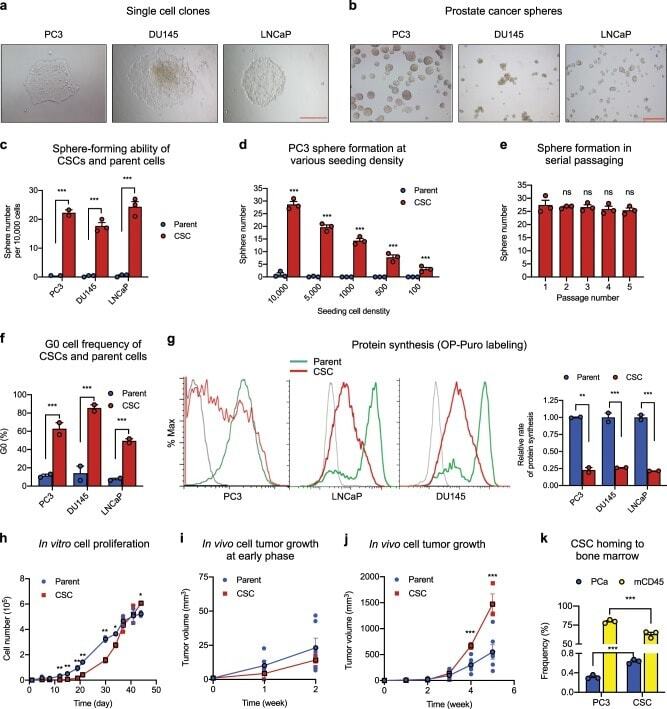
- Fig. 1 Isolation and characterization of prostate CSCs. a Morphology of single cell clones isolated from PC3, DU145, and LNCaP. Scale bar: 500 mum. b Cancer sphere formed from CSCs cultured in sphere medium in bacteriological petri dishes. Scale bar: 500 mum. c Sphere formation of the CSC lines and their respective parent cells at seeding density of 10,000 per 2 ml in 35-mm dishes ( n = 3). d Sphere formation of PC3 CSCs and parent cells at 100-10,000 cells per 2 ml in 35-mm dishes ( n = 3). e Sphere formation during serial passaging (10,000 cells per 2 ml in 35-mm dishes) ( n = 3). f G0 cell population of CSCs and parent cell lines determined by flow cytometry after Ki-67 and 7-AAD staining ( n = 3). g Protein synthesis rate in CSCs and parent cells determined by OP-Puro incorporation followed by flow cytometry analysis ( n = 3). Geometric mean was calculated by FlowJo. Bar graphs representing relative protein synthesis rate between CSCs and respective parent cells. h In vitro growth curves of CSCs and parent cells of PC3. Seeding density was 10,000 cells per well of 48-well plates ( n = 3). Early ( i ) and late ( j ) phase of in vivo growth of PC3 CSCs and parent cells in NSG mice. A mixture of 50 mul HBSS containing 50,000 cells and 50 mul Matrigel was inoculated in NSG mice ( n = 8). Tumor size was measured every week. k Bone marrow niche binding of PC3 cells and CSCs. GFP-labeled PC3 cells or CSCs were administered to NSG mice that had been transp
- Submitted by
- Invitrogen Antibodies (provider)
- Main image
- Experimental details
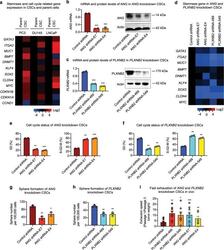
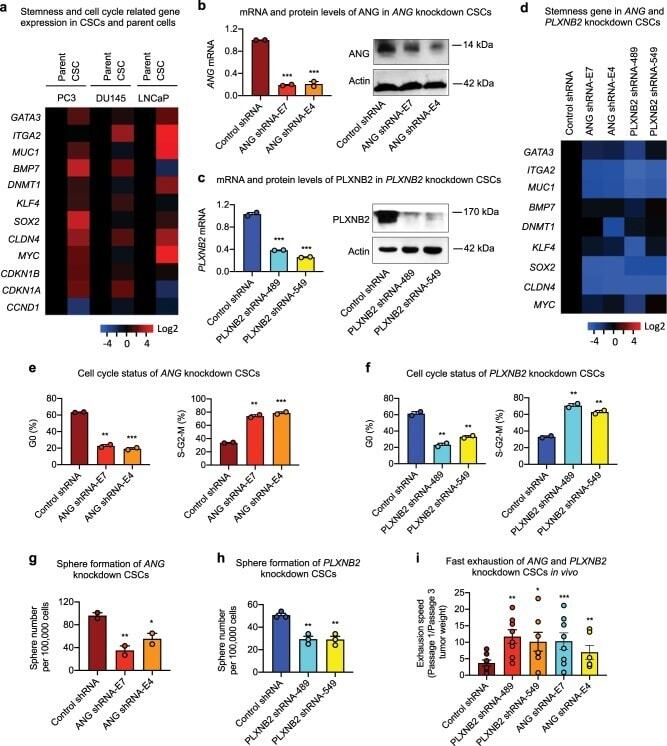
- Fig. 3 Knockdown of ANG or PLXNB2 decreases stemness of prostate CSCs. a mRNA levels of cancer stemness-related genes in prostate CSCs and parent cells ( n = 5). Values in the CSCs were normalized to the respective parent cells. mRNA and protein levels of ANG ( b ) and PLXNB2 ( c ) in knockdown CSCs. mRNA levels were determined by qRT-PCR and normalized to control shRNA transfectants ( n = 3). Protein levels were determined by immunoblotting. d mRNA level of cancer stemness-related genes in ANG and PLXNB2 knockdown CSCs ( n = 3). Values were normalized to the control shRNA transfectants. Cell cycle status of ANG ( e ) and PLXNB2 ( f ) knockdown CSCs, analyzed by flow cytometry after Ki-67 and 7-AAD staining ( n = 2). Sphere formation of ANG ( g ) and PLXNB2 ( h ) knockdown CSCs ( n = 3). i CSC exhaustion during serial passaging in vivo. Cells were passaged in NSG mice ( n = 5-8) for three times. In each passage, 100,000 cells were inoculated per mouse. Tumors were excised and weighed 4 weeks post inoculation in each passage. Exhaustion rate was calculated as the ratio of tumor weight from first passage to third passage. * p < 0.05; ** p < 0.01; *** p < 0.001.
- Submitted by
- Invitrogen Antibodies (provider)
- Main image
- Experimental details
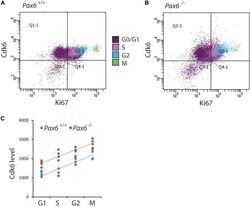
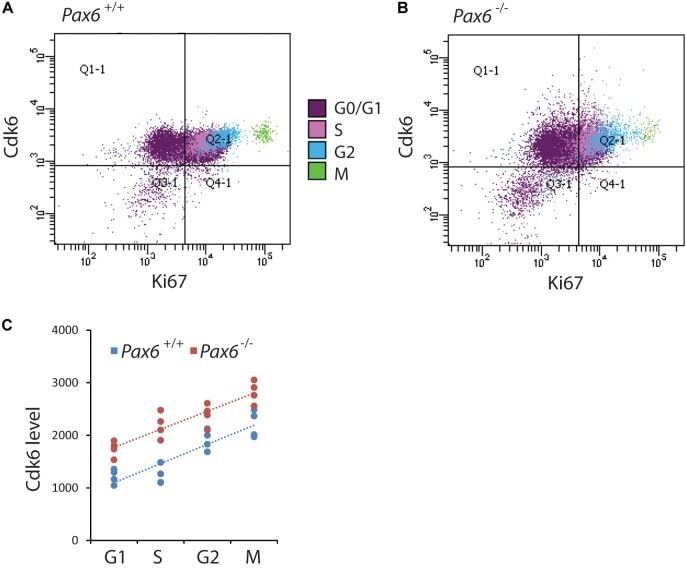
- FIGURE 4 Flow cytometric analysis of Cdk6 levels at different phases of the cell cycle in Pax6 +/+ and Pax6 -/- cortex at E12.5. (A,B) Fluorescence intensity of Cdk6 against Ki67: Samples from a Pax6 +/+ and a Pax6 -/- embryo with cells classified according to their cell cycle phase by methods illustrated in Figure 3 . G1 cells were distinguished from G0 cells by positivity for Ki67 in quadrants Q2-1 and Q4-1 (cells in quadrants 1-1 and 3-1 were negative for Ki67). (C) Relative levels of Cdk6 in the cortex of four Pax6 +/+ and four Pax6 -/- embryos at each phase of the cell cycle. Each data point is the average level in the cortex of one embryo. Regression analysis of levels of Cdk6 against cells cycle phase gave r 2 values of 0.78 for Pax6 +/+ data and 0.81 for Pax6 -/- data. ANOVA showed a significant effect of genotype (alpha = 0.05) and Sidak's multiple comparisons tests showed significantly higher levels of Cdk6 in Pax6 -/- cortex in all phases (G1, p = 0.0075; S, p < 0.0001; G2, p = 0.0167; M, p = 0.0019).
- Submitted by
- Invitrogen Antibodies (provider)
- Main image
- Experimental details
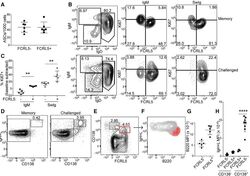
- Figure 6. FCRL5 + MBCs Exhibit Robust Recall Responses (A) FCRL5 + and FCRL5 - MSP1-specific MBCs (B220 + CD38 + CD138 - GL7 - IgD - ) were sorted from mouse spleens 3-4 months post-infection. Antibody- secreting cells (ASCs) were enumerated by EliSPOT after 3 days restimulation in interleukin-2 (IL-2) + R848. (B-H) Four months after infection, mice were either challenged with 10 7 P. chabaudi parasites or were not challenged (memory). MSP1-specific B cells were analyzed 5 days later. (B) Representative flow plots of isotype distribution and Ki67 labeling in MSP1-specific MBCs (B220 + CD38 + CD138 - GL7 - ) with or without challenge. (C) Change in the percentage of IgM + and SwIg MBCs expressing Ki67 after challenge, relative to % Ki67 + without challenge. (D) Representative flow plots from memory and challenged mice showing the emergence of antibody-secreting cells (CD138 + IgH+L hi ) after challenge. (E) FCRL5 expression on CD138 int and CD138 hi cells in challenged mice. (F) Representative flow plot depicting expression of intracellular IgH+L and B220 on the populations defined in (E). (G and H) Levels of B220 (G) and intracellular IgH+L (H) on the populations defined in (E). In (H), IgH+L expression in CD138 - B cells is shown for comparison. Two independent experiments were performed and pooled (A-H). Graphs depict mean +- SEM and symbols represent individual mice. **p < 0.01 by Mann-Whitney test (C). ****p < 0.0001 by one-way ANOVA with Tukey's post-test. S
- Submitted by
- Invitrogen Antibodies (provider)
- Main image
- Experimental details
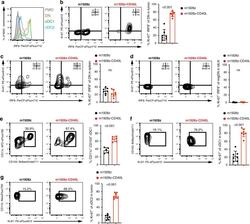
- Fig. 3 m1928z-CD40L CAR T cells stimulate tumor-resident CD11b-CD103- DN cDCs to proliferate, upregulate IRF8, and differentiate to cDC1s. a IRF8 expression in CD11b - CD103 - double-negative (DN) (orange), CD11b - CD103 + cDC1 (green), and CD11b + CD103 + cDC2 (blue) in the tumor of untreated A20.GL tumor-bearing mice. FMO, flow minus one. b - d Ki-67 and IRF8 expression shown as flow cytometry contour plots in CD11b - CD103 - DN cDCs in the tumor ( b ), spleen ( c ), and tumor-draining lymph nodes (tdLN) ( d ) of A20.GL tumor-bearing mice on day 7 after CAR T cell treatment. Percentage of Ki-67 + IRF8 + DN cDCs is summarized from two independent experiments ( n = 7/group). e CD45.2 + A20.GL tumor-bearing mice were treated with 3 x 10 6 CAR T cells i.v. and CD45.2 + CD11b - CD103 - DN cDCs were isolated from the tumor on day 3 by FACS. Sorted CD45.2 + DN cells were cultured in vitro on a CD45.1 + bone-marrow stromal layer for 3 days and the percentage of CD11c + CD103 + cDC1s of all CD45.2 + cells was analyzed. Shown are representative contour plots and the quantification of the percentage of CD11c + CD103 + cDC1s. Each dot represents one in vitro culture. Data were collected from two independently performed experiments (m1928z, n = 5; m1928z-CD40L, n = 6). f , g Ki-67 expression shown as contour plots in CD11b - CD103 + cDC1s ( f ) and CD11b + CD103 - cDC2s ( g ) in the tumor of A20.GL tumor-bearing mice on day 7 after CAR T cell treatment. Percentage of Ki-67 + cells is su
- Submitted by
- Invitrogen Antibodies (provider)
- Main image
- Experimental details
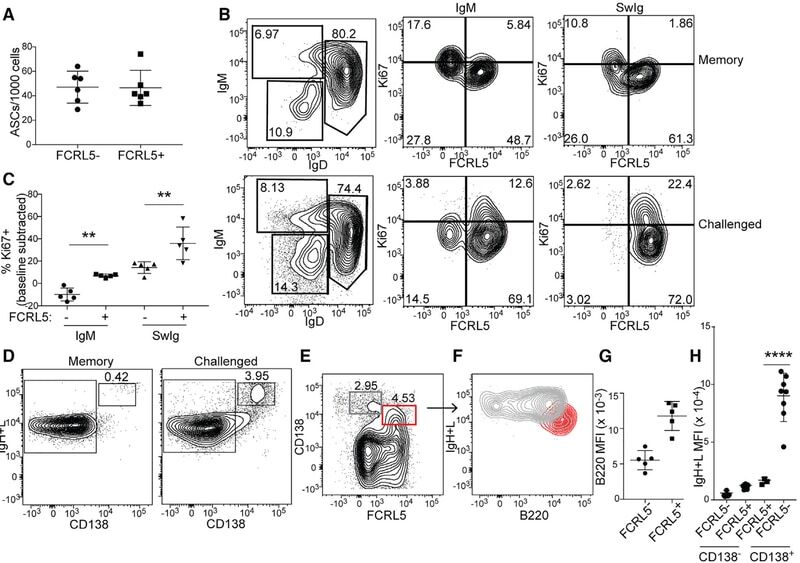
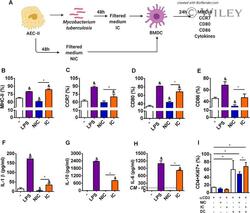
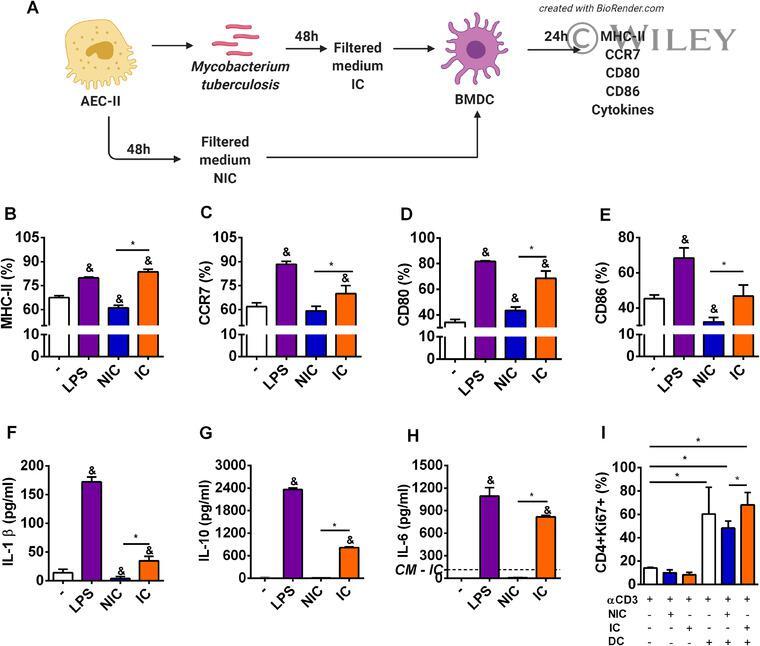
- 2 FIGURE Alveolar epithelial cells infected by M. tuberculosis positively modulate maturation of DCs . ( A ) BMDC (1 x 10 6 cells/well) were cultured for 24 h in different conditions: media (-), LPS 100 ng/mL (LPS), supernatants from noninfected MLE-15 cells (NIC), and M. tuberculosis -free supernatants from infected MLE-15 cells (IC). ( B ) MHC-II, ( C ) CCR7, ( D ) CD80, ( E ) CD86 expression on CD11c + CD11b + F4/80 - cells were analyzed by flow cytometry. ( F ) IL-1beta, ( G ) IL-10, and ( H ) IL-6 secretion were measured at 24 h by ELISA. ( I ) Flow cytometry analysis of Ki67, a marker of proliferation of naive CD4 + CD62L + cells stimulated with mAb anti-CD3 and cocultured for 96 h with nonstimulated BMDC, or BMDC previously stimulated with NIC or IC for 24 h. The results are representative of 3 independent experiments expressed as the mean +- SEM ( n = 4/experimental condition). * P
- Submitted by
- Invitrogen Antibodies (provider)
- Main image
- Experimental details
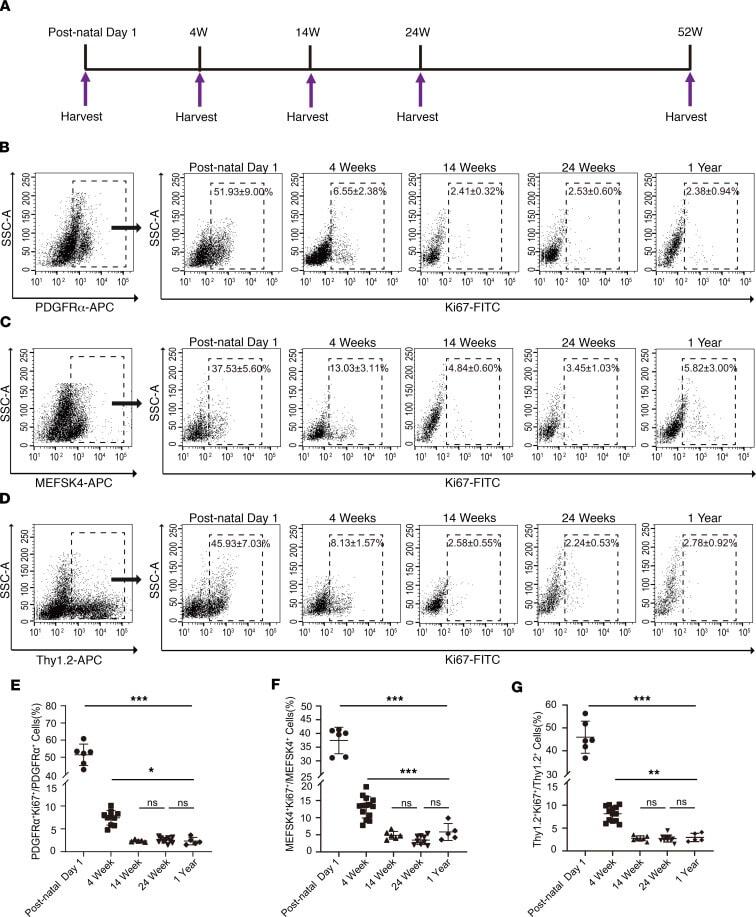
- Figure 2 Cardiac fibroblast proliferation with advancing age assessed by Ki67 coexpression. ( A ) Schematic depicting timing of harvest of heart for cardiac fibroblast isolation. ( B-D ) Cardiac fibroblasts were sorted from the nonmyocyte cell population by flow sorting for ( B ) PDGFRalpha, ( C ) MEFSK4, and ( D ) Thy 1.2, and Ki67 expression in each of those fractions determined by flow cytometry at postnatal day 1, 4 weeks, 14 weeks, 24 weeks, and 1 year. Quantitation of ( E ) PDGFRalpha, ( F ) MEFSK4, and ( G ) Thy 1.2 cardiac fibroblasts that coexpressed Ki67 at different ages. Postnatal day 1 value was compared with each value at 4 weeks, 14 weeks, 24 weeks, and 1 year, respectively. The 4-week value was similarly compared with each value at 14 weeks, 24 weeks, and 1 year. *** P < 0.0001, ** P < 0.01, * P < 0.05, ns = P > 0.05. Data are represented as the mean +- SD. Data analysis was performed by 1-way ANOVA with multiple-comparisons correction.