Explore
 Validate
 Learn
Learn Immunocytochemistry
Antibody data
- Antibody Data
- Antigen structure
- References [5]
- Comments [0]
- Validations
- Immunocytochemistry [2]
- Immunohistochemistry [4]
- Other assay [5]
Submit
Validation data
Reference
Comment
Report error
- Product number
- 41-5699-80 - Provider product page

- Provider
- Invitrogen Antibodies
- Product name
- Ki-67 Monoclonal Antibody (20Raj1), eFluor™ 570, eBioscience™
- Antibody type
- Monoclonal
- Antigen
- Other
- Description
- Description: The monoclonal antibody 20Raj1 recognizes the human Ki-67 protein. Two isoforms of Ki-67 exist, a 345 and 395 kDa form that are expressed in dividing cells. Ki-67 is expressed in all cell types and is detectable during active phases of the cell cycle (G1, S, G2, and mitosis) but is absent from resting cells (G0). During interphase, Ki-67 expression is localized to the nucleus but redistributes to the chromosomes during mitosis and has specifically been found to associate with heterochromatin-bound proteins such as chromobox protein homolog 3 (CBX3). In studies of tumor cells, Ki-67 expression has been used as a marker for determining the fraction of proliferating cells within a given population of tumor cells.
- Antibody clone number
- 20Raj1
- Concentration
- 0.2 mg/mL
Submitted references Highly multiplexed immunofluorescence imaging of human tissues and tumors using t-CyCIF and conventional optical microscopes.
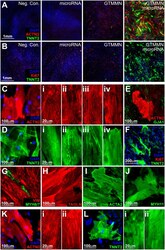
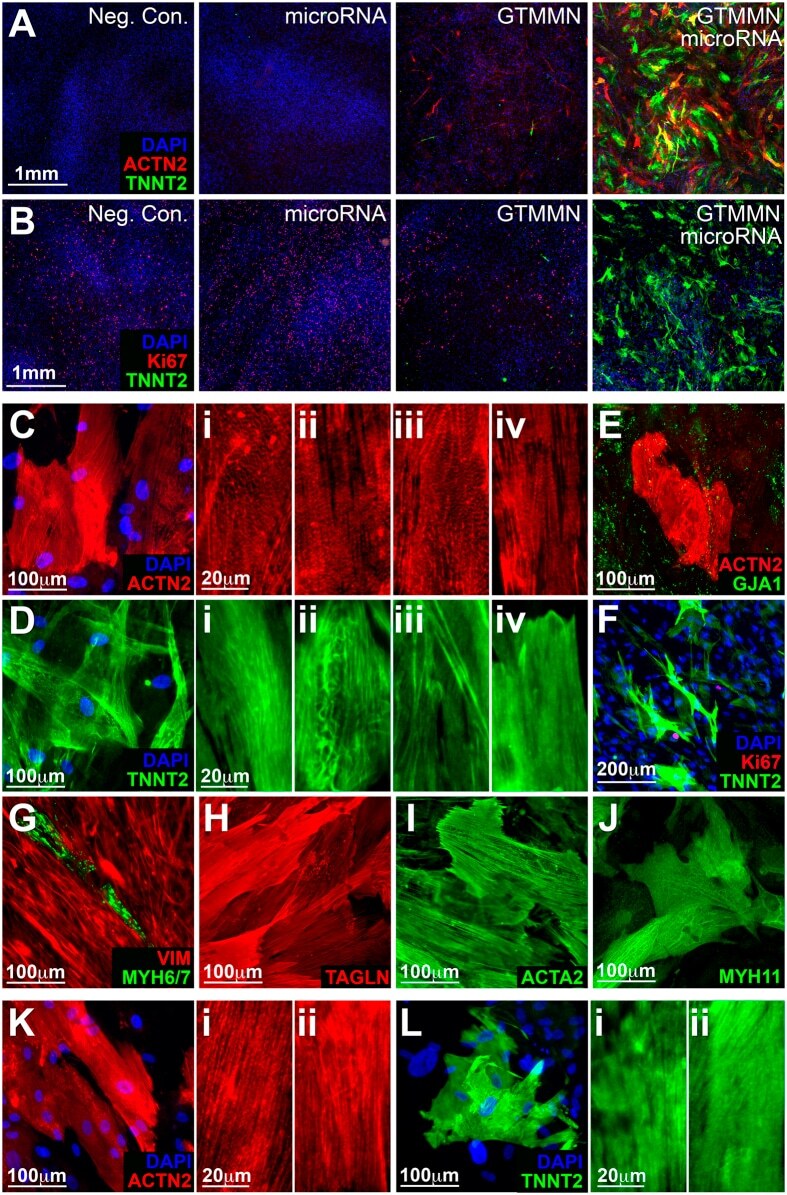
Core Transcription Factors, MicroRNAs, and Small Molecules Drive Transdifferentiation of Human Fibroblasts Towards The Cardiac Cell Lineage.
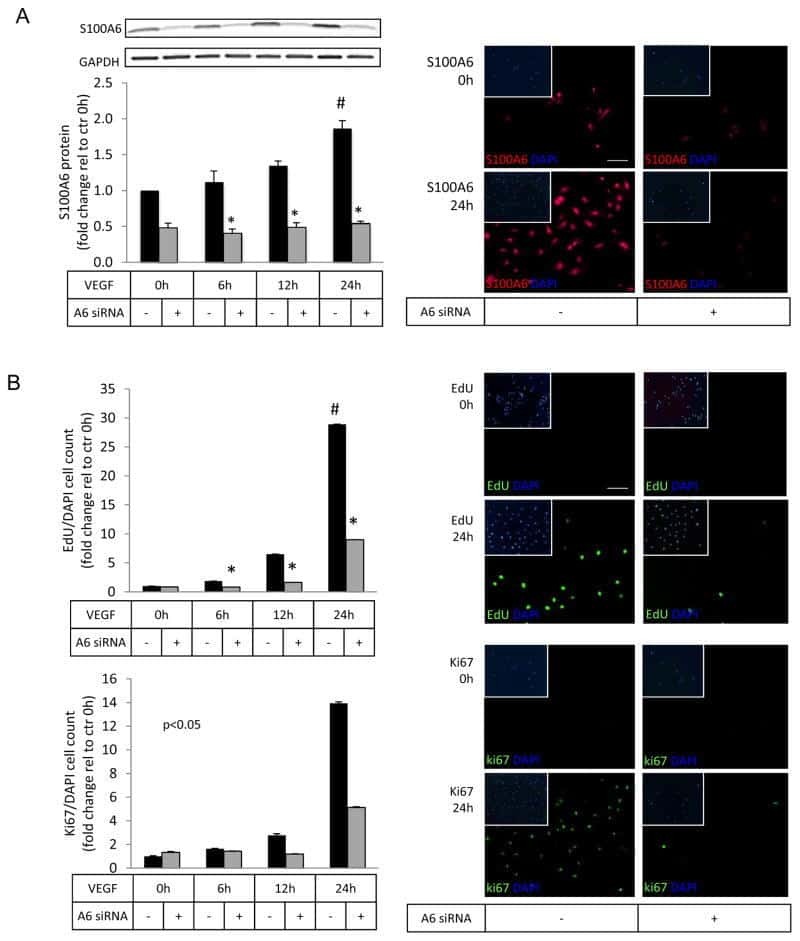
S100A6 Regulates Endothelial Cell Cycle Progression by Attenuating Antiproliferative Signal Transducers and Activators of Transcription 1 Signaling.
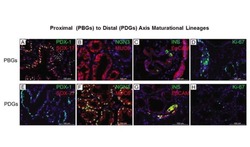
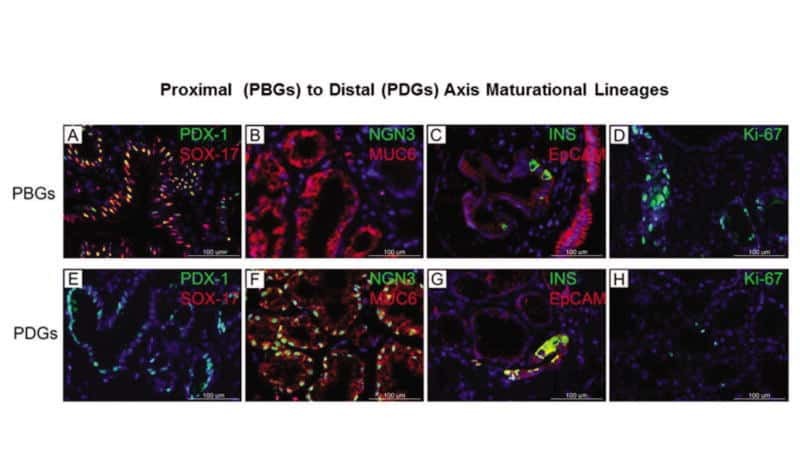
Biliary tree stem cells, precursors to pancreatic committed progenitors: evidence for possible life-long pancreatic organogenesis.
Characteristics of CD8+ T cell subsets in Chinese patients with chronic HIV infection during initial ART.
Lin JR, Izar B, Wang S, Yapp C, Mei S, Shah PM, Santagata S, Sorger PK
eLife 2018 Jul 11;7
eLife 2018 Jul 11;7
Core Transcription Factors, MicroRNAs, and Small Molecules Drive Transdifferentiation of Human Fibroblasts Towards The Cardiac Cell Lineage.
Christoforou N, Chakraborty S, Kirkton RD, Adler AF, Addis RC, Leong KW
Scientific reports 2017 Jan 10;7:40285
Scientific reports 2017 Jan 10;7:40285
S100A6 Regulates Endothelial Cell Cycle Progression by Attenuating Antiproliferative Signal Transducers and Activators of Transcription 1 Signaling.
Lerchenmüller C, Heißenberg J, Damilano F, Bezzeridis VJ, Krämer I, Bochaton-Piallat ML, Hirschberg K, Busch M, Katus HA, Peppel K, Rosenzweig A, Busch H, Boerries M, Most P
Arteriosclerosis, thrombosis, and vascular biology 2016 Sep;36(9):1854-67
Arteriosclerosis, thrombosis, and vascular biology 2016 Sep;36(9):1854-67
Biliary tree stem cells, precursors to pancreatic committed progenitors: evidence for possible life-long pancreatic organogenesis.
Wang Y, Lanzoni G, Carpino G, Cui CB, Dominguez-Bendala J, Wauthier E, Cardinale V, Oikawa T, Pileggi A, Gerber D, Furth ME, Alvaro D, Gaudio E, Inverardi L, Reid LM
Stem cells (Dayton, Ohio) 2013 Sep;31(9):1966-79
Stem cells (Dayton, Ohio) 2013 Sep;31(9):1966-79
Characteristics of CD8+ T cell subsets in Chinese patients with chronic HIV infection during initial ART.
Jiao Y, Hua W, Zhang T, Zhang Y, Ji Y, Zhang H, Wu H
AIDS research and therapy 2011 Mar 25;8:15
AIDS research and therapy 2011 Mar 25;8:15
No comments: Submit comment
Supportive validation
- Submitted by
- Invitrogen Antibodies (provider)
- Main image
- Experimental details
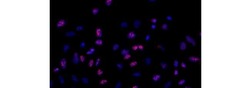
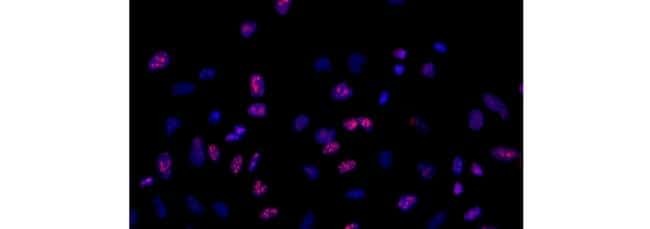
- Immunocytochemistry on fixed and permeabilized HeLa cells using 5 µg/mL Anti-Human Ki-67 eFluor® 570. Nuclei are stained with DAPI.
- Submitted by
- Invitrogen Antibodies (provider)
- Main image
- Experimental details
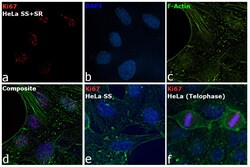
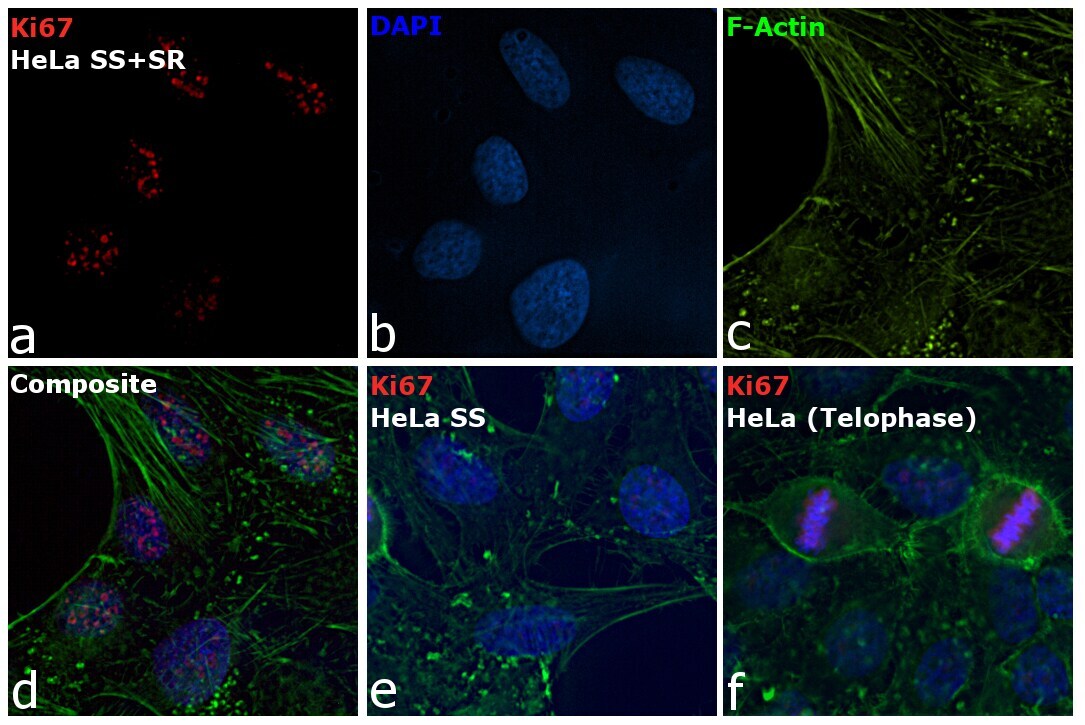
- Immunofluorescence analysis of Ki-67 Monoclonal Antibody (20Raj1), eFluor™ 570, eBioscience™ was performed using 70% confluent log phase HeLa cells serum starved (SS) for 36 hours followed by serum release (SR) for 6 hours. The cells were fixed with 4% paraformaldehyde for 10 minutes, permeabilized with 0.1% Triton™ X-100 for 15 minutes, and blocked with 2% BSA for 45 minutes at room temperature. The cells were labeled with Ki-67 Monoclonal Antibody (20Raj1), eFluor™ 570, eBioscience™ (Product # 41-5699-82) at 5 µg/mL concentration in 0.1% BSA, incubated at 4 degree celsius overnight (Panel a: Red). Nuclei (Panel b:Blue) were stained with ProLong™ Diamond Antifade Mountant with DAPI (Product # P36962). F-actin (Panel c: Green) was stained with Alexa Fluor™ Plus 488 Phalloidin (Product # A12379, 1:500 dilution). Panel d represents the merged image showing speckle-like localization in the nucleus. Panel e represents serum starved cells (36 hours) having no Ki-67 expression. Panel f represents a mitotic cell among the HeLa control cells showing Ki-67 signal on the chromatin. The images were captured at 60X magnification.
Supportive validation
- Submitted by
- Invitrogen Antibodies (provider)
- Main image
- Experimental details
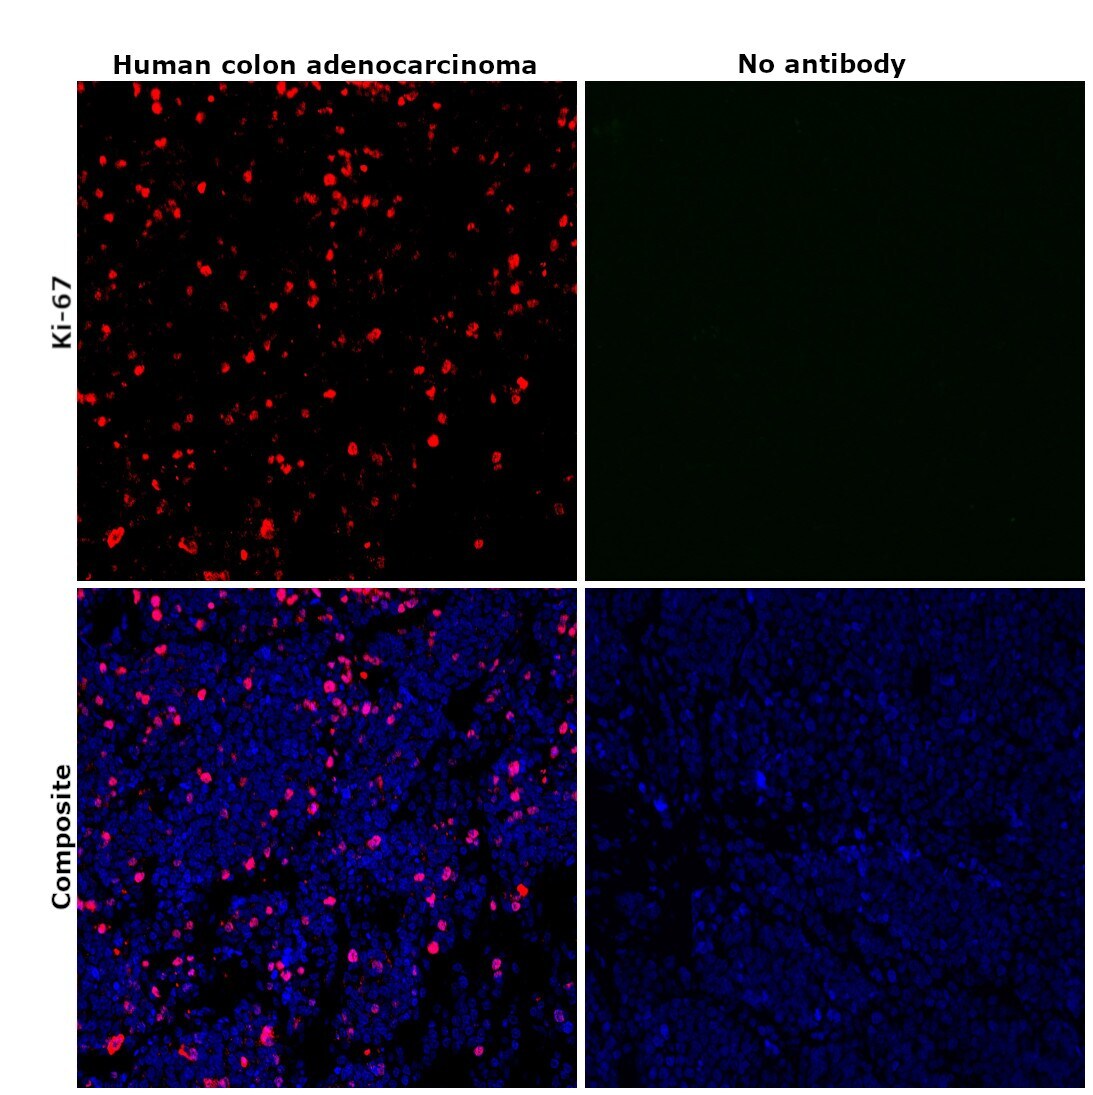
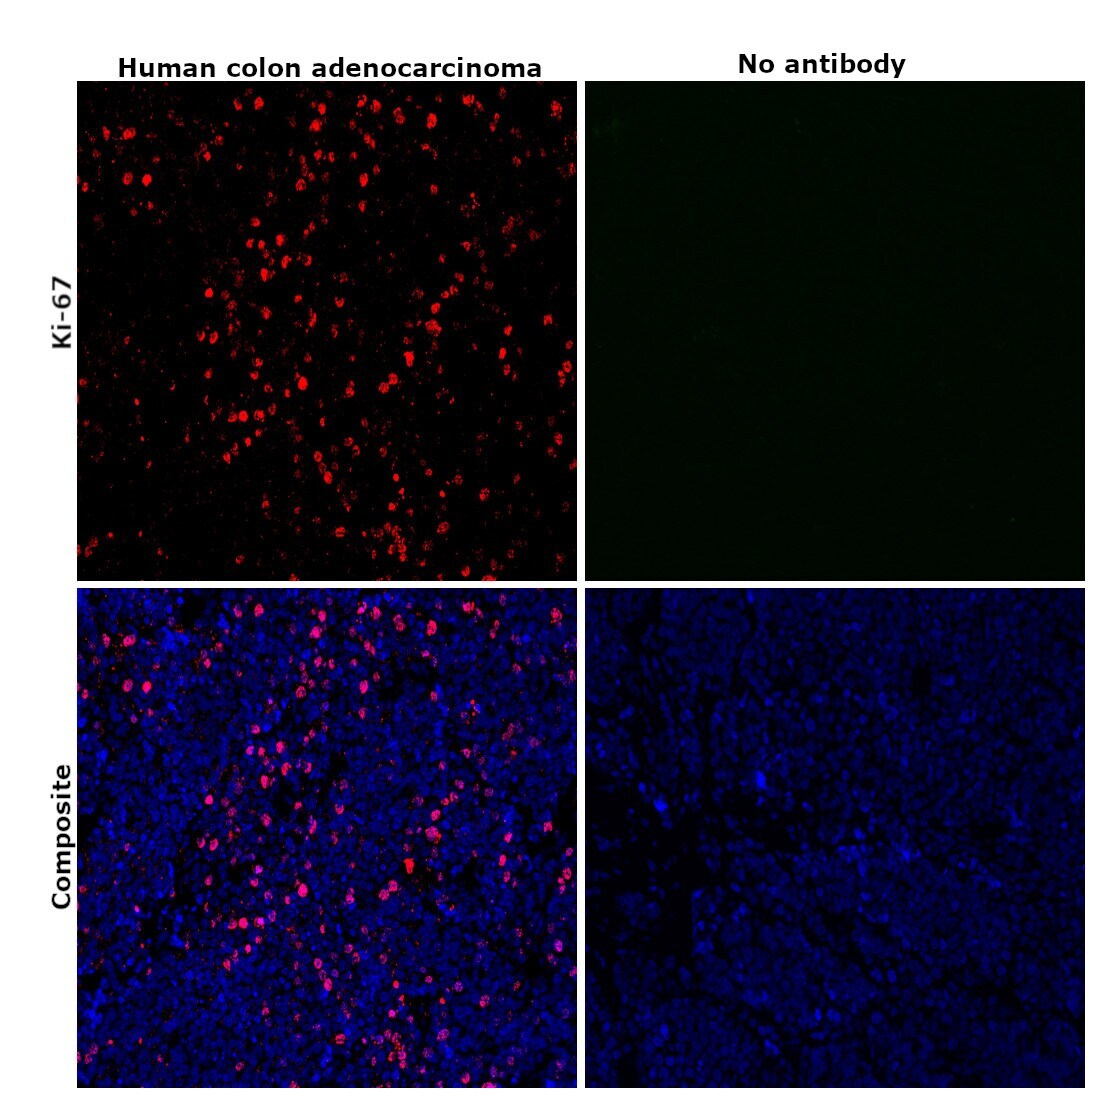
- Immunohistochemical analysis of Ki-67 was performed using formalin-fixed paraffin-embedded human colon adenocarcinoma tissue sections. To expose the target protein, heat-induced epitope retrieval was performed on de-paraffinized sections using eBioscience™ IHC Antigen Retrieval Solution - High pH (10X) (Product # 00-4956-58) diluted to 1X solution in water in a decloaking chamber at 110 degree Celsius for 15 minutes. Following antigen retrieval, the sections were blocked with 2% normal goat serum in 1X PBS for 45 minutes at room temperature and then probed with or without Ki-67 Monoclonal Antibody (20Raj1), eFluor™ 570, eBioscience™ (Product # 41-5699-82) at 1:100 dilution in 0.1% normal goat serum overnight at 4 degree Celsius in a humidified chamber. ReadyProbes™ Tissue Autofluorescence Quenching Kit (Product # R37630) was used to quench autofluorescence from the tissues. Nuclei were stained with DAPI (Product # D1306) and the sections were mounted using ProLong™ Glass Antifade Mountant (Product # P36984). The images were captured on EVOS™ M7000 Imaging System (Product # AMF7000) at 20X magnificationand externally deconvoluted.
- Submitted by
- Invitrogen Antibodies (provider)
- Main image
- Experimental details
- Immunohistochemical analysis of Ki-67 was performed using formalin-fixed paraffin-embedded human colon adenocarcinoma tissue sections. To expose the target protein, heat-induced epitope retrieval was performed on de-paraffinized sections using eBioscience™ IHC Antigen Retrieval Solution - High pH (10X) (Product # 00-4956-58) diluted to 1X solution in water in a decloaking chamber at 110 degree Celsius for 15 minutes. Following antigen retrieval, the sections were blocked with 2% normal goat serum in 1X PBS for 45 minutes at room temperature and then probed with or without Ki-67 Monoclonal Antibody (20Raj1), eFluor™ 570, eBioscience™ (Product # 41-5699-82) at 1:100 dilution in 0.1% normal goat serum overnight at 4 degree Celsius in a humidified chamber. ReadyProbes™ Tissue Autofluorescence Quenching Kit (Product # R37630) was used to quench autofluorescence from the tissues. Nuclei were stained with DAPI (Product # D1306) and the sections were mounted using ProLong™ Glass Antifade Mountant (Product # P36984). The images were captured on EVOS™ M7000 Imaging System (Product # AMF7000) at 20X magnification and externally deconvoluted.
- Submitted by
- Invitrogen Antibodies (provider)
- Main image

- Experimental details
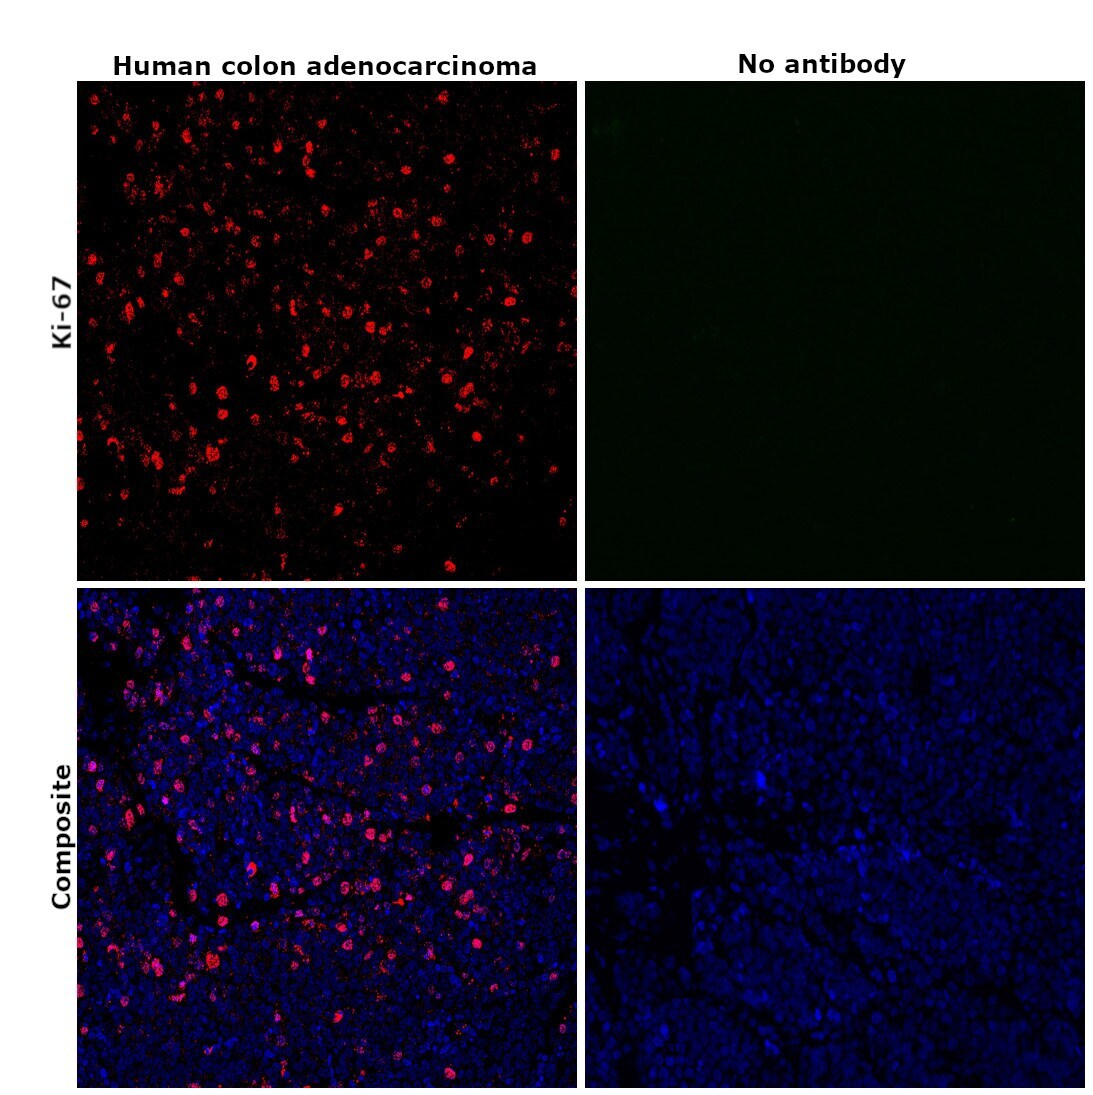
- Immunohistochemical analysis of Ki-67 was performed using formalin-fixed paraffin-embedded human colon adenocarcinoma tissue sections. To expose the target protein, heat-induced epitope retrieval was performed on de-paraffinized sections using eBioscience™ IHC Antigen Retrieval Solution - Low pH (10X) (Product # 00-4955-58) diluted to 1X solution in water in a decloaking chamber at 110 degree Celsius for 15 minutes. Following antigen retrieval, the sections were blocked with 2% normal goat serum in 1X PBS for 45 minutes at room temperature and then probed with or without Ki-67 Monoclonal Antibody (20Raj1), eFluor™ 570, eBioscience™ (Product # 41-5699-82) at 1:100 dilution in 0.1% normal goat serum overnight at 4 degree Celsius in a humidified chamber. ReadyProbes™ Tissue Autofluorescence Quenching Kit (Product # R37630) was used to quench autofluorescence from the tissues. Nuclei were stained with DAPI (Product # D1306) and the sections were mounted using ProLong™ Glass Antifade Mountant (Product # P36984). The images were captured on EVOS™ M7000 Imaging System (Product # AMF7000) at 20X magnification and externally deconvoluted.
- Submitted by
- Invitrogen Antibodies (provider)
- Main image
- Experimental details
- Immunohistochemical analysis of Ki-67 was performed using formalin-fixed paraffin-embedded human colon adenocarcinoma tissue sections. To expose the target protein, heat-induced epitope retrieval was performed on de-paraffinized sections using eBioscience™ IHC Antigen Retrieval Solution - Low pH (10X) (Product # 00-4955-58) diluted to 1X solution in water in a decloaking chamber at 110 degree Celsius for 15 minutes. Following antigen retrieval, the sections were blocked with 2% normal goat serum in 1X PBS for 45 minutes at room temperature and then probed with or without Ki-67 Monoclonal Antibody (20Raj1), eFluor™ 570, eBioscience™ (Product # 41-5699-82) at 1:100 dilution in 0.1% normal goat serum overnight at 4 degree Celsius in a humidified chamber. ReadyProbes™ Tissue Autofluorescence Quenching Kit (Product # R37630) was used to quench autofluorescence from the tissues. Nuclei were stained with DAPI (Product # D1306) and the sections were mounted using ProLong™ Glass Antifade Mountant (Product # P36984). The images were captured on EVOS™ M7000 Imaging System (Product # AMF7000) at 20X magnification and externally deconvoluted.

Supportive validation
- Submitted by
- Invitrogen Antibodies (provider)
- Main image
- Experimental details
- NULL
- Submitted by
- Invitrogen Antibodies (provider)
- Main image

- Experimental details
- NULL
- Submitted by
- Invitrogen Antibodies (provider)
- Main image
- Experimental details
- Figure 2 Immunofluorescence characterization of transdifferentiated iCM (cardiac TF and microRNA). ( A ) Expression of ACTN2 and TNNT2 or ( B ) Expression of TNNT2 and Ki67 in HDF transdifferentiated for 2 weeks using induced expression of GATA4, TBX5, MEF2C, MYOCD, NKX2-5 and transfection with hsa-miR-1 and hsa-miR-133a. (Controls: M2rtTA only, microRNA only, cardiac TF only). ( C ) ACTN2. Panels on the right show varying degrees of cytoskeletal organization of ACTN2. ( D ) TNNT2. Panels on the right show varying degrees of cytoskeletal organization of TNNT2. ( E ) ACTN2 and GJA1. ( F ) TNNT2 and Ki67 expression in iCM. ( G ) VIM and MYH6/7. ( H ) TAGLN. ( I ) SMA. ( J ) MYH11. ( K ) ACTN2 expression in iCM 4 weeks following initiation of transdifferentiation. Panels on the right show varying degrees of cytoskeletal organization of ACTN2. ( L ) TNNT2 expression in iCM 4 weeks following initiation of transdifferentiation. Panels on the right show varying degrees of cytoskeletal organization of TNNT2.
- Submitted by
- Invitrogen Antibodies (provider)
- Main image
- Experimental details
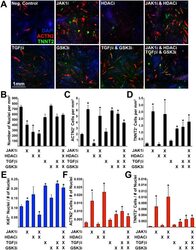
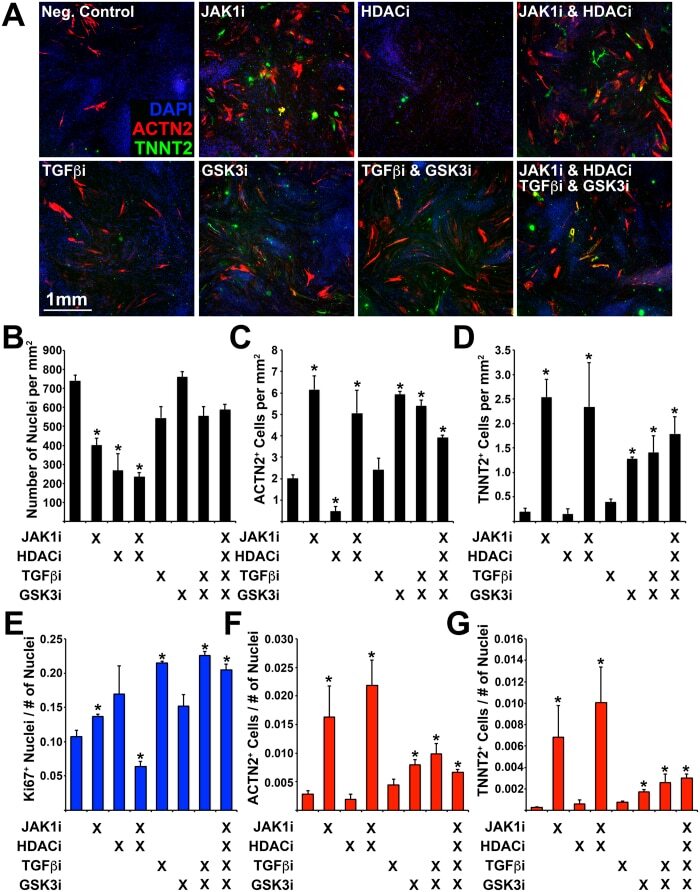
- Figure 6 Determining the effect of small molecule inhibitors on transdifferentiation efficiency. ( A ) Immunofluorescence of transdifferentiated cells (ACTN2/TNNT2) during exposure to small molecule inhibitors: Janus protein tyrosine kinase 1 (JAK1i), Sodium Butyrate (HDACi), SB431542 (TGFbetai), CHIR99021 (GSK3i). ( B ) Number of nuclei, ( C ) Number of ACTN2 + cells, and ( D ) Number of TNNT2 + cells (per mm 2 ). ( E ) Number of Ki67 + nuclei normalized to the total number of nuclei. ( F ) Number of ACTN2 + cells normalized to the total number of nuclei. ( G ) Number of TNNT2 + cells normalized to the total number of nuclei. Experiment performed in triplicate. 4 images were analyzed for each experiment. Error bar represents calculated standard deviation. Significant difference between two values was calculated using t-test (two-tailed distribution, two sample unequal variance).
- Submitted by
- Invitrogen Antibodies (provider)
- Main image
- Experimental details
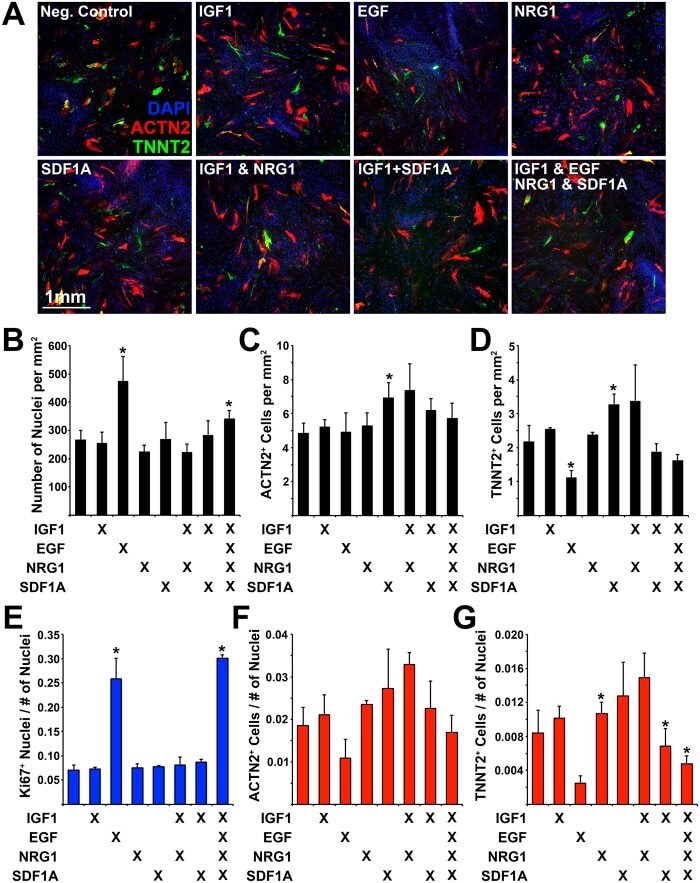
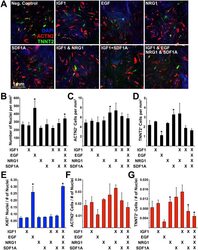
- Figure 7 Determining the effect of protein ligands on transdifferentiation efficiency. ( A ) Immunofluorescence of transdifferentiated cells (ACTN2/TNNT2) during exposure to protein ligands: IGF1, EGF, NRG1, SDF1A. ( B ) Number of nuclei, ( C ) Number of ACTN2 + cells, and ( D ) Number of TNNT2 + cells (per mm 2 ). ( E ) Number of Ki67 + nuclei normalized to the total number of nuclei. ( F ) Number of ACTN2 + cells normalized to the total number of nuclei. ( G ) Number of TNNT2 + cells normalized to the total number of nuclei. Experiment performed in triplicate. 4 images were analyzed for each experiment. Error bar represents calculated standard deviation. Significant difference between two values was calculated using t-test (two-tailed distribution, two sample unequal variance).