Explore
 Validate
 Learn
Learn Western blot
 Immunocytochemistry
Antibody data
- Antibody Data
- Antigen structure
- References [1]
- Comments [0]
- Validations
- Immunocytochemistry [6]
- Immunohistochemistry [1]
- Other assay [1]
Submit
Validation data
Reference
Comment
Report error
- Product number
- PA5-31157 - Provider product page

- Provider
- Invitrogen Antibodies
- Product name
- HADH Polyclonal Antibody
- Antibody type
- Polyclonal
- Antigen
- Recombinant full-length protein
- Description
- Recommended positive controls: 293T, A431, HeLa, HepG2, mouse liver, rat heart, rat liver. Predicted reactivity: Mouse (90%), Rat (91%), Xenopus laevis (85%), Pig (92%), Chicken (81%), Rhesus Monkey (96%), Bovine (90%). Store product as a concentrated solution. Centrifuge briefly prior to opening the vial.
- Reactivity
- Human, Mouse, Rat
- Host
- Rabbit
- Isotype
- IgG
- Vial size
- 100 μL
- Concentration
- 0.49 mg/mL
- Storage
- Store at 4°C short term. For long term storage, store at -20°C, avoiding freeze/thaw cycles.
Submitted references Molecular Liver Fingerprint Reflects the Seasonal Physiology of the Grey Mouse Lemur (Microcebus murinus) during Winter.
Chazarin B, Benhaim-Delarbre M, Brun C, Anzeraey A, Bertile F, Terrien J
International journal of molecular sciences 2022 Apr 12;23(8)
International journal of molecular sciences 2022 Apr 12;23(8)
No comments: Submit comment
Supportive validation
- Submitted by
- Invitrogen Antibodies (provider)
- Main image
- Experimental details
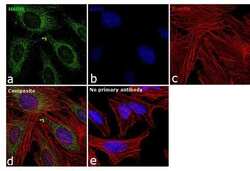
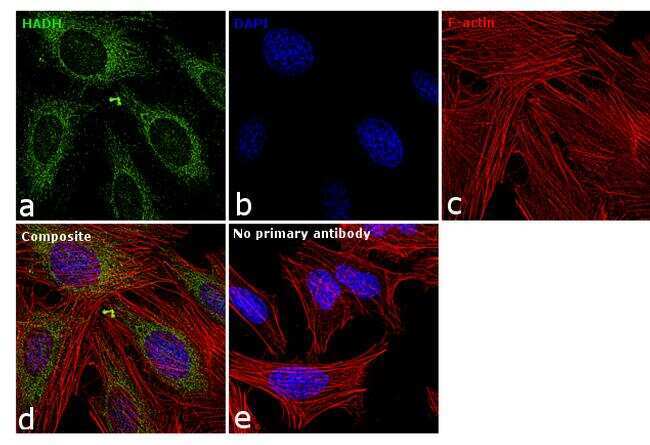
- Immunofluorescence analysis of HADH was performed using 70% confluent log phase HeLa cells. The cells were fixed with 4% paraformaldehyde for 10 minutes, permeabilized with 0.1% Triton™ X-100 for 15 minutes, and blocked with 1% BSA for 1 hour at room temperature. The cells were labeled with HADH Polyclonal Antibody (Product # PA5-31157) at 1:100 dilution in 0.1% BSA, incubated at 4 degree Celsius overnight and then labeled with Goat anti-Rabbit IgG (H+L) Superclonal™ Secondary Antibody, Alexa Fluor® 488 conjugate (Product # A27034) at a dilution of 1:2000 for 45 minutes at room temperature (Panel a: green). Nuclei (Panel b: blue) were stained with SlowFade® Gold Antifade Mountant with DAPI (Product # S36938). F-actin (Panel c: red) was stained with Rhodamine Phalloidin (Product # R415, 1:300). Panel d represents the merged image showing cytoplasmic localization. Panel e represents control cells with no primary antibody to assess background. The images were captured at 60X magnification.
- Submitted by
- Invitrogen Antibodies (provider)
- Main image
- Experimental details
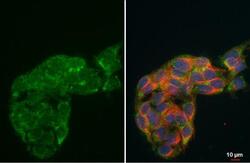
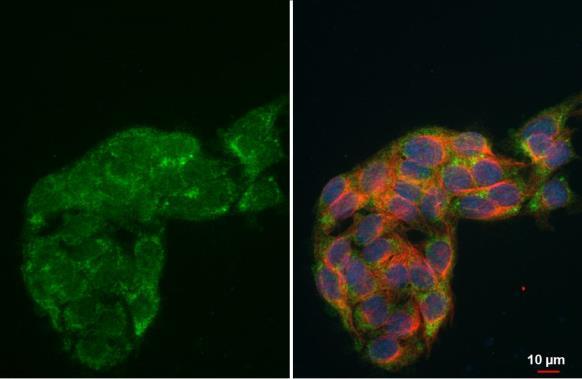
- HADH Polyclonal Antibody detects HADH protein at Mitochondria by immunofluorescent analysis. Sample: HeLa cells were fixed in 2% paraformaldehyde/culture medium at 37ºC for 30 min. Green: HADH protein stained by HADH Polyclonal Antibody (Product # PA5-31157) diluted at 1:500. Blue: Hoechst 33343 staining.
- Submitted by
- Invitrogen Antibodies (provider)
- Main image
- Experimental details
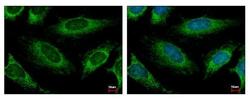
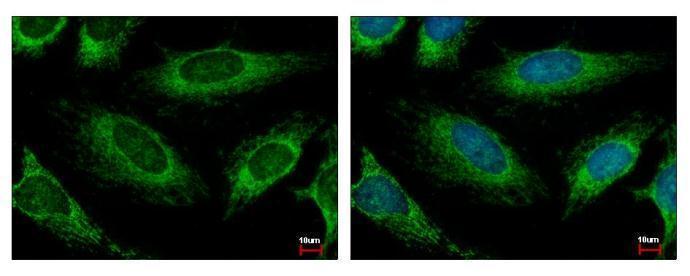
- HADH Polyclonal Antibody detects HADH protein at mitochondria by immunofluorescent analysis. Sample: HepG2 cells were fixed in 4% paraformaldehyde at RT for 15 min. Green: HADH stained by HADH Polyclonal Antibody (Product # PA5-31157) diluted at 1:500. Red: alpha Tubulin, a cytoskeleton marker, stained by alpha Tubulin Polyclonal Antibody [GT114] (Product # MA5-31466) diluted at 1:1,000. Blue: Fluoroshield with DAPI .
- Submitted by
- Invitrogen Antibodies (provider)
- Main image

- Experimental details
- HADH Polyclonal Antibody detects HADH protein at Mitochondria by immunofluorescent analysis. Sample: HeLa cells were fixed in 2% paraformaldehyde/culture medium at 37ºC for 30 min. Green: HADH protein stained by HADH Polyclonal Antibody (Product # PA5-31157) diluted at 1:500. Blue: Hoechst 33343 staining.

- Submitted by
- Invitrogen Antibodies (provider)
- Main image

- Experimental details
- HADH Polyclonal Antibody detects HADH protein at mitochondria by immunofluorescent analysis. Sample: HepG2 cells were fixed in 4% paraformaldehyde at RT for 15 min. Green: HADH stained by HADH Polyclonal Antibody (Product # PA5-31157) diluted at 1:500. Red: alpha Tubulin, a cytoskeleton marker, stained by alpha Tubulin Polyclonal Antibody [GT114] (Product # MA5-31466) diluted at 1:1,000. Blue: Fluoroshield with DAPI .

- Submitted by
- Invitrogen Antibodies (provider)
- Main image

- Experimental details
- Immunofluorescence analysis of HADH was performed using 70% confluent log phase HeLa cells. The cells were fixed with 4% paraformaldehyde for 10 minutes, permeabilized with 0.1% Triton™ X-100 for 15 minutes, and blocked with 1% BSA for 1 hour at room temperature. The cells were labeled with HADH Polyclonal Antibody (Product # PA5-31157) at 1:100 dilution in 0.1% BSA, incubated at 4 degree Celsius overnight and then labeled with Goat anti-Rabbit IgG (Heavy Chain) Superclonal™ Secondary Antibody, Alexa Fluor® 488 conjugate (Product # A27034) at a dilution of 1:2000 for 45 minutes at room temperature (Panel a: green). Nuclei (Panel b: blue) were stained with SlowFade® Gold Antifade Mountant with DAPI (Product # S36938). F-actin (Panel c: red) was stained with Rhodamine Phalloidin (Product # R415, 1:300). Panel d represents the merged image showing cytoplasmic localization. Panel e represents control cells with no primary antibody to assess background. The images were captured at 60X magnification.

Supportive validation
- Submitted by
- Invitrogen Antibodies (provider)
- Main image
- Experimental details
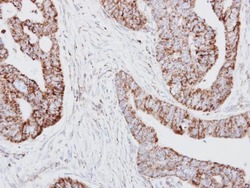
- HADH Polyclonal Antibody detects HADH protein at mitochondria on human colon carcinoma by immunohistochemical analysis. Sample: Paraffin-embedded colon carcinoma. HADH Polyclonal Antibody (Product # PA5-31157) dilution: 1:250. Antigen Retrieval: EDTA based buffer, pH 8.0, 15 min.

Supportive validation
- Submitted by
- Invitrogen Antibodies (provider)
- Main image
- Experimental details
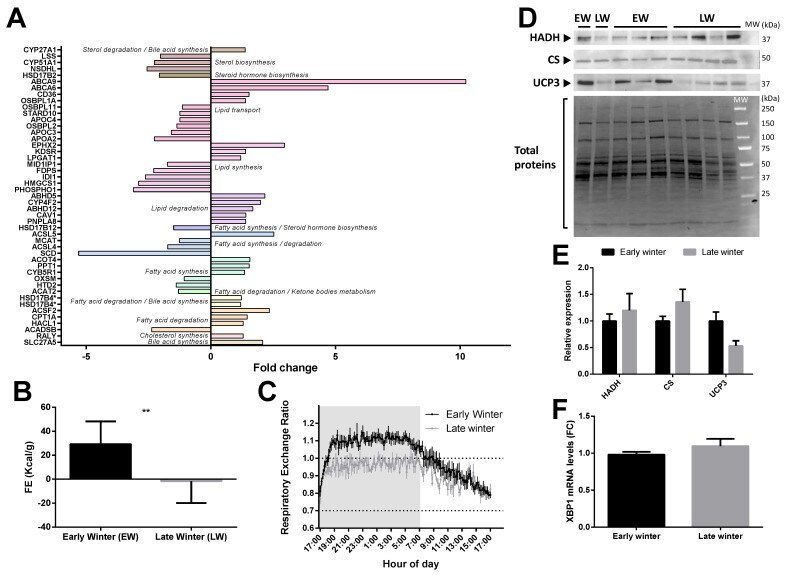
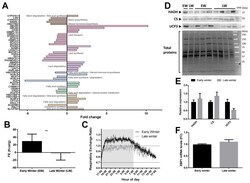
- Regulation of liver lipid metabolism in grey mouse lemurs during winter. The relative abundance of liver proteins involved in carbohydrate metabolism in early (EW) and late (LW) winter mouse lemurs (N = 5/group) is shown using mean fold changes in LW vs EW (panel A ; presence of several isoforms of the same protein are indicated with asterisks (*). Food efficiency (FE), calculated as the ratio between food intake (in Kcal/day) and BMC were significantly different between EW and LW animals (panel B ), and the respiratory exchange ratio measured in EW (black line) vs. LW (grey line) reflected the main energy substrates used, depending on time-of-day (panel C ). Protein expression levels of mitochondrial hydroxyacyl-coenzyme A dehydrogenase (HADH), citrate synthase (CS) and uncoupling protein 3 (UCP3) were measured using Western-blot analysis in liver samples from mouse lemurs in EW and LW (blots shown in panel D and relative expression in (panel E ); N = 4-5/group; results are presented as the means +- SEM). XBP1 gene expression levels did not differ in the liver of adult male mouse lemurs between EW and LW (panel F ). * and ** indicate significance at p < 0.05 and 0.01 between EW and LW, respectively.