Explore
 Validate
 Learn
Learn Western blot
Antibody data
- Antibody Data
- Antigen structure
- References [0]
- Comments [0]
- Validations
- Western blot [2]
- Immunocytochemistry [1]
- Other assay [13]
Submit
Validation data
Reference
Comment
Report error
- Product number
- MA5-15738-D680 - Provider product page

- Provider
- Invitrogen Antibodies
- Product name
- GAPDH Loading Control Monoclonal Antibody (GA1R), DyLight™ 680
- Antibody type
- Monoclonal
- Antigen
- Recombinant full-length protein
- Description
- MA5-15738-D680 has successfully been used in immunofluorescence and Western blot applications. DyLight 680 has an excitation/emission of 692/712 nm.
- Reactivity
- Human, Mouse, Rat, Bacteria, Chicken/Avian, Hamster, Rabbit, Yeast
- Host
- Mouse
- Conjugate
- Near infrared dye
- Isotype
- IgG
- Antibody clone number
- GA1R
- Vial size
- 50 µL
- Concentration
- 1 mg/mL
- Storage
- 4° C, do not freeze
No comments: Submit comment
Supportive validation
- Submitted by
- Invitrogen Antibodies (provider)
- Main image
- Experimental details
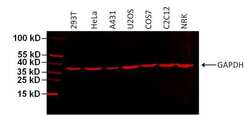
- Western blot analysis of GAPDH was performed by loading 75 µg of various cell lysates per well onto a 4-20% Tris-HCl polyacrylamide gel. Proteins were transferred to a PVDF membrane and blocked with 5% BSA/TBST for at least 1 hour. The membrane was probed with a DyLight 680-conjugated GAPDH monoclonal antibody (Product # MA5-15738-D680) at a dilution of 1:1000 for 1 hour at room temperature on a rocking platform and washed in TBS-0.1% Tween-20. Detection was performed using the LI-COR Odyssey.
- Conjugate
- Near infrared dye

- Submitted by
- Invitrogen Antibodies (provider)
- Main image
- Experimental details
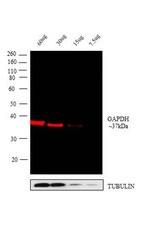
- Western blot analysis was performed on whole cell extracts of A431 - 60 µg lysate (Lane 1), 30 µg lysate (Lane 2), 15 µg lysate (Lane 3) and 7.5 µg lysate (Lane 4). The blots were probed with GAPDH Loading Control Mouse Monoclonal Antibody (GA1R), DyLight 680 (Product # MA5-15738-D680 ).A 37 kDa band corresponding to GAPDH was observed across different concentrations of lysate tested. Known quantity of protein samples were electrophoresed using Novex® NuPAGE® 4-12 % Bis-Tris gel (Product # NP0321BOX), XCell SureLock™ Electrophoresis System (Product # EI0002) and Novex® Sharp Pre-Stained Protein Standard (Product # LC5800). Resolved proteins were then transferred onto a nitrocellulose membrane with iBlot® 2 Dry Blotting System (Product # IB21001). The membrane was probed with the relevant primary Antibody following blocking with 5 % skimmed milk. The membrane was probed with the relevant primary and secondary antibody after blocking with 5 % skimmed milk. Fluorescent detection was performed using the Odyssey® Fc imaging system (Li-cor Biosciences).
- Conjugate
- Near infrared dye

Supportive validation
- Submitted by
- Invitrogen Antibodies (provider)
- Main image
- Experimental details
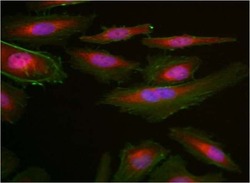
- Immunofluorescent analysis of GAPDH (red) in HeLa cells. Formalin fixed cells were permeabilized with 0.1% Triton X-100 in TBS for 10 minutes at room temperature and blocked with 1% Blocker BSA (Product # 37525) for 15 minutes at room temperature. Cells were probed with a DyLight 680-conjugated GAPDH monoclonal antibody (Product # MA5-15738-D680) at a dilution of 1:50 for at least 1 hour at room temperature. F-actin (green) was stained with DyLight 488 Phalloidin (Product # 21833) and nuclei (blue) were stained with Hoechst 33342 dye (Product # 62249). Images were taken on a Thermo Scientific ArrayScan or ToxInsight Instrument at 20X magnification.
- Conjugate
- Near infrared dye

Supportive validation
- Submitted by
- Invitrogen Antibodies (provider)
- Main image
- Experimental details
- NULL
- Conjugate
- Near infrared dye
- Submitted by
- Invitrogen Antibodies (provider)
- Main image
- Experimental details
- NULL
- Conjugate
- Near infrared dye
- Submitted by
- Invitrogen Antibodies (provider)
- Main image

- Experimental details
- NULL
- Conjugate
- Near infrared dye
- Submitted by
- Invitrogen Antibodies (provider)
- Main image
- Experimental details
- NULL
- Conjugate
- Near infrared dye
- Submitted by
- Invitrogen Antibodies (provider)
- Main image
- Experimental details
- NULL
- Conjugate
- Near infrared dye

- Submitted by
- Invitrogen Antibodies (provider)
- Main image

- Experimental details
- NULL
- Conjugate
- Near infrared dye
- Submitted by
- Invitrogen Antibodies (provider)
- Main image
- Experimental details
- NULL
- Conjugate
- Near infrared dye
- Submitted by
- Invitrogen Antibodies (provider)
- Main image
- Experimental details
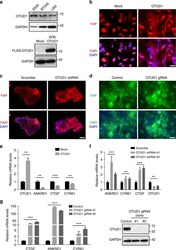
- Fig. 5 OTUD1 inhibits nuclear localization and transcriptional activity of YAP. a Upper panel: immunoblotting of OTUD1 and GAPDH in HEK293A, BT549, and LM2 cell lines. Lower panel: immunoblotting of FLAG-OTUD1 and GAPDH in LM2 cells stably transfected with SFB-OTUD1. b LM2 cells stably overexpressing OTUD1 were immunostained with a YAP-specific antibody (red). DAPI (blue) was used to stain DNA. Scale bar, 20 mum. c , d HEK293A cells expressing OTUD1 shRNA ( c ) or gRNA ( d ) were immunostained with a YAP-specific antibody (red in c ; green in d ). DAPI (blue) was used to stain DNA. Scale bar, 20 mum. e - g qPCR of ANKRD1 , CTGF , and CYR61 in BT549 cells expressing HA-OTUD1 ( e ) and in HEK293A cells expressing OTUD1 shRNA ( f ) or OTUD1 gRNA ( g , left panel). Right panel in g : immunoblotting of OTUD1 and GAPDH in two independent OTUD1 knockout HEK293A clones generated by CRISPR-Cas9. n = 3 biological replicates. Error bars in e - g are s.e.m. Statistical significance was determined by a two-tailed, unpaired Student's t -test. * P < 0.05; ** P < 0.01; *** P < 0.001
- Conjugate
- Near infrared dye

- Submitted by
- Invitrogen Antibodies (provider)
- Main image
- Experimental details
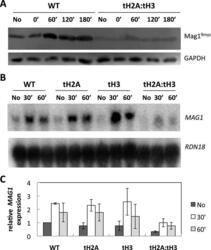
- Figure 3. Mag1 protein expression and MAG1 mRNA expression are reduced in tH2A:tH3 cells. WT and the N-tail deletion mutants were treated with 0.2% MMS for 10 min and further analyzed at the indicated time points. ( A ) Mag1 9myc and GAPDH were detected via western blotting. ( B ) A northern blot detecting MAG1 and reprobed for RDN18 . [We note that the small band shift between the tH3(60') sample and the tH2A:tH3 samples is due to a gel running artifact]. ( C ) Quantification of different gels, such as shown in (B) by normalizing MAG1 levels to that of WT in the absence of MMS. Error bars indicate standard deviations derived from three independent experiments.
- Conjugate
- Near infrared dye

- Submitted by
- Invitrogen Antibodies (provider)
- Main image
- Experimental details
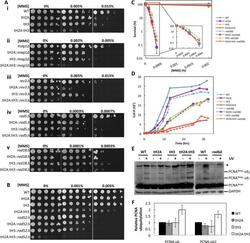
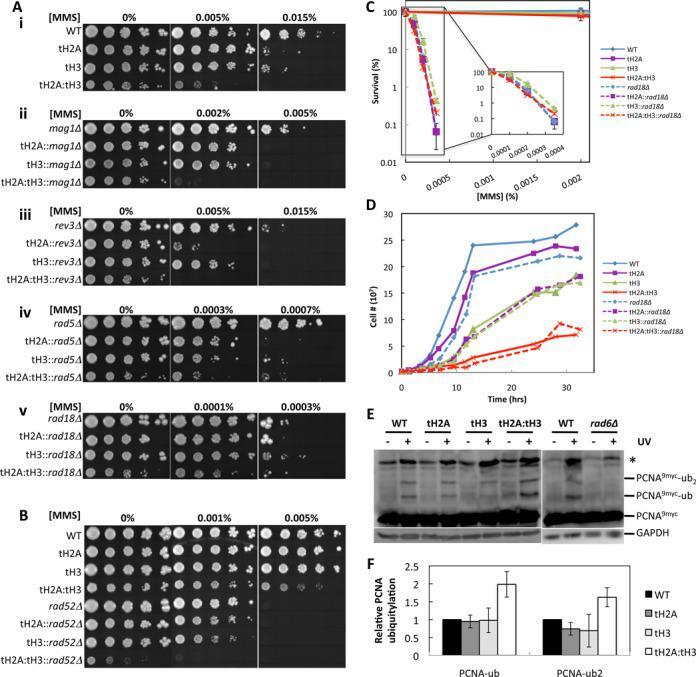
- Figure 6. The N-tails of H2A and H3 are epistatic to RAD18 . ( A ) Epistasis studies of (i) N-tail deletion mutants combinatorially deleted for (ii) MAG1 , (iii) REV3 , (iv) RAD5 and (v) RAD18 . ( B ) Epistasis study of N-tail deletion mutants combinatorially deleted for RAD52 . ( C ) MMS survival assay of WT and N-tail mutants (solid lines) and the N-tail mutants combinatorially deleted for RAD18 (dashed lines). ( D ) Growth curves of the cells in ( C ) in the absence of MMS. ( E ) Western blot of PCNA 9myc in WT and N-tail mutants before UV exposure and after a 1 h recovery in YPD following 100 J/m 2 of UV irradiation. GAPDH is used as the loading control. rad6Delta serves as a negative control for PCNA ubiquitylation. ( F ) Quantifications of (E) by normalizing (PCNA 9myc -ub)/(PCNA 9myc -total) and (PCNA 9myc -ub 2 )/(PCNA 9myc -total) to WT. Error bars indicate standard deviations from three independent experiments.
- Conjugate
- Near infrared dye
- Submitted by
- Invitrogen Antibodies (provider)
- Main image
- Experimental details
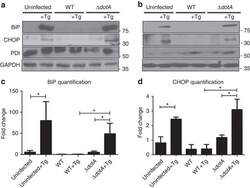
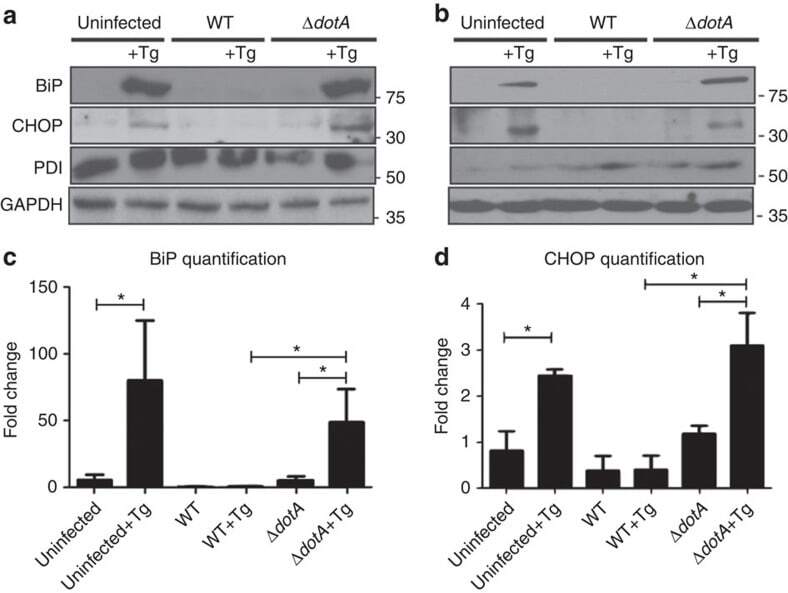
- Figure 1 Expression of two critical components of the UPR, BiP and CHOP are blocked by L. pneumophila ( a ) Caspase 1/11 (-/-) bone marrow derived macrophages or ( b ) HEK-293 FCgamma cells-expressing Fc gamma (HEK-293 FCgamma) were either left uninfected or infected with WT or DeltadotA strains of L. pneumophila at an MOI of 150. Cells were then left untreated or treated with thapsigargin (Tg; 1 mug mul -1 ) for 6 h. BiP, CHOP and PDI protein expression were monitored via immunoblot. GAPDH was used as a loading control. Full blots are provided for Fig. 1a,b in Supplementary Fig. 5 . ( c , d ) BiP and CHOP levels were quantified respectively from three biological replicates using the same experimental conditions in HEK-293 FCgamma cells. Data are depicted as the fold change normalized to uninfected levels. Data represent three independent experiments. Values in all graphs are means+-s.e.m. * P
- Conjugate
- Near infrared dye
- Submitted by
- Invitrogen Antibodies (provider)
- Main image
- Experimental details
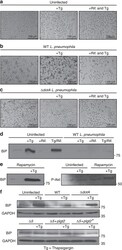
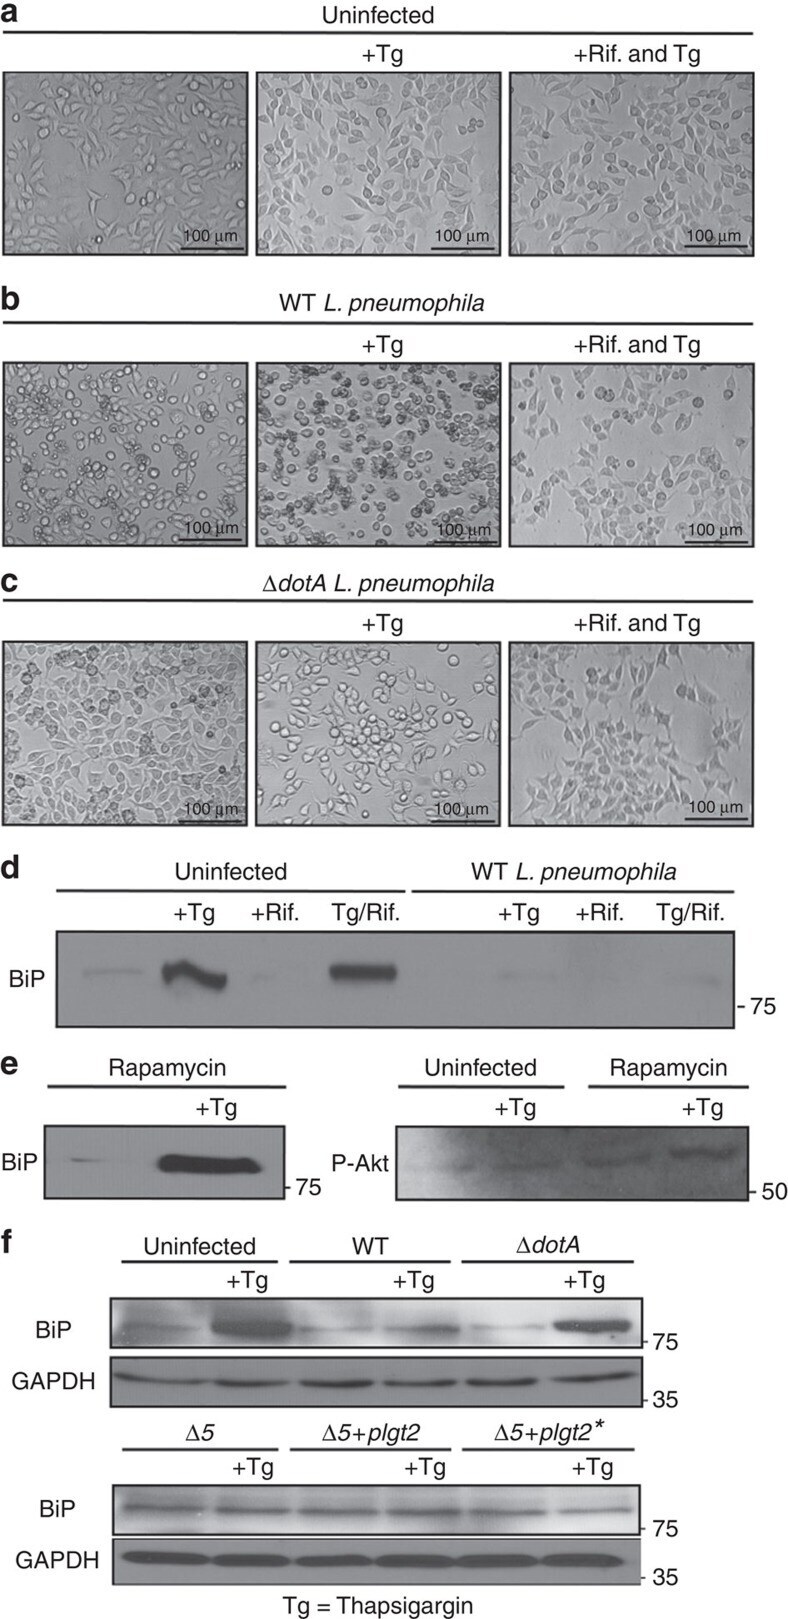
- Figure 3 Suppression of ER stress is an effector driven process that is independent of the mTOR pathway. ( a - c ) HEK-293 FCgamma cells were either left uninfected or infected with WT L. pneumophila or DeltadotA L. pneumophila at an MOI of 150. Cells were then either left untreated or treated with thapsigargin (Tg; 1 mug mul -1 ) or treated with a combination of Tg and the antibiotic Rifampicin (Rif.; 2 mug mul -1 ) for 6 h. After 6 h phase contrast images were taken. ( d ) HEK-293 FCgamma cells were infected at an MOI of 150 with WT L. pneumophila , or left uninfected. Cells were then treated with Rif. alone (2 mug mul -1 ), Rif. with Tg (1 mug mul -1 ), Tg (1 mug mul -1 ) alone or left untreated for 6 h. BiP protein levels were monitored via immunoblot. ( e ) HEK-293 FCgamma cells were untreated or treated with rapamycin (10 nM) or rapamycin with Tg (1 mug mul -1 ) for 6 h. BiP protein levels were then monitored via immunoblot and levels of phosphorylated Akt at serine 473 (P-Akt) were monitored from these lysates via immunoblot. ( f ) RAW 264.7 cells were infected with WT L. pneumophila, dotA , or Delta 5 strains of L. pneumophila at an MOI of 150. BiP protein expression was monitored via immunoblot. GAPDH was used as a loading control. Full blots for Fig. 3d-f are provided in Supplementary Fig. 5 .
- Conjugate
- Near infrared dye
- Submitted by
- Invitrogen Antibodies (provider)
- Main image
- Experimental details
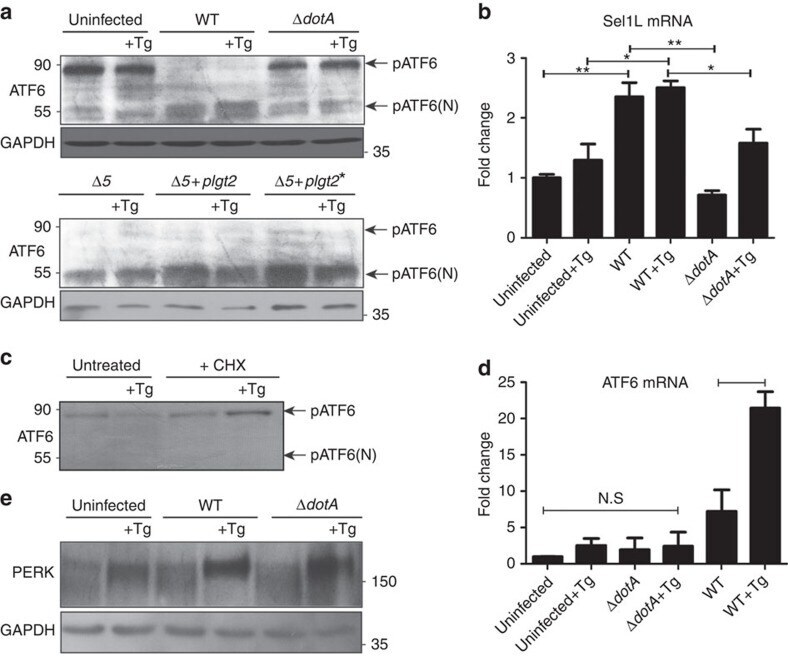
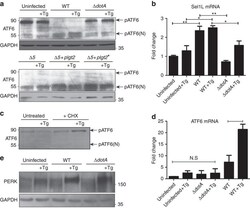
- Figure 6 ATF6 is processed during L. pneumophila infection. ( a ) RAW 264.7 cells were left uninfected or infected with either WT L. pneumophila , DeltadotA , B. Delta5, Delta5+plgt2, or Delta5 plgt2* (catalytically dead lgt2) at an MOI of 150. Cells were then left untreated or treated with thapsigargin (Tg; 1 mug mul -1 ) for 6 h. Full-length ATF6 (pATF6) and cleaved pATF6(N) were monitored via immunoblot. Full blots for Fig. 6a are provided in Supplementary Fig. 5 . ( b ) HEK-293 FCgamma cells infected with either WT L. pneumophila or DeltadotA and then treated for 6 h with Tg (1 mug mul -1 ). Sel1L mRNA levels were then monitored via qRT-PCR, with GAPDH serving as an endogenous control. Two biological replicates were used each with three technical replicates using the identical experimental conditions. Values in all graphs are means+-s.e.m. * P
- Conjugate
- Near infrared dye