 Explore
 Validate
 Learn
Learn Western blot
Antibody data
- Antibody Data
- Antigen structure
- References [0]
- Comments [0]
- Validations
- Western blot [1]
- Other assay [21]
Submit
Validation data
Reference
Comment
Report error
- Product number
- MA5-15738-HRP - Provider product page

- Provider
- Invitrogen Antibodies
- Product name
- GAPDH Loading Control Monoclonal Antibody (GA1R), HRP
- Antibody type
- Monoclonal
- Antigen
- Recombinant full-length protein
- Description
- MA5-15738-HRP has been successfully used in Western blotting applications with yeast, bacteria, insect, human, mouse, rat, rabbit, hamster, and chicken samples.
- Reactivity
- Human, Mouse, Rat, Bacteria, Chicken/Avian, Hamster, Rabbit, Yeast
- Host
- Mouse
- Conjugate
- Horseradish Peroxidase
- Isotype
- IgG
- Antibody clone number
- GA1R
- Vial size
- 50 µL
- Concentration
- 1 mg/mL
- Storage
- 4° C
No comments: Submit comment
Supportive validation
- Submitted by
- Invitrogen Antibodies (provider)
- Main image

- Experimental details
- Western blot analysis of GAPDH was performed by loading 50 µg of various cell lysates per well onto a 4-20% Tris-HCl polyacrylamide gel. Proteins were transferred to a PVDF membrane and blocked with 5% BSA/TBST for at least 1 hour. The membrane was probed with an HRP-conjugated GAPDH monoclonal antibody (Product # MA5-15738-HRP) at a dilution of 1:1000 overnight at 4°C on a rocking platform and washed in TBS-0.1% Tween-20. Chemiluminescent detection was performed using SuperSignal West Pico (Product # 34080).
- Conjugate
- Horseradish Peroxidase

Supportive validation
- Submitted by
- Invitrogen Antibodies (provider)
- Main image
- Experimental details
- NULL
- Conjugate
- Horseradish Peroxidase

- Submitted by
- Invitrogen Antibodies (provider)
- Main image
- Experimental details
- NULL
- Conjugate
- Horseradish Peroxidase
- Submitted by
- Invitrogen Antibodies (provider)
- Main image
- Experimental details
- NULL
- Conjugate
- Horseradish Peroxidase

- Submitted by
- Invitrogen Antibodies (provider)
- Main image

- Experimental details
- NULL
- Conjugate
- Horseradish Peroxidase
- Submitted by
- Invitrogen Antibodies (provider)
- Main image
- Experimental details
- NULL
- Conjugate
- Horseradish Peroxidase

- Submitted by
- Invitrogen Antibodies (provider)
- Main image
- Experimental details
- NULL
- Conjugate
- Horseradish Peroxidase
- Submitted by
- Invitrogen Antibodies (provider)
- Main image
- Experimental details
- NULL
- Conjugate
- Horseradish Peroxidase

- Submitted by
- Invitrogen Antibodies (provider)
- Main image

- Experimental details
- NULL
- Conjugate
- Horseradish Peroxidase
- Submitted by
- Invitrogen Antibodies (provider)
- Main image
- Experimental details
- NULL
- Conjugate
- Horseradish Peroxidase
- Submitted by
- Invitrogen Antibodies (provider)
- Main image
- Experimental details
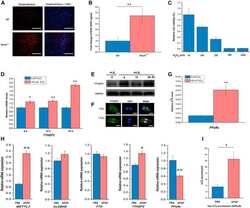
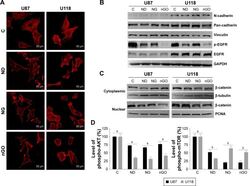
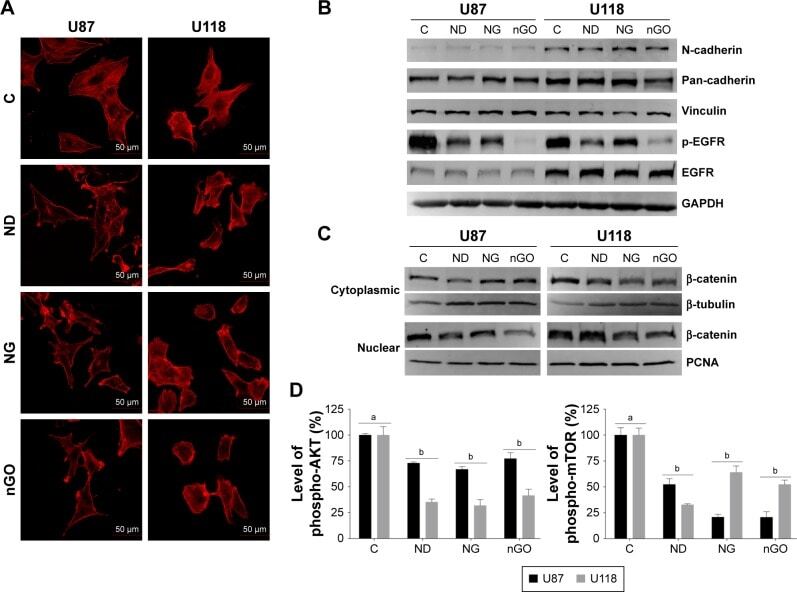
- Figure 5 EGFR/AKT/mTOR and beta-catenin signaling in glioblastoma cells after treated with nanoparticles. Notes: ( A ) Confocal microscope images of U87 and U118 cells actin cytoskeleton. Cells were grown on extracellular matrix for 24 h and treated with diamond nanoparticles, graphite nanoparticles, or graphene oxide nanoparticles at a concentration of 20 mug/mL and incubated for 24 h. F-Actin was stained with phalloidin conjugated with Atto 633. ( B ) Western blot analysis of N-cadherin, pan-cadherin, vinculin, p-EGFR, and EGFR. GAPDH was used as a loading control. ( C ) Western blot analysis of nuclear and cytoplasmic protein fractions used for determination of beta-catenin protein level. PCNA and beta-tubulin were used as loading controls for nuclear and cytoplasmic fractions, respectively. ( D ) ELISA analysis of AKT and mTOR phosphorylation in comparison to control. Treatment with nanoparticles significantly reduced phospho-AKT ( P
- Conjugate
- Horseradish Peroxidase
- Submitted by
- Invitrogen Antibodies (provider)
- Main image
- Experimental details
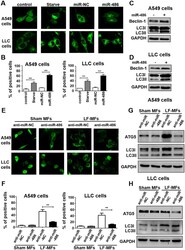
- Figure 5 miR-486 is required for LF-MFs-induced cell autophagy. ( A ) A549 and LLC cells were transfected with miR-486 mimic or negative control together with GFP-LC3 plasmid. Cells transfected with GFP-LC3 plasmid only were taken as a blank control. Cells under starvation were taken as a positive control. ( B ) Number of GFP-LC3 puncta per transfected cell representing autophagosomes was quantified. ( C , D ) A549 and LLC cells were treated as described in ( A ) and were subjected to western blot analysis with the following antibodies: Beclin-1, LC3-II and GAPDH. ( E ) Cells were co-transfected with miR-486 inhibiter or negative control together with GFP-LC3 plasmid. After 48 hours, cells were treated with sham MFs or LF-MFs. ( F ) Number of autophagosomes was quantified. ( G , H ) A549 and LLC cells were treated as described in ( E ) and were subjected to western blot analysis with the following antibodies: Atg5, LC3-II, and GAPDH. All error bars indicate mean +- SEM. Experiments were repeated three times independently. ** P < 0.01 and *** P < 0.001.
- Conjugate
- Horseradish Peroxidase

- Submitted by
- Invitrogen Antibodies (provider)
- Main image
- Experimental details
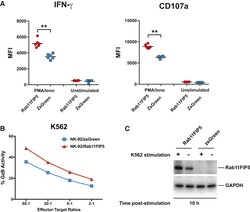
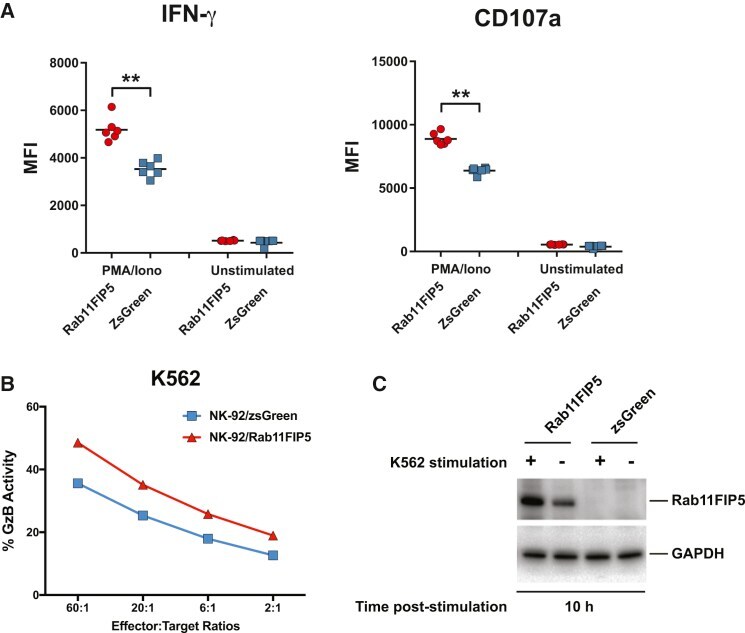
- Figure 7 Overexpression of Rab11Fip5 in NK-92 Cells Increases Cytokine and Granzyme Release (A) Effect of Rab11Fip5 overexpression on IFN-gamma production and degranulation (CD107a expression) of NK-92 cells in response to stimulation with PMA/ionomycin. NK-92/Rab11Fip5 (red symbols) and NK-92/ZsGreen cells (blue symbols) were stimulated with 500 ng/mL PMA and 5 mug/mL ionomycin for 2 hr in the presence of a CD107a antibody and the protein transport inhibitor monensin. Dots represent MFIs from 6 replicate wells. Significance determined by Wilcoxon-Mann-Whitney (ns, not significant; ** p < 0.01). (B) Granzyme B (GzB)-based cytotoxicity assays performed using NK-92/Rab11Fip5 (red) or NK-92/ZsGreen control (blue) cells as effectors and K562 cells as targets at different effector:target ratios. The percentage of cells positive for proteolytically active GzB is represented as % GzB activity. The average values from 3 independent experiments performed in triplicate are shown. (C) Western blot of Rab11Fip5 expression in NK-92 cells transduced with a RAB11FIP5 expression vector or zsGreen vector control, in the presence or absence of K562 target cell stimulation (5:1 effector:target ratio). Cells were analyzed at 10 hr post stimulation. GAPDH used as protein loading control. See also Figure S7 .
- Conjugate
- Horseradish Peroxidase
- Submitted by
- Invitrogen Antibodies (provider)
- Main image
- Experimental details
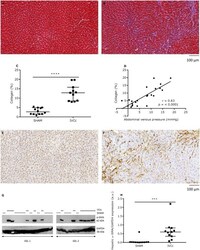
- Figure 4 Abdominal venous congestion leads to hepatic fibrosis and increases hepatic alpha-SMA expression. Representative Masson trichrome staining in hepatic transverse sections of ( A ) a sham-operated (SHAM) and ( B ) an IVC-constricted rat (IVCC), twenty-one weeks after surgery. Magnification is 20x, scale bar is 100 um. ( C ) Quantification of hepatic collagen and ( D ) total collagen expressed as a function of abdominal venous pressure of SHAM (n = 12) and IVCc rats (n = 11). Representative alpha-SMA immunohistochemical staining in hepatic transverse sections of ( E ) a SHAM rat and ( F ) an IVCc rat. Magnification is 20x, scale bar is 100 um. ( G ) Representative western blot for hepatic alpha-SMA and GAPDH of SHAM and IVCc rats. Samples were derived from the same animal experiment. However, samples were dived over two gels, due to lack of space, and blots were processed in parallel. Solid line = IVC-constricted rats, dotted line = sham-operated rats. ( H ) Quantitative analysis of hepatic alpha-SMA protein expression normalized to GAPDH of SHAM and IVCc rats. Data were analyzed using an unpaired t-test ( C ) or a Mann-Whitney test ( H ), according to the Shapiro-Wilk normality test. Relations were examined by Pearson correlations ( D ). Data are shown as median, 25 th percentile, 75 th percentile, minimum and maximum. *** denotes p < 0.001, **** denotesp < 0.0001. The observed statistical power of inter-group comparisons is 0.99 in ( C ) and 0.91 in ( H ). IVC = infer
- Conjugate
- Horseradish Peroxidase

- Submitted by
- Invitrogen Antibodies (provider)
- Main image
- Experimental details
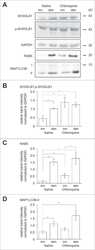
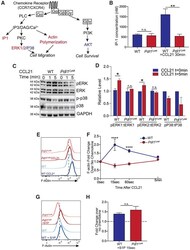
- Figure 6. Mutation of the PD-L1 Cytoplasmic Domain Impairs G Protein Activation, ERK Phosphorylation, and F-Actin Polymerization in Response to CCL21 (A) Diagram showing the signaling pathway of chemokine receptors, including CCR7 and CXCR4. Colored text indicates steps of the pathway interrogated, with red showing steps disrupted by loss of PD-L1 signaling and blue showing steps of the pathway without significant changes. (B) Quantification of IP-1 concentration in WT and Pdl1 CyMt BMDCs following 30 min of CCL21 (1 mug/mL) treatment. (C) Western blot image using antibodies against ERK1/2, pERK1/2, p38, p-p38, and GAPDH at 0, 1, or 5 min following CCL21 (1 mug/mL) addition to BMDC media. The experiment was repeated twice with similar results. (D) Quantification of (C), showing fold change over no chemokine. (E) Representative flow plots of F-actin following 15 s of CCL21 (1 mug/mL) treatment in BMDCs. (F) Quantification of (E) showing fold change over no chemokine at 15s, 60 s, and 5 min after CCL21. n = 3 technical replicates per group. The data shown are combined from three independent experiments. (G) Representative flow plots of F-actin following 15 s of S1P (500 nM) treatment in BMDCs. (H) Quantification of (G) showing fold change over no chemokine. n = 3 technical replicates per group. The data shown are combined from two independent experiments. Statistical analysis was done using a one-way ANOVA (B and F) or an unpaired Student's t test (D and H). *p < 0.05; **p < 0.
- Conjugate
- Horseradish Peroxidase

- Submitted by
- Invitrogen Antibodies (provider)
- Main image
- Experimental details
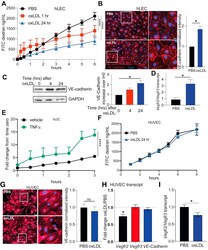
- Figure 10 OxLDL treatment changes LEC permeability and VE-cadherin expression. ( A ) A total of 6-10,000 hLECs were plated onto a transwell with 0.4-mum pores and allowed to form a basement membrane for 3 days. After 3 days, the hLECs were treated with oxLDL for 1 hour or 24 hours prior to the addition of 500-kD FITC-Dextran to the top well. Hanks' balanced salt solution in the bottom well was removed at indicated time points and the amount of FITC-dextran in the bottom well was measured. Linear regression was performed and determined that the slope of the line was significantly different with a P value of
- Conjugate
- Horseradish Peroxidase

- Submitted by
- Invitrogen Antibodies (provider)
- Main image
- Experimental details
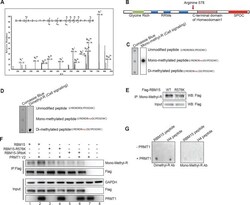
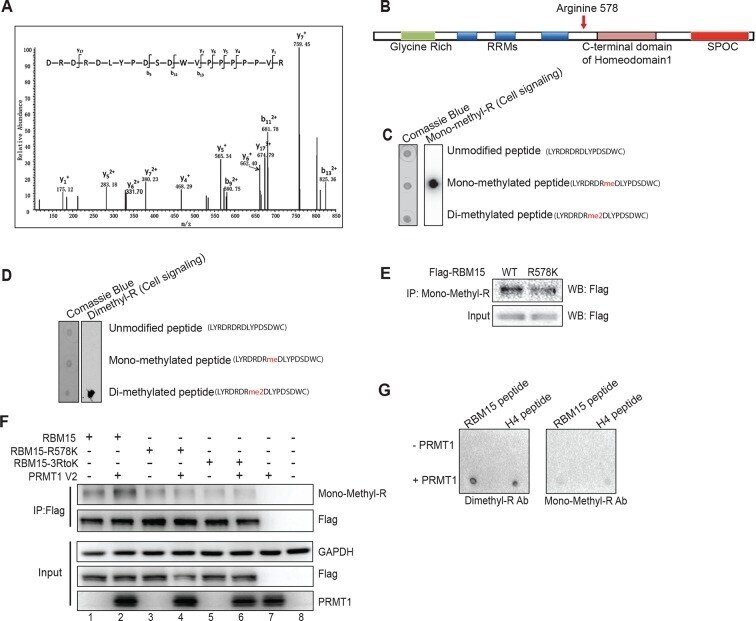
- Figure 1--figure supplement 3. Mapping the methylation site for RBM15. ( A ) Tandem mass spectrometry analysis for Flag-tagged RBM15 purified from 293T cells overexpressing RBM15-Flag. The arrow indicates the modified peptide. ( B ) Schematic diagram shows domains on RBM15. ( C ) Dot blot to test the antibody (Mono-R100 from Cell Signaling, Danvers, MA) recognizing monomethylated RBM15 peptide based on mass spectrometry analysis. Nitrocellulose membrane was spotted with peptides with no modification, with arginine mono-methylated or with arginine asymmetrically dimethylated. The peptide sequences were listed on the right side of the dot blot gel. ( D ) Dot blot to test the antibody (D4H5 from Cell Signaling) which recognizes asymmetrically dimethylated RBM15 peptide. Peptides were spotted in the same order as in panel C. ( E ) IP-WBwestern blot for RBM15 protein in Meg-01 cell lines expressing Flag-tagged RBM15 and Flag-tagged RBM15 R578K. Anti-monomethyl arginine antibody was used for immunoprecipitation and the ectopically expressed RBM15 proteins were detected by Flag antibody. ( F ) IP-western blotting assays for detecting methylated RBM15 and R3K mutant expressed in 293T cells. RBM15-R3K stands for RBM15 protein with all the arginines in the LYRDRDRD sequence mutated to lysines. ( G ) The in vitro methylation reaction with peptide (LYRDRDRDLY) incubated with purified PRMT1. H4 peptide (20 mer) was used as a positive control. The methylated peptide was detected by the D4H
- Conjugate
- Horseradish Peroxidase
- Submitted by
- Invitrogen Antibodies (provider)
- Main image

- Experimental details
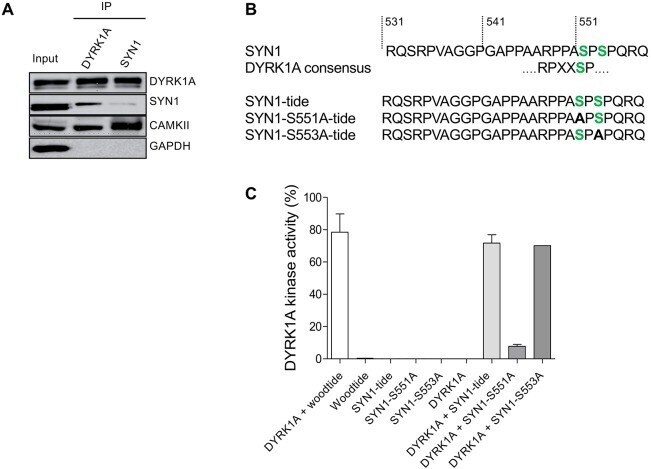
- Fig. 9. Direct interaction of DYRK1A and SYN1, phosphorylation of SYN1 by DYRK1A. (A) DYRK1A and SYN1 were immunoblotted following immunoprecipitation from wt mice brain extracts. DYRK1A or SYN1 present in the starting material (Input) were recovered in the IPs. SYN1 (74 kDa) was present in the DYRK1A IP and DYRK1A (85 kDa) was detected in the SYN1 IP, suggesting that these two proteins interact directly. Positive control of the SYN1 IP was performed using an anti-CAMKII antibody. As expected, CAMKII (50 kDa) was present in the SYN1 IP. DYRK1A IP also brought down CAMKII, suggesting complexes between SYN1, CAMKII and DYRK1A. (B) Sequence of SYN1 in the vicinity of Ser551 matches with the consensus DYRK1A phosphorylation site. Based on this sequence, three peptides were synthesized and used as potential substrates: SYN1, SYN1-S551A and SYN1-S553A. (C) Kinase activity of recombinant DYRK1A towards the three different SYN1peptides. SYN1 and SYN1-S553A peptides were phosphorylated at the same level as Woodtide by recombinant DYRK1A (71.7%+-5.2%, 70.1% and 78.4%+-11.4%, respectively). No significant catalytic activity was measured with the SYN1-S551A peptide (7.9%+-1.2%).
- Conjugate
- Horseradish Peroxidase
- Submitted by
- Invitrogen Antibodies (provider)
- Main image
- Experimental details
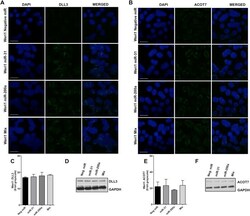
- Fig 6 DLL3 and ACOT7 expression in Weri1 cells following overexpression of miRNAs-31, -200a, or when overexpressed together (Mix). Immunofluorescence staining of DLL3 (A) and ACOT7 (B) in Weri1 cells transfected with a negative miRNA (control), miRNA-31, miRNA-200a, and miR-31/-200a (Mix). Quantification of immunofluorescence of DLL3 (C) and ACOT7 (E); bar represents mean and standard deviation from two independent experiments with quadruplicate measurements. Western blots of DLL3 (D) and ACOT7 (F) of Weri1 cells transfected with a negative miRNA (control), miRNA-31, miRNA-200a, and miR-31/-200a (Mix). Scale bar 20 mum.
- Conjugate
- Horseradish Peroxidase

- Submitted by
- Invitrogen Antibodies (provider)
- Main image
- Experimental details
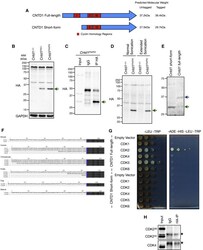
- Figure 1 CNTD1 FH Protein Is Smaller Than Predicted, Lacking an N-Terminal Cyclin Homology Required for CDK Interaction (A) Schematic of annotated full-length and short-form CNTD1, including predicted cyclin homology regions (red). (B) WB using antibodies against the HA epitope and glyceraldehyde 3-phosphate dehydrogenase (GAPDH) from testis lysate of Cntd1 +/+ , Cntd1 FH/+ , and Cntd1 FH/FH mice. The green arrow indicates the CNTD1-specific band. (C) WB using the rabbit HA antibody against immunoprecipitated testis lysate from Cntd1 FH/FH mice using rat anti-HA antibody. The green arrow indicates the specific enriched band. (D) WB using the anti-HA antibody against testis lysate from Cntd1 +/+ and Cntd1 FH/FH mice following normal and extended sonication. The green arrow indicates the specific band. (E) WB using the anti-HA antibody against yeast lysate expressing Cntd1 short-form and full-length Cntd1 from P ADH1 . (F) N-terminal splice variants of mammalian CNTD1 homologs. Blue coloring denotes the conserved methionine of the short form in each homolog, with the immediate downstream amino acid sequences that follow colored black. In the mouse, Iso1 and Iso2 are equivalent to the annotated full-length CNTD1 and CNTD1 short form, respectively. (G) Yeast two-hybrid with full-length CNTD1 and CNTD1 short form (bait) with CDKs expressed (prey), grown on control (-LEU-TRP) and selective plates (-ADE-HIS-LEU-TRP). (H) WB using antibodies against CDK2 and CDK4 from anti-HA IP of C
- Conjugate
- Horseradish Peroxidase

- Submitted by
- Invitrogen Antibodies (provider)
- Main image
- Experimental details
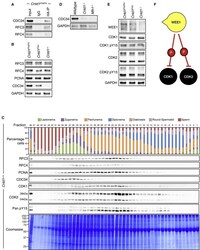
- Figure 4 CNTD1 Mutation Leads to a Decrease in CDC34 Levels Compared to Wild Type (A and B) WB using antibodies against CNTD1 FH -interacting proteins from immunoprecipitated material using anti-HA antibody from Cntd1 FH/FH mice (A) and from testis lysate (B) of Cntd1 FH/FH , Cntd1 FH/- , and Cntd1 -/- mice. (C) STA-PUT assay performed on Cntd1 FH/FH testis single-cell suspensions showing expression of CNTD1 FH interacting factors and downstream interactors relative to prophase I stage. Top panel: quantification of STA-PUT cell fraction composition based on a minimum of 200 cells from spread preparations stained with SYCP3 and gammagammaH2AFX antibodies. WBs were performed using the described antibodies against each STA-PUT fraction. (D) WB using antibodies against CDC34 and GAPDH on lysate from whole testis, Wild-type , Cntd1 -/- , and Mlh1 -/- mice. (E) WB against predicted downstream CDC34 targets and GAPDH control. (F) WEE1 inhibitory phosphorylation on CDK1 and CDK2.
- Conjugate
- Horseradish Peroxidase

- Submitted by
- Invitrogen Antibodies (provider)
- Main image
- Experimental details
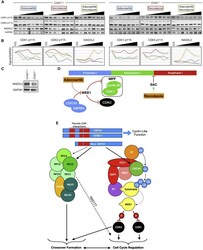
- Figure 7 In Vitro Short-Term Cultures Reveal a WEE1-Dependent Meiotic Crossover Checkpoint for Progression into Metaphase I (A) WB using antibodies against WEE1 inhibitory phosphorylation targets CDK1-pY15 and CDK2-pY15 and anaphase inhibitor MAD2L2 following the treatment of cultured spermatocytes from Cntd1 +/+ and Cntd1 -/- males with adavosertib, nocodazole, or both drugs. The triangles indicate increasing drug concentrations (see Method Details ). (B) Analysis of protein signal from WB in (A) divided by GAPDH signal, relative to the V.O. (vehicle only) control. (C) WB against MAD2L2 in whole testis lysates from Cntd1 +/+ and Cntd1 -/- males. (D) Inhibitory phosphorylation of CDK1 and CDK2 by WEE1, which itself is degraded in vivo by CDC34 or inhibited by adavosertib treatment. WEE1 degradation/inhibition allows the activation of the MPF and progression into metaphase I. The spindle assembly checkpoint (SAC) monitors the correct attachment of microtubules and prevents the progression from metaphase I to anaphase I. Nocodazole inhibits microtubule formation and promotes/maintains the SAC. (E) Model of CNTD1 function based on results presented in the present article.
- Conjugate
- Horseradish Peroxidase
