 Explore
 Validate
 Learn
Learn Western blot
Antibody data
- Antibody Data
- Antigen structure
- References [0]
- Comments [0]
- Validations
- Western blot [1]
- Immunohistochemistry [1]
- Flow cytometry [1]
- Other assay [14]
Submit
Validation data
Reference
Comment
Report error
- Product number
- MA5-14524 - Provider product page

- Provider
- Invitrogen Antibodies
- Product name
- CD3e Monoclonal Antibody (SP7)
- Antibody type
- Monoclonal
- Antigen
- Synthetic peptide
- Description
- MA5-14524 targets CD3E in IHC (P), FACS, and Western blot applications and shows reactivity with human and mouse samples. The MA5-14524 immunogen is a synthetic 13-mer peptide corresponding to aa 156-168 of the epsilon-chain of human CD3 protein.
- Reactivity
- Human, Mouse
- Host
- Rabbit
- Isotype
- IgG
- Antibody clone number
- SP7
- Vial size
- 500 µL
- Concentration
- Conc. Not Determined
- Storage
- 4° C
No comments: Submit comment
Supportive validation
- Submitted by
- Invitrogen Antibodies (provider)
- Main image

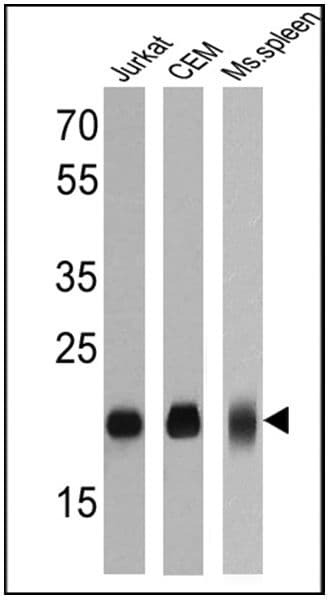
- Experimental details
- Western blot analysis of CD3E was performed by loading 25 µg of Jurkat (Lane 1), CEM (Lane 2) and mouse spleen (Lane 3) cell lysates onto an SDS polyacrylamide gel. Proteins were transferred to a PVDF membrane and blocked at 4ºC overnight. The membrane was probed with a CD3E monoclonal antibody (Product # MA5-14524) at a dilution of 1:50 overnight at 4°C, washed in TBST, and probed with an HRP-conjugated secondary antibody for 1 hr at room temperature in the dark. Chemiluminescent detection was performed using Pierce ECL Plus Western Blotting Substrate (Product # 32132). Results show a band at approx. 20 kDa.
Supportive validation
- Submitted by
- Invitrogen Antibodies (provider)
- Main image
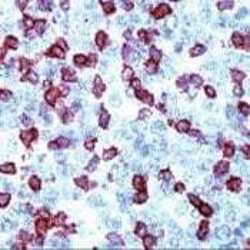
- Experimental details
- Formalin-fixed, paraffin-embedded human tonsil stained with CD3E (Product # MA5-14524) using peroxidase-conjugate and AEC. Note cell membrane staining of T cells.

Supportive validation
- Submitted by
- Invitrogen Antibodies (provider)
- Main image

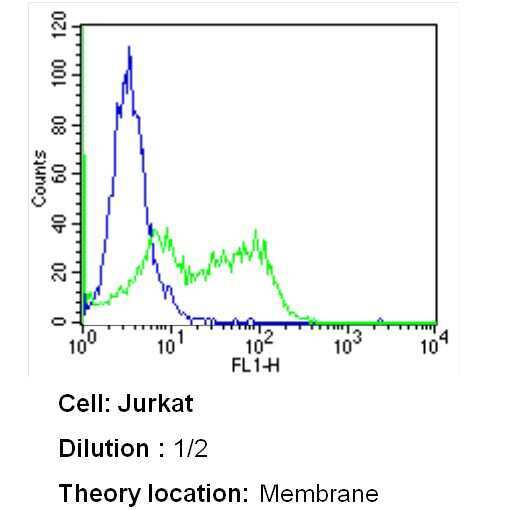
- Experimental details
- Flow cytometry analysis of CD3E in Jurkat cells (green) compared to an isotype control (blue). Cells were harvested, adjusted to a concentration of 1-5x10^6 cells/mL, fixed with 2% paraformaldehyde and washed with PBS. Cells were blocked with a 2% solution of BSA-PBS for 30 min at room temperature and incubated with a CD3E monoclonal antibody (Product # MA5-14524) at a dilution of 1:2 for 60 min at room temperature. Cells were then incubated for 40 min at room temperature in the dark using a Dylight 488-conjugated secondary antibody and re-suspended in PBS for FACS analysis.
Supportive validation
- Submitted by
- Invitrogen Antibodies (provider)
- Main image

- Experimental details
- NULL

- Submitted by
- Invitrogen Antibodies (provider)
- Main image
- Experimental details
- NULL
- Submitted by
- Invitrogen Antibodies (provider)
- Main image
- Experimental details
- NULL
- Submitted by
- Invitrogen Antibodies (provider)
- Main image
- Experimental details
- NULL
- Submitted by
- Invitrogen Antibodies (provider)
- Main image
- Experimental details
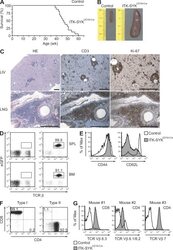
- Figure 8. ITK-SYK CD19-Cre mice develop clonal PTCLs. (A) ITK-SYK CD19-Cre mice succumb to disease. Kaplan-Meier curve of ITK-SYK CD19-Cre ( n = 18) and control (CD19-Cre) mice ( n = 10). (B) Splenomegaly in ITK-SYK CD19-Cre mice. Representative spleens from 50-wk-old control and ITK-SYK CD19-Cre mice are shown (in centimeters). (C) Solid organ infiltration with abnormally proliferating T cells in ITK-SYK CD19-Cre mice. H&E staining and immunohistochemistry with anti-CD3 and anti-Ki-67 antibodies were performed on liver (LIV) and lung (LNG) sections. Bars, 1 mm. Data representative of six diseased ITK-SYK CD19-Cre mice are shown. (D) Bone marrow (BM) or spleen (SPL) cell suspensions of 50-wk-old control and ITK-SYK CD19-Cre mice were stained against TCR-beta. The frequency of eGFP + T cells in a representative ITK-SYK CD19-Cre mouse is indicated. (E) Expanded T cells in ITK-SYK CD19-Cre mice display an activated phenotype. CD44 and CD62L surface expression on affected T cells or controls was assessed using FACS. One representative example of CD4 + T cells is shown. (F) Spleen cells from diseased ITK-SYK CD19-Cre mice ( n = 16) were stained against CD4 and CD8. Examples of preferential CD4 + T cell (Type I) or CD8 + T cell (Type II) expansions are shown. (G) T cell populations in ITK-SYK CD19-Cre mice are clonal. Single cell suspensions from spleens of individual mice were stained with antibodies against CD4, CD8, and a panel of antibodies against TCR-Vbeta chains (see Materia

- Submitted by
- Invitrogen Antibodies (provider)
- Main image
- Experimental details
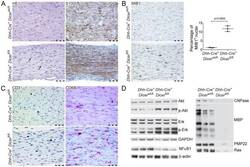
- Figure 2 Histological and biochemical analysis of mice lacking Dicer in Schwann cells. ( A-C ) Longitudinal sections of sciatic nerves from 22-day old Dicer fl/fl Dhh-Cre + and control Dicer wt/fl Dhh-Cre + littermates stained with haematoxylin and eosin (HE) or decorated with S100, MIB1, CD3, or CD68 antibody. At least four nerves were analyzed per genotype. Scale bars = 50 um. S100 positivity indicates Schwann cell development progresses at least up to the stage of immature Schwann cells ( A ). Increased proliferation in Dicer mutant nerves, as indicated by mitotic events (black arrows in A ) and increased percentage of positive nuclei in MIB1 immunohistochemistry ( B ). Quantification of MIB1-positive nuclei shows a significantly higher percentage of proliferating cells in Dicer fl/fl Dhh-Cre + compared to Dicer wt/fl Dhh-Cre + littermate nerves. Error bars indicate standard deviation, p = 0.0003, p value was determined using unpaired two-tailed student's t-test ( B ). Few CD3-positive T cells and an increased percentage of CD68-positive macrophages infiltrated the nerves of Dicer fl/fl Dhh-Cre + mice ( C ). Biochemical analysis of signal transduction pathways and myelin components by Western blot ( D ). Compared to control Dicer wt/fl Dhh-Cre + littermates, phospho-Akt and phospho-Erk were significantly increased in sciatic nerves of 18-day old mice lacking Dicer in Schwann cells, while total Akt and Erk protein levels were unchanged compared to controls, and NFkappaB was

- Submitted by
- Invitrogen Antibodies (provider)
- Main image
- Experimental details
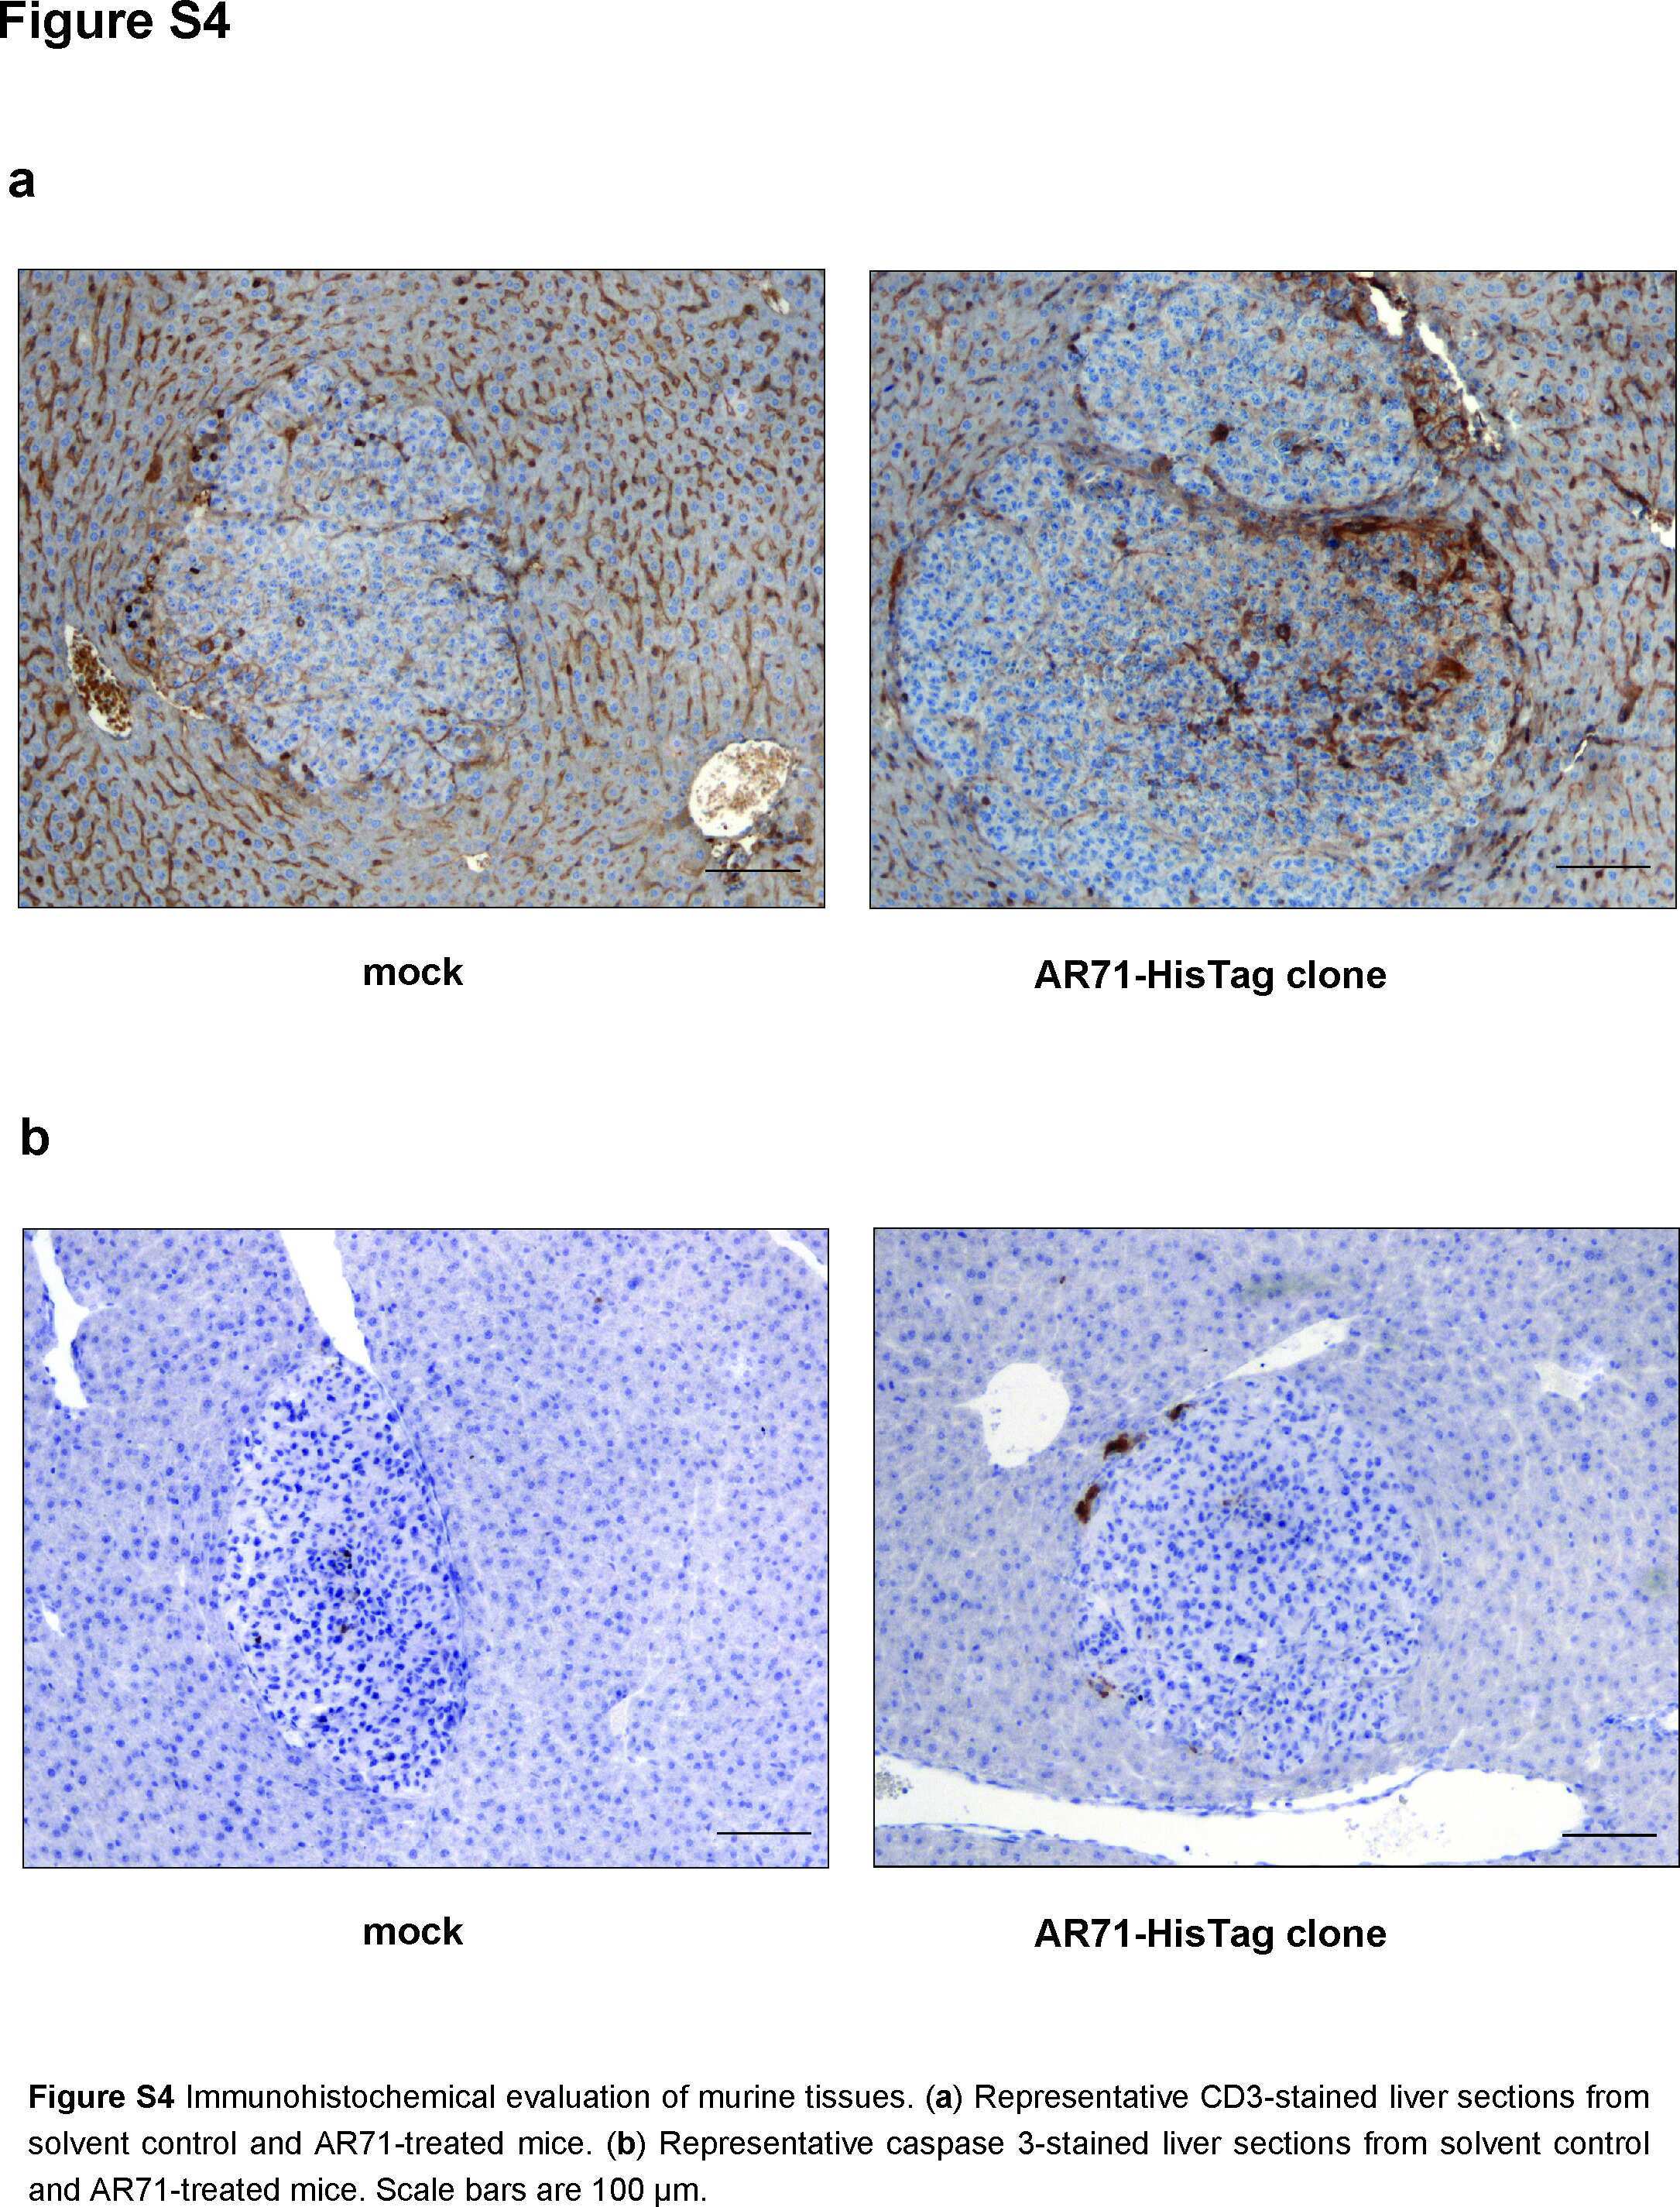
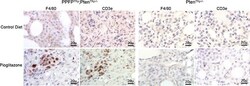
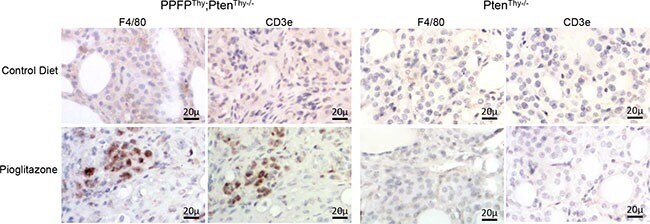
- Figure 5 Immunohistochemical staining for F4/80 and CD3e in thyroid glands from PPFPThy;PtenThy-/- and PtenThy-/- mice fed pioglitazone or control diet
- Submitted by
- Invitrogen Antibodies (provider)
- Main image

- Experimental details
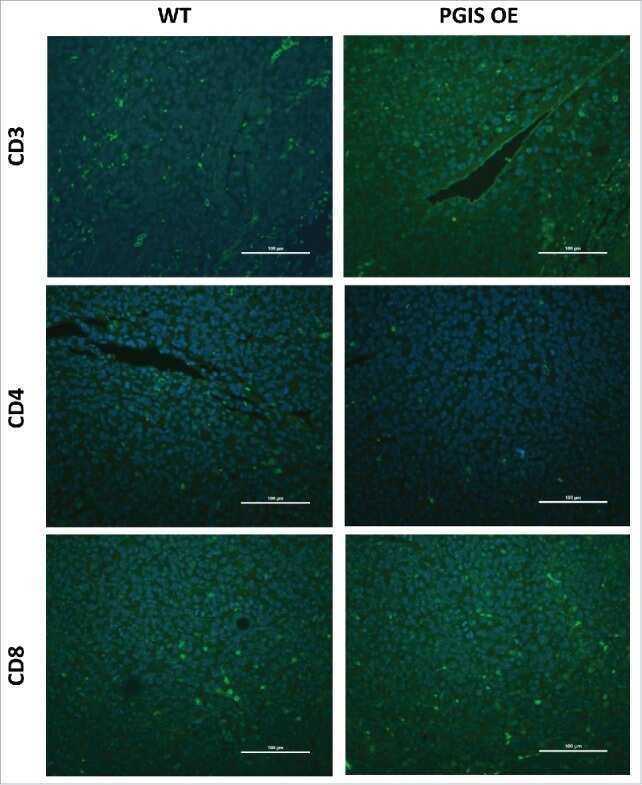
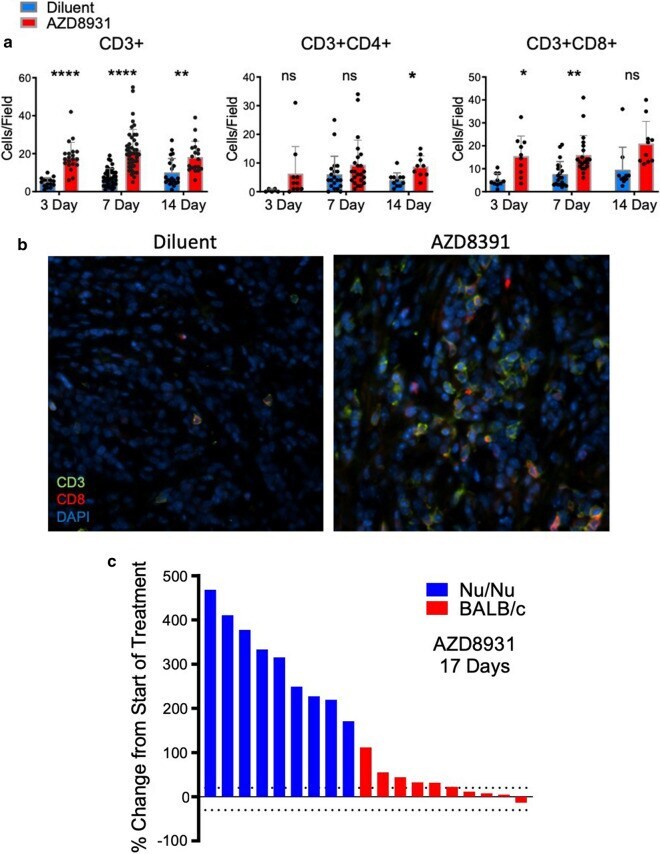
- Fig. 6 AZD8931 increases CD8 + T cell content in B4B8 tumors and therapeutic activity is diminished in immune-deficient mice. a B4B8 tumors treated with diluent or AZD8931 (50 mg/kg) for 3 (control, n = 1-2; treated, n = 2), 7 (control, n = 4; treated, n = 4), or 14 (control, n = 2; treated, n = 2) days were formalin fixed, paraffin embedded and submitted to immunofluorescence staining for the T cell marker CD3e with CD4 or CD8alpha. Five ROIs per tumor were randomly selected (accounting for > 70% of the section area). Two independent observers quantified each field of view for the number of positively stained cells per field and the average of the two independent observations and SD are reported. b Representative immunofluorescence images of CD3e + (green), CD8alpha + (red) and DAPI stained B4B8 tumors treated with diluent or AZD8931 (50 mg/kg). c B4B8 tumors were implanted in nu/nu mice or syngeneic BALB/c mice and treated with AZD8931 (50 mg/kg). The percent change in tumor volume of individual tumors after 17 days of treatment with AZD8931 in BALB/c and nu/nu mice is presented as a waterfall plot
- Submitted by
- Invitrogen Antibodies (provider)
- Main image
- Experimental details
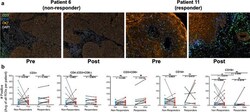
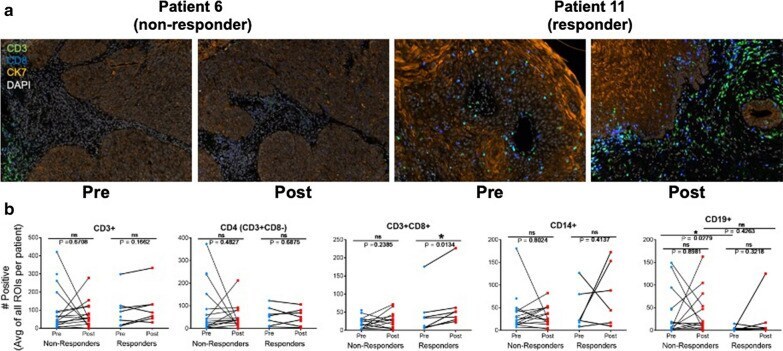
- Fig. 7 Immune cell alterations associated with cetuximab treatment in HNSCC patients. a 22 matched pairs (15 pairs were from non-responders and 7 pairs were from responders) of pre-treatment biopsies and on-treatment (cetuximab) specimens were obtained as FFPE sections on glass slides. Representative images of Vectra 3.0 staining of patient tumors before and following 3-4 weeks of cetuximab treatment. b InForm analysis of immune cell content in primary HNSCC pre- and post-cetuximab treatment. Each data point is the mean of 5-15 distinct regions of interest within each tumor section and the resulting data were submitted to a paired T test
- Submitted by
- Invitrogen Antibodies (provider)
- Main image
- Experimental details
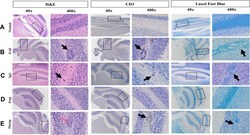
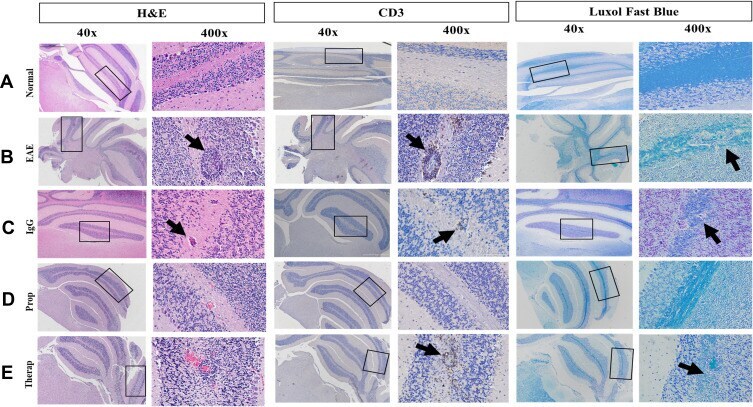
- Figure 3 Immunohistochemical examination of the mice brains ( A ) Brains of normal mice. ( B ) Brains of EAE mice. ( C ) Brains of IgG-treated mice. ( D ) Brains of EAE mice prophylactically treated with Herceptin. ( E ) Brains of EAE mice therapeutically treated with Herceptin. Both 40X and 400 X magnifications are shown. Rectangles (40 X) show the part of the brains that were enlarged (400 X). H&E staining shows the inflammation determined by arrows. Infiltration of CD3 + cells (anti-CD3 staining) is also demonstrated by black arrows. Similarly, high demyelination is detected by Luxol Fast Blue staining (black arrows).
- Submitted by
- Invitrogen Antibodies (provider)
- Main image
- Experimental details
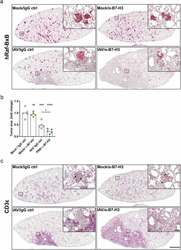
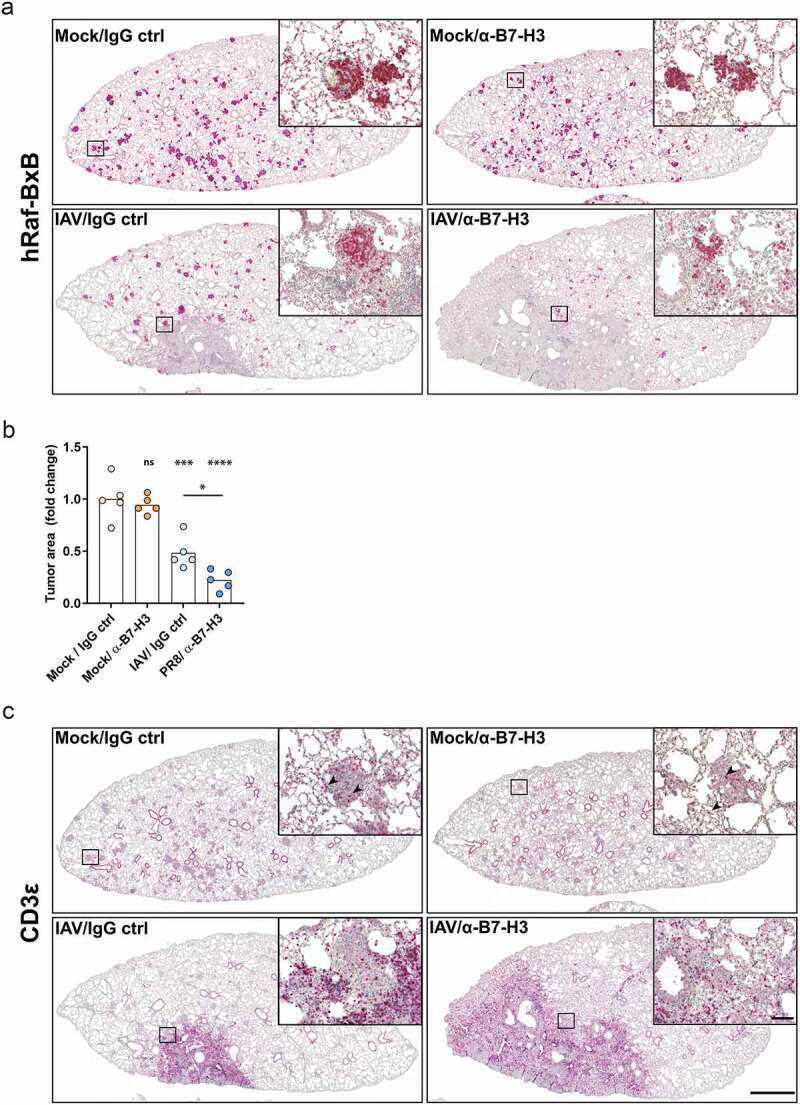
- Figure 6. Combination of oncolytic IAV infection and B7-H3 ICI application leads to tumor foci destruction and increased lung- and tumor-infiltration with T lymphocytes Raf-BxB mice were intranasally infected with IAV or solvent control (Mock) and received injections of monoclonal alpha-B7-H3 antibodies or the respective IgG ctrl as indicated in Figure 4A. Sequential paraffin lung tissue sections were stained for human Raf-BxB representing oncogene expressing tumor foci (A) or CD3epsilon + indicating T lymphocyte lung infiltration (B) and counterstained with hematoxylin. Merge pictures of one lung lobe and respective detail pictures of higher magnification of one representative mouse per group are shown. Bars represent 1000 um (merge pictures) or 100 um (close up pictures). (C) For absolute quantification of tumor tissue area, three different sections of each mouse lung stained by IHC for hRAf-BxB were quantified from 5 mice per group. The area of the hRaf-BxB-positive tumor foci was quantified and expressed in relation to the total section area of each lung lobe. Means of three quantified layers per mouse are indicate as one individual entry. n-fold tumor area normalized to the control group (Mock/IgG ctrl) are presented.
- Submitted by
- Invitrogen Antibodies (provider)
- Main image
- Experimental details
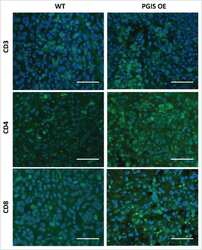
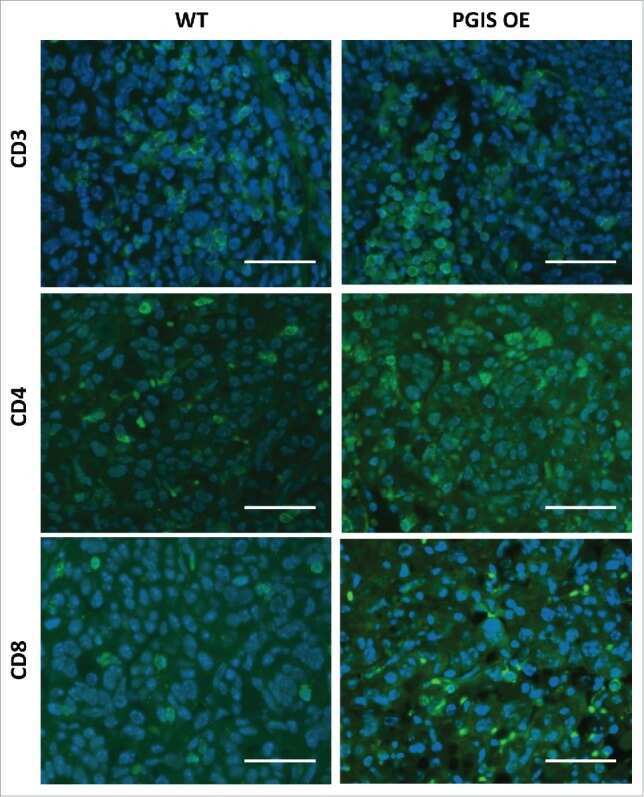
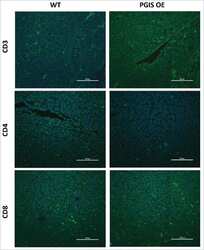
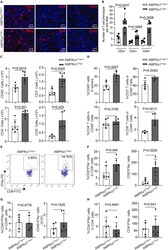
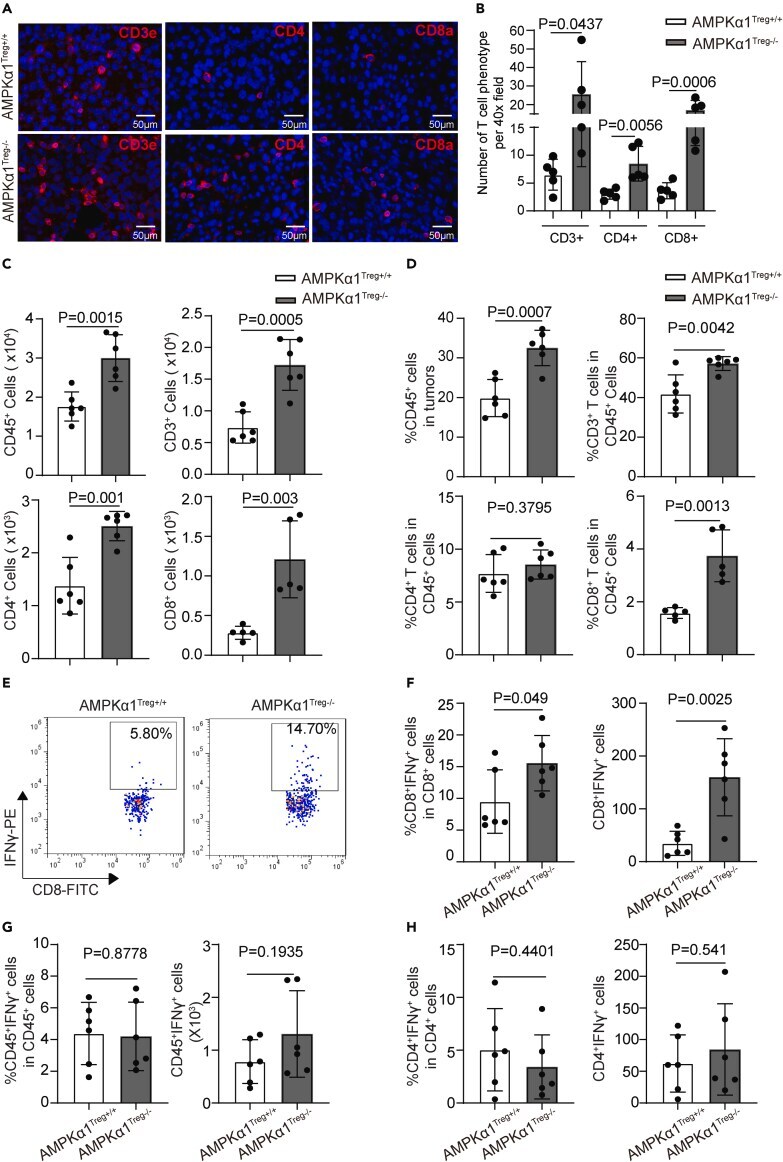
- Figure 2 Treg-specific AMPKalpha1 deficient mice show increased antitumor immunity (A) Representative immunofluorescence staining images of CD3e, CD4, and CD8a in tumor sections from AMPKalpha1 Treg+/+ and AMPKalpha1 Treg-/- mice. Scale bar: 50 mum. (B) Cell numbers of CD3 + , CD4 + , and CD8 + T cells per 40x field in tumor sections from AMPKalpha1 Treg+/+ and AMPKalpha1 Treg-/- mice (n = 5 in each group; data are presented as individual values and mean +- SD and analyzed by Student's t test). Five or more fields per tumor were quantified. (C) Numbers of CD45 + (n = 6), CD3 + (n = 6), CD4 + (n = 6), and CD8 + (n = 5) T cells per 1 x 10 6 tumor cells from day-13 tumor tissues of AMPKalpha1 Treg+/+ and AMPKalpha1 Treg-/- mice measured by flow cytometry (data are presented as individual values and mean +- SD and analyzed by Student's t test). (D) Proportions of CD45 + (n = 6), CD3 + (n = 6), CD4 + (n = 6), and CD8 + (n = 5) T cells in day-13 tumor tissues of AMPKalpha1 Treg+/+ and AMPKalpha1 Treg-/- mice analyzed by flow cytometry (data are presented as individual values and mean +- SD and analyzed by Student's t test). (E) Representative FACS images of IFN-gamma-producing CD8 + cells from day-13 tumor tissues of AMPKalpha1 Treg+/+ and AMPKalpha1 Treg-/- mice. (F) Frequency and numbers of IFN-gamma-producing CD8 + cells per 1x10 6 tumor cells from tumor tissues of AMPKalpha1 Treg+/+ and AMPKalpha1 Treg -/- mice (n = 6 in each group; data are presented as individual values and m
- Submitted by
- Invitrogen Antibodies (provider)
- Main image

- Experimental details
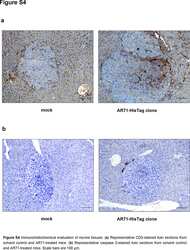
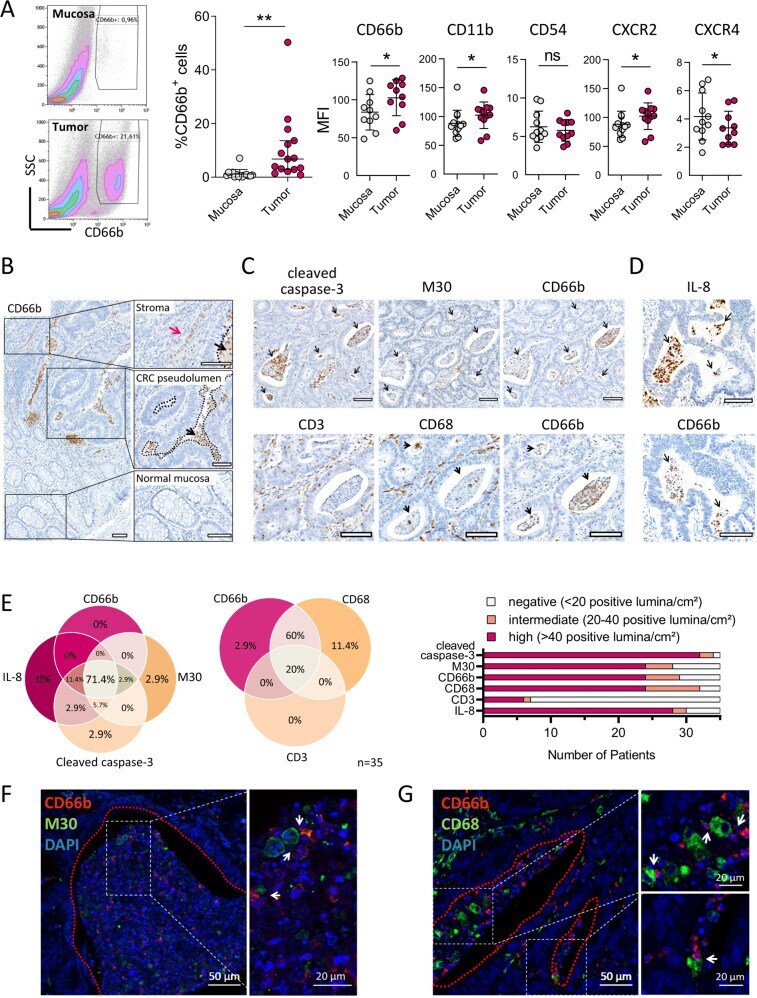
- Fig. 4 Neutrophils co-localise with apoptotic tumour cells and tumour-associated macrophages in CRC pseudolumina. A Flow cytometric analysis of dissociated CRC tissues and matched normal mucosae of treatment-naive CRC patients. For gating strategy, see Fig. S7A . Graphs present median and 95% CI (%CD66b+ cells, n = 15) or mean +- SD (surface marker MFIs, n = 10-12). * P < 0.05, ** P < 0.01, ns not significant, as calculated by Wilcoxon signed-rank test (%CD66b+ cells) or two-tailed paired t -tests (surface marker MFIs). B Representative CD66b immunohistochemistry (IHC) of a CRC tissue. Red and black arrows indicate stromal and intraluminal neutrophils, respectively, while dotted lines illustrate CRC pseudolumina. Scale bars, 100 um. C , D Consecutive IHC sections of representative CRC specimens stained for M30, cleaved caspase-3 and CD66b ( C upper panel), CD3, CD68 and CD66b ( C lower panel) and IL-8 and CD66b ( D ). Arrows indicate positive staining in CRC pseudolumina. Scale bars, 100 um. E Quantification of cleaved caspase-3-expressing, M30-expressing, IL-8-expressing, CD66b-expressing, CD68-expressing and CD3-expressing CRC pseudolumina in IHC sections of 35 CRC patients. Patients with at least 20 IHC-positive pseudolumina/cm 2 tissue area were considered positive in the presented Venn diagrams. F CD66b and M30 immunofluorescence staining of a CRC pseudolumen. Arrows indicate close contact between CD66b-positive neutrophils and M30-positive apoptotic tumour cells. Images
- Submitted by
- Invitrogen Antibodies (provider)
- Main image
- Experimental details
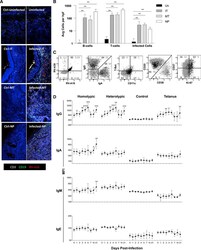
- Figure 6. Early Antibody Responses to RV in the Nose Are Cross-Reactive, Limited to IgG, and Coincide with Infiltrating Dual-Specific B Cells (A) Immunohistochemistry analysis of nasal tissue analyzed for CD19 (green), CD3 (white), RV (red), and DNA (blue). Panels on the right show tissue from an uninfected subject (top) and from an infected subject at inferior turbinate (IT), middle turbinate (MT), and nasopharyngeal (NP) sites. Left panels show corresponding negative controls (Ctrl) prepared without primary antibodies. Data are representative of five subjects infected with RV-A16. (B) Cell counts in nasal biopsies from infected subjects after RV-A16 challenge and in uninfected (Un) controls (five per group). Specimens from uninfected subjects were available for a single nasal site only. Averages for each subject were calculated from four image locations within each biopsy. (C) Scatter plots of B cells isolated from nasal tissue (inferior turbinate) from a subject infected with RV-A16 at day 4. Memory B cells (CD19+IgD-) in the nose (black) are overlaid on memory B cells (gray) from the blood of a healthy control for comparison. Representative of three infected subjects. (D) Longitudinal analysis of antibody isotypes specific for homotypic or heterotypic virus (depending on infecting strain) in nasal washes during RV infection (subjects infected with RV-A16 and RV-A39 = 13 and 12, respectively; n = 25 for all time points). Significance was determined by Mann Whitney ranked-s
