 Explore
 Validate
 Learn
Learn Western blot
Antibody data
- Antibody Data
- Antigen structure
- References [2]
- Comments [0]
- Validations
- Western blot [2]
- Immunocytochemistry [1]
- Other assay [5]
Submit
Validation data
Reference
Comment
Report error
- Product number
- PA5-19682 - Provider product page

- Provider
- Invitrogen Antibodies
- Product name
- SCD Polyclonal Antibody
- Antibody type
- Polyclonal
- Antigen
- Synthetic peptide
- Description
- This antibody is predicted to react with mouse based on sequence homology.
- Reactivity
- Human, Mouse
- Host
- Rabbit
- Isotype
- IgG
- Vial size
- 100 µg
- Concentration
- 0.9 mg/mL
- Storage
- Store at 4°C short term. For long term storage, store at -20°C, avoiding freeze/thaw cycles.
Submitted references Concurrent Mutations in STK11 and KEAP1 Promote Ferroptosis Protection and SCD1 Dependence in Lung Cancer.
Discovery of tumor-specific irreversible inhibitors of stearoyl CoA desaturase.
Wohlhieter CA, Richards AL, Uddin F, Hulton CH, Quintanal-Villalonga À, Martin A, de Stanchina E, Bhanot U, Asher M, Shah NS, Hayatt O, Buonocore DJ, Rekhtman N, Shen R, Arbour KC, Donoghue M, Poirier JT, Sen T, Rudin CM
Cell reports 2020 Dec 1;33(9):108444
Cell reports 2020 Dec 1;33(9):108444
Discovery of tumor-specific irreversible inhibitors of stearoyl CoA desaturase.
Theodoropoulos PC, Gonzales SS, Winterton SE, Rodriguez-Navas C, McKnight JS, Morlock LK, Hanson JM, Cross B, Owen AE, Duan Y, Moreno JR, Lemoff A, Mirzaei H, Posner BA, Williams NS, Ready JM, Nijhawan D
Nature chemical biology 2016 Apr;12(4):218-25
Nature chemical biology 2016 Apr;12(4):218-25
No comments: Submit comment
Supportive validation
- Submitted by
- Invitrogen Antibodies (provider)
- Main image

- Experimental details
- Western blot analysis of HepG2 Whole Cell Lysate using Product # PA5-19682, SCD primary antibody at a dilution of 2 µg/mL. Blot treated with a secondary HRP-conjugated Goat polyclonal anti-Rabbit antibody was used at a dilution of 1:3000.

- Submitted by
- Invitrogen Antibodies (provider)
- Main image

- Experimental details
- Western blot was performed using Anti-SCD Polyclonal Antibody (Product # PA5-19682) and 37, 28 kDa bands corresponding to SCD was observed across all the cell lines tested except undifferentiated 3T3-L1. Whole cell extracts (30 µg lysate) of undifferentiated 3T3-L1 preadipocytes (Lane 1), 3T3-L1 differentiated to adipocytes (Lane 2), A-431 (Lane 3) and MCF-7 (Lane 4) were electrophoresed using NuPAGE™ 4-12% Bis-Tris Protein Gel (Product # NP0322BOX). Resolved proteins were then transferred onto a nitrocellulose membrane (Product # IB23001) by iBlot® 2 Dry Blotting System (Product # IB21001). The blot was probed with the primary antibody (2 µg/ml) and detected by chemiluminescence with Goat anti-Rabbit IgG (H+L) Superclonal™ Recombinant Secondary Antibody, HRP (Product # A27036, 1:4000 dilution) using the iBright FL 1000 (Product # A32752). Chemiluminescent detection was performed using Novex® ECL Chemiluminescent Substrate Reagent Kit (Product # WP20005).

Supportive validation
- Submitted by
- Invitrogen Antibodies (provider)
- Main image

- Experimental details
- Immunofluorescence analysis of SCD was performed using 70% confluent log phase 3T3-L1 undifferentiated and 3T3-L1 differentiated to adipocytes. The cells were fixed with 4% Paraformaldehyde for 10 minutes, permeabilized with 0.1% Triton™ X-100 for 10 minutes, and blocked with 2% BSA for 1 hour at room temperature. The cells were labeled with SCD Polyclonal Antibody (Product # PA5-19682) at 5 µg/mL in 0.1% BSA, incubated at 4 degree celsius overnight and then labeled with Goat anti-Rabbit IgG (H+L) Superclonal™ Recombinant Secondary Antibody, Alexa Fluor® 488 (Product # A27034, 1:2000 dilution) for 45 minutes at room temperature (Panel a: Green). Nuclei (Panel b: Blue) were stained with SlowFade® Gold Antifade Mountant with DAPI (Product # S36938). F-actin (Panel c: Red) was stained with Rhodamine Phalloidin (Product # R415, 1:300). Panel d represents the merged image showing ER like cytoplasmic localization. Panel e represents undifferentiated 3T3L-1 cells having no expression of SCD. Panel f represents control cells with no primary antibody to assess background. The images were captured at 60X magnification.

Supportive validation
- Submitted by
- Invitrogen Antibodies (provider)
- Main image

- Experimental details
- Figure 6 The CYP-activated SCD inhibitors are not activated by sebaceous glands and display a therapeutic window to avoid sebaceous gland toxicity compared to known SCD inhibitors. a. Ex vivo inhibition of SCD by oxalamide pro-drug SW208108 and active species dMe-SW208108 in wild type mouse liver and sebaceous (preputial) gland microsomes. Each bar represents one replicate. b. Hematoxylin and eosin stained skin sections of wild type mice treated with a known bioavailable SCD inhibitor, Xenon-45, or benzothiazole SW203668 at 20 mg/kg for two weeks, once daily dosing. Arrowheads indicate sebocytes. Scale bars represent 20 mum. c. Quantitation of sebocytes in mouse skin sections of wild type mice treated with 6 or 20 mg/kg for 2 weeks (one-tailed t-test). Error bars represent standard deviation (n=3 biological replicates). d. Oxalamide probe, SW208108, (left) and benzothiazole probe, SW209049, (right) cross-linking in HEK293T cells over-expressing a panel of nine type 4 CYP enzymes. Full gel images are shown in Supplementary Figure 6h . e. Percentage of cancers expressing high levels of the CYP4 family that activate the oxalamides and benzothiazoles. SCC refers to squamous cell carcinoma and HCC refers to hepatocellular carcinoma.

- Submitted by
- Invitrogen Antibodies (provider)
- Main image

- Experimental details
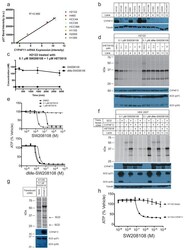
- Figure 2 Stearoyl CoA desaturase-1 (SCD) is the target of the oxalamides and benzothiazoles. a. Silver stain of purified p37 and p30 proteins. H2122 cells were treated with SW208108 with or without 3 muM (-)-SW203668, an active competitor. Full gel image is shown in Supplementary Figure 2a . b. Immunoprecipitation of SCD from 0.1 muM SW208108-treated H2122 cell lysate following conjugation of a fluorescent azide. Full gel is shown in Supplementary Figure 2b . c. Structure of known SCD inhibitor, Abbott-28c. d. Competition of SW208108 with Abbott-28c. Full gel image is shown in Supplementary Figure 2c . e. In vitro inhibition of SCD activity by oxalamide and benzothiazole scaffolds in microsomal preparation of H2122 cells. Each data point represents one replicate. Counts shown are after subtraction of counts from a control sample lacking NADPH. f. Rescue of oxalamide toxicity by 100 muM of sodium oleate. Each point represents the average of two biological replicates. Best fit curves of H460 + oleate and HCC44 + oleate are overlapping.

- Submitted by
- Invitrogen Antibodies (provider)
- Main image
- Experimental details
- Figure 5 Cytochrome P450 4F11 (CYP4F11) is responsible for oxalamide activation in sensitive cell lines and it is not expressed in insensitive cell lines. a. Correlation of CYP4F11 mRNA levels in a panel of eight cell lines to the quantitated intensity of SW208108 cross-linked SCD that is shown in Fig. 3c . b. CYP4F11 levels across the panel of 12 NSCLC lines using the same samples initially shown in figure 3c . Full gel image is shown in Supplementary Figure 5f . The levels of tubulin are also reshown to demonstrate equal loading. c. Effect of a known CYP4F11 inhibitor, HET0016, on SW208108 metabolism in a sensitive line, H2122. Errors represent standard deviation (n=3 biological replicates). d. Inhibition of SW208108 cross-linking to SCD by HET0016. Full gel image is shown in Supplementary Figure 5g . e. HET0016 rescues H2122 cells from toxicity to SW208108 (pro-drug) but not dMe-SW208108 (drug). Each point represents the average of two biological replicates. f. Reconstitution of CYP4F11-dependent SW208108 cross-linking to SCD in HEK293T cells. Full gel image is shown in Supplementary Figure 5h . g. Stable expression of CYP4F11 in an insensitive line, H1155, and resultant cross-linking of SW208108. Full gel image is shown in Supplementary Figure 5i . h. Oxalamide pro-drug, SW208108, concentration response curve of H1155-vector or CYP4F11 infected cell. Each point represents the average of two biological replicates.

- Submitted by
- Invitrogen Antibodies (provider)
- Main image

- Experimental details
- Figure 6. SCD1 Activity Is Essential for Survival of STK11/KEAP1 Co-mutant Adenocarcinoma (A) Schematic indicating the timeline for each CRISPR screen. (B) Differential sgRNA abundance between NTC and DKO clones was determined using MAGeCK in robust ranking algorithm (RRA) mode. Gene-wise log-fold changes (LFC) are plotted as the means of the statistically significant sgRNAs for each gene. A cutoff of -1.5 LFCs was chosen to identify candidate hits from the two screens. Results from H358 screen are plotted on the x axis and from H292 on the y axis. (C) Boxplots show normalized TPM (after removing cell line effect) of SCD in three isogenic clones with indicated genotype from two cell lines (H358 and H292). (D) Immunoblot of protein expression of SCD1 in H358 isogenic clones. (E) BFP measurements at day 1 after transduction (lighter color) and day 12 after transduction (darker color) in H358 isogenic clones transduced with sgTrack-BFP vector containing the indicated sgRNA. Graphs quantify change in the percentage of BFP in each clone over time.

- Submitted by
- Invitrogen Antibodies (provider)
- Main image

- Experimental details
- Figure 7. Pharmacologic Inhibition of SCD1 Is Effective in STK11/KEAP1 Co-mutants In Vivo and In Vitro Alone or in Combination with a Ferroptosis Inducer (A) Lipid peroxides, as measures by a C11-BODIPY probe, in A549 cells with Cas9-mediated knockout of SCD1 (left) and H358 cells with SCD1 overexpression (right) compared with their wild-type counterparts. A shift to the right indicated an increase in levels of lipid peroxides. (B) Immunoblot of cell lines from (A) indicating knockout or overexpression of SCD1. (C) Measurement of the percentage of viable cells comparing isogenic clones from H358 cell line treated with SCD1 inhibitor CVT-11127 at 1 muM for 4 days. Significance was calculated by a two-sample t test between samples at each end of the bracket. A Bonferroni correction was performed across the six drug treatment tests so that *p < 0.008, **p < 0.002, ***p < 0.0002. Data are represented as means +- SEM. (D) Measurement of the percentage of viable cells comparing isogenic clones from H358 cell line treated with SCD1 inhibitor at 1 muM alone, erastin alone at 2 muM, or a combination of SCD1 inhibitor and erastin for 4 days. Significance was calculated by a two-sample t test in which specific hypotheses were tested for samples in the DKO group where *p < 0.05, **p < 0.01, ***p < 0.001. Data are represented as means +- SEM. (E) Tumor volume of H358-DKO tumors treated with vehicle (purple) or 50 mg/kg SCD1 inhibitor A939572 (dotted green). Significance was calculated usi
