 Explore
 Validate
 Learn
Learn Western blot
Antibody data
- Antibody Data
- Antigen structure
- References [1]
- Comments [0]
- Validations
- Western blot [2]
- Immunocytochemistry [1]
- Flow cytometry [1]
- Other assay [2]
Submit
Validation data
Reference
Comment
Report error
- Product number
- 44-500G - Provider product page

- Provider
- Invitrogen Antibodies
- Product name
- Phospho-c-Kit (Tyr936) Polyclonal Antibody
- Antibody type
- Polyclonal
- Antigen
- Synthetic peptide
- Reactivity
- Human
- Host
- Rabbit
- Isotype
- IgG
- Vial size
- 100 µL
- Storage
- -20°C
Submitted references CADM1 controls actin cytoskeleton assembly and regulates extracellular matrix adhesion in human mast cells.
Moiseeva EP, Straatman KR, Leyland ML, Bradding P
PloS one 2014;9(1):e85980
PloS one 2014;9(1):e85980
No comments: Submit comment
Supportive validation
- Submitted by
- Invitrogen Antibodies (provider)
- Main image
- Experimental details
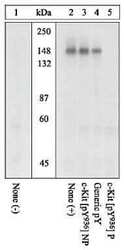
- Peptide Competition: Extracts prepared from M07e cells left untreated (1) or treated (2-5) with SCF were resolved by SDS-PAGE on a 10% polyacrylamide gel and transferred to PVDF. Membranes were blocked with a 5% BSA-TBST buffer overnight at 4°C, then

- Submitted by
- Invitrogen Antibodies (provider)
- Main image

- Experimental details
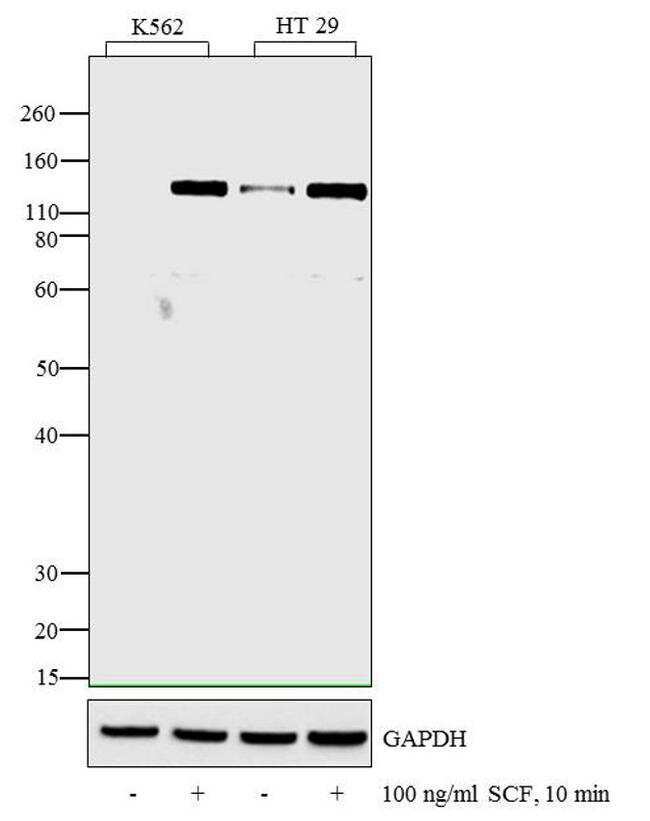
- Western blot analysis was performed on whole cell extracts (30 µg lysate) of K562 (Lane1), K562 treated for 10 minutes with 100 ng/mL of SCF (Lane 2), HT 29 (Lane 3) and HT 29 treated for 10 minutes with 100 ng/mL of SCF (lane 4). The blots were probed with Anti-c-Kit (pY936) Rabbit Polyclonal Antibody (Product # 44-500G, 1:250 dilution) and detected by chemiluminescence using Goat anti-Rabbit IgG (H+L) Superclonal™ Secondary Antibody, HRP conjugate (Product # A27036, 0.4 µg/mL, 1:2500 dilution). A 150 kDa band corresponding to c-Kit (pY936) was observed across cell lines tested. Known quantity of protein samples were electrophoresed using Novex® NuPAGE® 10 % Bis-Tris gel (Product # NP0302BOX), XCell SureLock™ Electrophoresis System (Product # EI0002), and Novex® Sharp Pre-Stained Protein Standard (Product # LC5800). Resolved proteins were then transferred onto a nitrocellulose membrane by wet transfer (Product # IB21001). The membrane was probed with the relevant primary and secondary Antibody following blocking with 5 % skimmed milk. Chemiluminescent detection was performed using Pierce™ ECL Western Blotting Substrate (Product # 32106).
Supportive validation
- Submitted by
- Invitrogen Antibodies (provider)
- Main image

- Experimental details
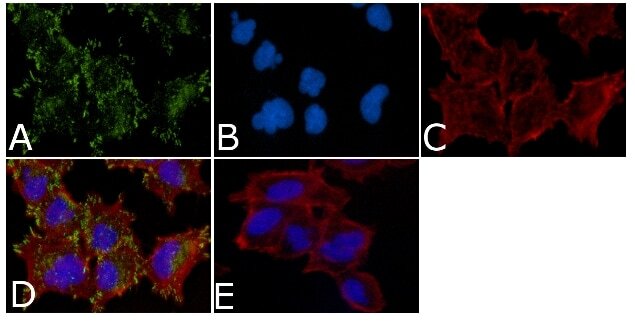
- Immunofluorescent analysis of Phospho-c-Kit/CD117 pTyr936 Antibody was done on 70% confluent log phase A549 cells. The cells were fixed with 4% paraformaldehyde for 15 minutes, permeabilized with 0.25% Triton™ X-100 for 10 minutes, and blocked with 5% BSA for 1 hour at room temperature. The cells were labeled with Phospho-c-Kit/CD117 pTyr936 Antibody (Product # 44-500G) at 1:250 dilution in 1% BSA and incubated for 3 hours at room temperature and then labeled with Alexa Fluor 488 Goat Anti-Rabbit IgG Secondary Antibody (Product # A-11008) at a dilution of 1:400 for 45 minutes at room temperature (Panel a: green). Nuclei (Panel b: blue) were stained with SlowFade® Gold Antifade Mountant with DAPI (Product # S36938). F-actin (Panel c: red) was stained with Alexa Fluor 594 Phalloidin (Product # A12381). Panel d is a merged image showing cytoplasmic and nuclear localization. Panel e is a no primary antibody control. The images were captured at 40X magnification.
Supportive validation
- Submitted by
- Invitrogen Antibodies (provider)
- Main image
- Experimental details
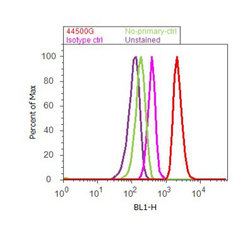
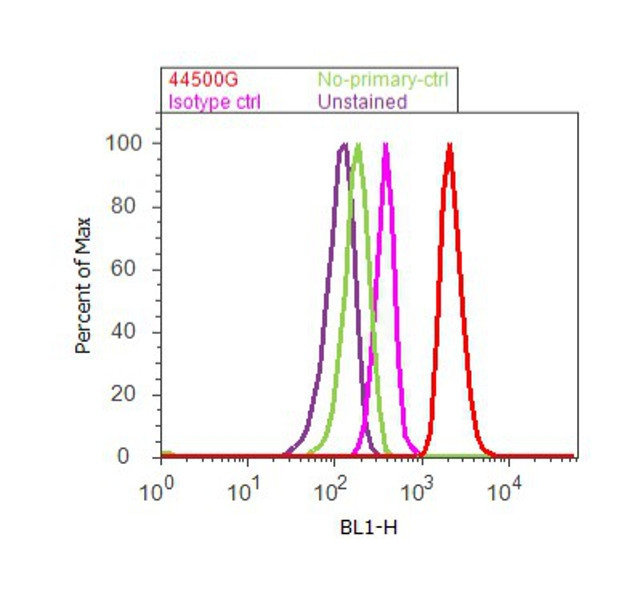
- Flow cytometry analysis of CD117 (c-Kit) [pY936] was done on A549 cells treated with EGF (200ng/mL, 10 minutes). Cells were fixed with 70% ethanol for 10 minutes, permeabilized with 0.25% Triton™ X-100 for 20 minutes, and blocked with 5% BSA for 30 minutes at room temperature. Cells were labeled with CD117 (c-Kit) [pY936] Rabbit Polyclonal Antibody (44500G, red histogram) or with rabbit isotype control (pink histogram) at 3-5 ug/million cells in 2.5% BSA. After incubation at room temperature for 2 hours, the cells were labeled with Alexa Fluor® 488 Goat Anti-Rabbit Secondary Antibody (A11008) at a dilution of 1:400 for 30 minutes at room temperature. The representative 10,000 cells were acquired and analyzed for each sample using an Attune® Acoustic Focusing Cytometer. The purple histogram represents unstained control cells and the green histogram represents no-primary-antibody control.
Supportive validation
- Submitted by
- Invitrogen Antibodies (provider)
- Main image

- Experimental details
- NULL
- Submitted by
- Invitrogen Antibodies (provider)
- Main image
- Experimental details
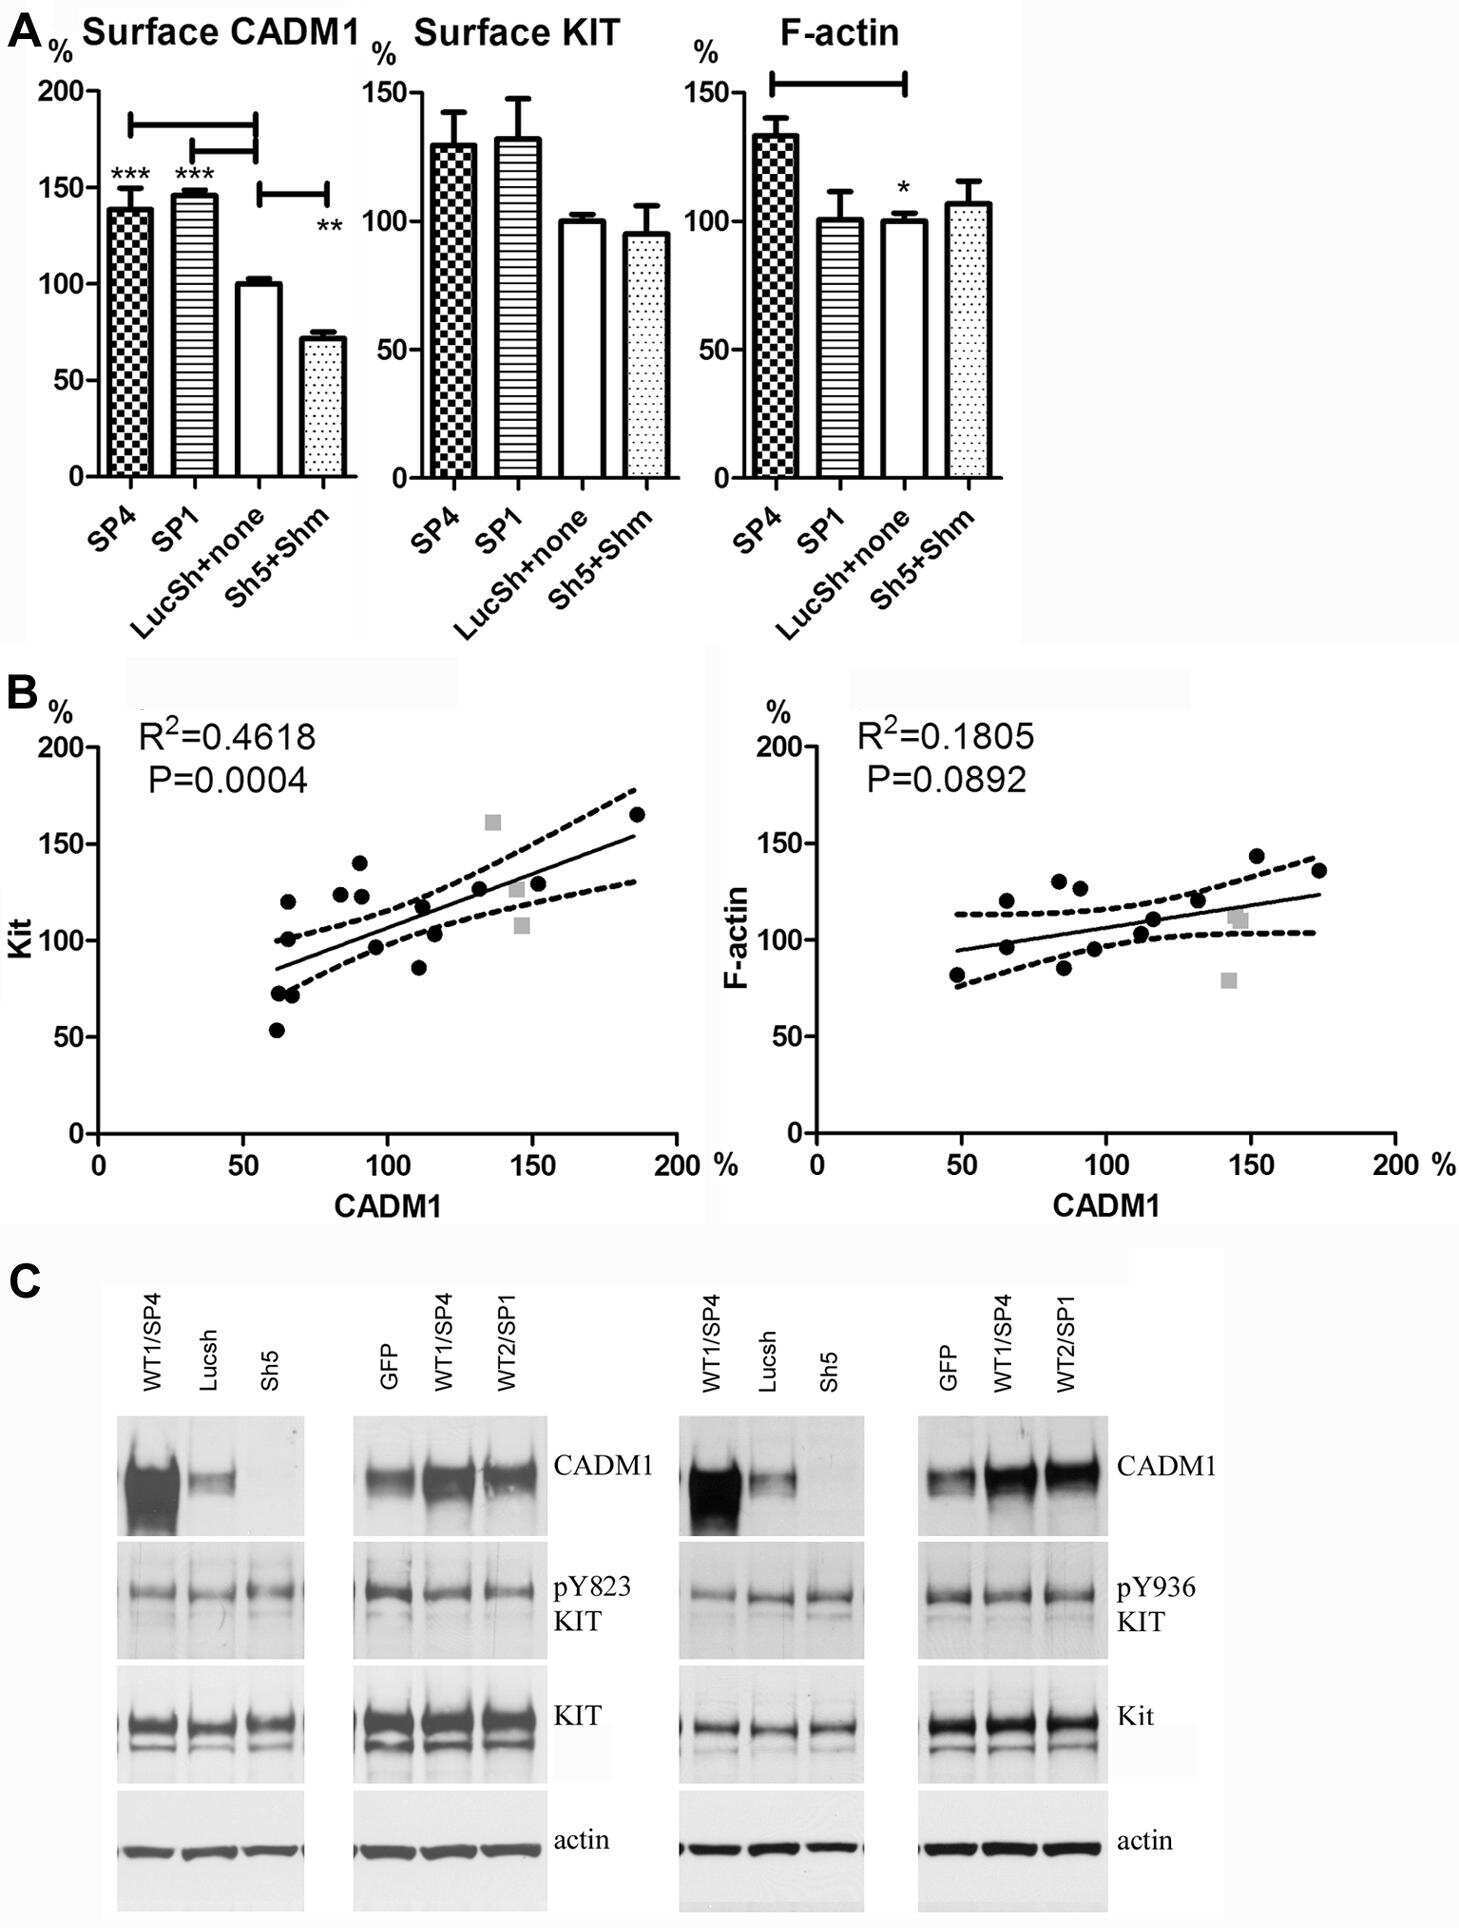
- Figure 2 Modulated CADM1 levels in HMC-1 cells influenced surface Kit expression, an assembly of filamentous actin and tyrosine phosphorylation. A. HMC-1 cells were transduced with SP4, SP1, control shRNA LucSh, CADM1 shRNA (Sh5 or Shm) viral particles. Then examined for expression of surface CADM1 (total n = 30 groups from 7 transductions), surface Kit (n = 27 from 7 transductions) and amounts of F-actin (n = 23 from 4 transductions) by FACS. The control group combines LucSh-transduced and non-transduced cells, CADM1 downregulated group combines Sh5- and Shm-transduced cells. All data were expressed as a percentage of the levels in the SP-overexpressing cell group. B and C. Scatter plots for the data presented in A with correlation or regression model parameters are shown for Kit ( B ) and F-actin ( C ) as a function of CADM1. Data for SP4- and SP1-expressing cells are shown in different colours. D. Western blotting of protein extracts from LucSh-, SP4- and Shm-transduced HMC-1 cells, with 3 independent transductions for each group, developed with Abs shown on the right of the blots. E. Protein bands, shown in D and Fig. S 2C , were quantified. Bands in SP4 (n = 5) and Shm (n = 4) groups were expressed as percentages of control LucSh/GFP group (n = 5) for each protein, except phosphotyrosine 58-63 kDa bands (n = 3). * P
