 Explore
 Validate
 Learn
Learn32-8200
antibody from Invitrogen Antibodies
Targeting: SNCA
NACP, PARK1, PARK4, PD1
 Western blot
 ELISA Immunocytochemistry Immunoprecipitation Immunohistochemistry Flow cytometry Other assay
Antibody data
- Antibody Data
- Antigen structure
- References [2]
- Comments [0]
- Validations
- Western blot [2]
- Immunocytochemistry [1]
- Flow cytometry [1]
- Other assay [1]
Submit
Validation data
Reference
Comment
Report error
- Product number
- 32-8200 - Provider product page

- Provider
- Invitrogen Antibodies
- Product name
- Synuclein alpha/beta Monoclonal Antibody (Syn 202)
- Antibody type
- Monoclonal
- Antigen
- Recombinant full-length protein
- Reactivity
- Human, Mouse, Rat
- Host
- Mouse
- Isotype
- IgG
- Antibody clone number
- Syn 202
- Vial size
- 100 µg
- Concentration
- 0.5 mg/mL
- Storage
- -20°C
Submitted references Unexpected Implication of SRP and AGO2 in Parkinson's Disease: Involvement in Alpha-Synuclein Biogenesis.
Synaptic vesicle depletion correlates with attenuated synaptic responses to prolonged repetitive stimulation in mice lacking alpha-synuclein.
Hernandez SM, Tikhonova EB, Baca KR, Zhao F, Zhu X, Karamyshev AL
Cells 2021 Oct 18;10(10)
Cells 2021 Oct 18;10(10)
Synaptic vesicle depletion correlates with attenuated synaptic responses to prolonged repetitive stimulation in mice lacking alpha-synuclein.
Cabin DE, Shimazu K, Murphy D, Cole NB, Gottschalk W, McIlwain KL, Orrison B, Chen A, Ellis CE, Paylor R, Lu B, Nussbaum RL
The Journal of neuroscience : the official journal of the Society for Neuroscience 2002 Oct 15;22(20):8797-807
The Journal of neuroscience : the official journal of the Society for Neuroscience 2002 Oct 15;22(20):8797-807
No comments: Submit comment
Supportive validation
- Submitted by
- Invitrogen Antibodies (provider)
- Main image
- Experimental details
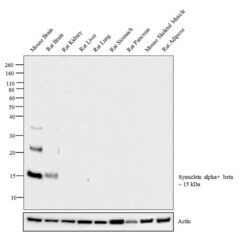
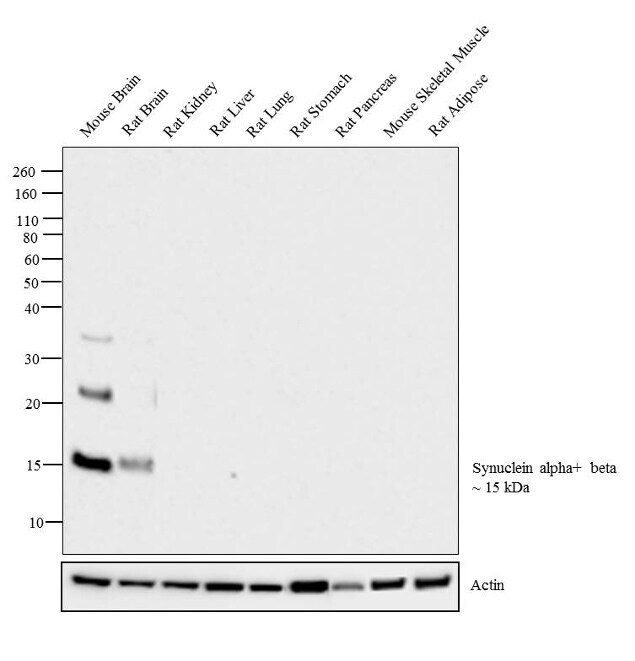
- Western blot analysis was performed on tissue extracts (30 µg lysate) of Mouse Brain (Lane 1), Rat Brain (Lane 2), Rat Kidney (Lane 3), Rat Liver (Lane 4), Rat Lung (Lane 5), Rat Stomach (Lane 6), Rat Pancreas (Lane 7), Mouse Skeletal Muscle (Lane 8) and Rat Adipose (Lane 9). The blot was probed with Anti- Synuclein alpha+ beta Mouse Monoclonal Antibody (Product # 32-8200, 2 µg/mL) and detected by chemiluminescence using Goat anti-Mouse IgG (H+L) Superclonal™ Secondary Antibody, HRP conjugate (Product # A28177, 0.25 µg/mL, 1:4000 dilution). A 15 kDa band corresponding to Synuclein alpha+ beta was observed in Mouse Brain and Rat Brain and not observed in other cell lines which are documented to be Synuclein alpha+ beta negative.
- Submitted by
- Invitrogen Antibodies (provider)
- Main image
- Experimental details
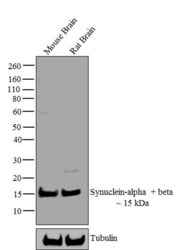
- Western blot analysis of Synuclein-alpha + beta was performed by loading 20 µg of Mouse Brain (lane1) and Rat Brain (lane2) tissue lysate using Novex®NuPAGE®4-12% Bis-Tris gel (Product # NP0321BOX), XCell SureLock Electrophoresis System (Product # EI0002), Novex® Sharp Pre-Stained Protein Standard (LC5800), and iBlot® Dry Blotting System (IB21001). Proteins were transferred to a nitrocellulose membrane and blocked with 5% skim milk for 1 hour at room temperature. Synuclein-alpha + beta was detected at ~15 kDa using Synuclein-alpha + beta Mouse Monoclonal Antibody (Product # 32-8200) at 1-3 µg/mL in 2.5% skim milk at 4°C overnight on a rocking platform. Goat Anti-Mouse IgG - HRP Secondary Antibody (Product # 62-6520) at 1:4000 dilution was used and chemiluminescent detection was performed using Pierce™ ECL Western Blotting Substrate (Product # 32106).

Supportive validation
- Submitted by
- Invitrogen Antibodies (provider)
- Main image
- Experimental details
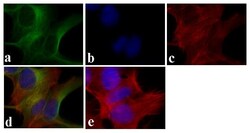
- Immunofluorescent analysis of Synuclein-alpha + beta was done on 70% confluent log phase SHSY5Y cells. The cells were fixed with 4% paraformaldehyde for 15 minutes, permeabilized with 0.25% Triton™ X-100 for 10 minutes, and blocked with 5% BSA for 1 hour at room temperature. The cells were labeled with Synuclein-alpha + beta Mouse Monoclonal Antibody (Product # 32-8200) at 1.5 µg/mL in 1% BSA and incubated for 3 hours at room temperature and then labeled with Alexa Fluor 488 Rabbit Anti-Mouse IgG Secondary Antibody (Product # A-11059) at a dilution of 1:400 for 30 minutes at room temperature (Panel a: green). Nuclei (Panel b: blue) were stained with SlowFade® Gold Antifade Mountant with DAPI (Product # S36938). F-actin (Panel c: red) was stained with Alexa Fluor 594 Phalloidin (Product # A12381). Panel d is a merged image showing cytoplasmic localization. Panel e shows no primary antibody control. The images were captured at 20X magnification.

Supportive validation
- Submitted by
- Invitrogen Antibodies (provider)
- Main image
- Experimental details
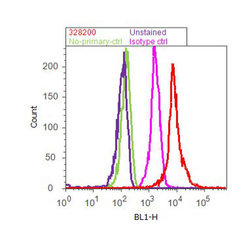
- Flow cytometry analysis of Synuclein-alpha + beta was done on SH-SY5Y cells. Cells were fixed with 70% ethanol for 10 minutes, permeabilized with 0.25% Tritonª X-100 for 20 minutes, and blocked with 5% BSA for 30 minutes at room temperature. Cells were labeled with Synuclein-alpha + beta Mouse Monoclonal Antibody (328200, red histogram) or with mouse isotype control (pink histogram) at 3-5 µg/million cells in 2.5% BSA. After incubation at room temperature for 2 hours, the cells were labeled with Alexa Fluor¨ 488 Rabbit Anti-Mouse Secondary Antibody (A11059) at a dilution of 1:400 for 30 minutes at room temperature. The representative 10,000 cells were acquired and analyzed for each sample using an Attune¨ Acoustic Focusing Cytometer. The purple histogram represents unstained control cells and the green histogram represents no-primary-antibody control.

Supportive validation
- Submitted by
- Invitrogen Antibodies (provider)
- Main image

- Experimental details
- Figure 3 Depletion of AGO2 Leads to an Increase in alphaSyn Expression. ( A ) AGO2 expression is significantly decreased in the HeLa Tet-On cells treated with siAGO2. AGO2 mRNA levels were measured by RT-qPCR 48 h after siAGO2 transfection, normalized to HPRT mRNA levels and presented relative to AGO2 mRNA levels in control cells. ( B ) Quantification of alphaSyn mRNA expression levels at 48 h after AGO2 siRNA transfection. mRNA levels measured by RT-qPCR. alphaSyn mRNA levels were first normalized to HPRT mRNA levels and then to alphaSyn mRNA levels in control cells. Graph shows mean values +- SE with a total of n = 3 independent experiments. ( C ) Western blot of total cell lysate using alphaSyn, AGO2, and beta-Actin antibodies (left panel). Quantification of alphaSyn Western blots using ImageJ (right panel). Normalized to beta-Actin protein levels and then to alphaSyn protein levels in control cells. Graph shows mean values +- SE with a total of n = 3 independent experiments. Significance determined by paired t test for protein and mRNA, ** p < 0.01.
