 Explore
 Validate
 Learn
Learn Western blot
Antibody data
- Antibody Data
- Antigen structure
- References [1]
- Comments [0]
- Validations
- Western blot [2]
- Immunohistochemistry [6]
- Other assay [2]
Submit
Validation data
Reference
Comment
Report error
- Product number
- MA5-31335 - Provider product page

- Provider
- Invitrogen Antibodies
- Product name
- HMGCR Monoclonal Antibody (CL0259)
- Antibody type
- Monoclonal
- Antigen
- Recombinant full-length protein
- Description
- Immunogen sequence: HIPAYKLETL METHERGVSI RRQLLSKKLS EPSSLQYLPY RDYNYSLVMG ACCENVIGYM PIPVGVAGPL CLDEKEFQVP MATTEGCLVA
- Reactivity
- Human
- Host
- Mouse
- Isotype
- IgG
- Antibody clone number
- CL0259
- Vial size
- 100 µL
- Concentration
- 0.6 mg/mL
- Storage
- Store at 4°C short term. For long term storage, store at -20°C, avoiding freeze/thaw cycles.
Submitted references Mitochondrial respiratory chain dysfunction alters ER sterol sensing and mevalonate pathway activity.
Wall CTJ, Lefebvre G, Metairon S, Descombes P, Wiederkehr A, Santo-Domingo J
The Journal of biological chemistry 2022 Mar;298(3):101652
The Journal of biological chemistry 2022 Mar;298(3):101652
No comments: Submit comment
Supportive validation
- Submitted by
- Invitrogen Antibodies (provider)
- Main image
- Experimental details
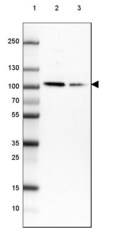
- Western blot analysis of HMGCR by a HMGCR monoclonal antibody (Product # MA5-31335). Lane 1: Marker [kDa] 250, 130, 100, 70, 55, 35, 25, 15, 10 Lane 2: Human cell line MCF-7 Lane 3: Human cell line HepG2.

- Submitted by
- Invitrogen Antibodies (provider)
- Main image

- Experimental details
- Western blot analysis of HMGCR by a HMGCR monoclonal antibody (Product # MA5-31335). Analysis in MCF-7 cells transfected with control siRNA, target specific siRNA probe #1 and #2, using Anti-HMGCR.

Supportive validation
- Submitted by
- Invitrogen Antibodies (provider)
- Main image

- Experimental details
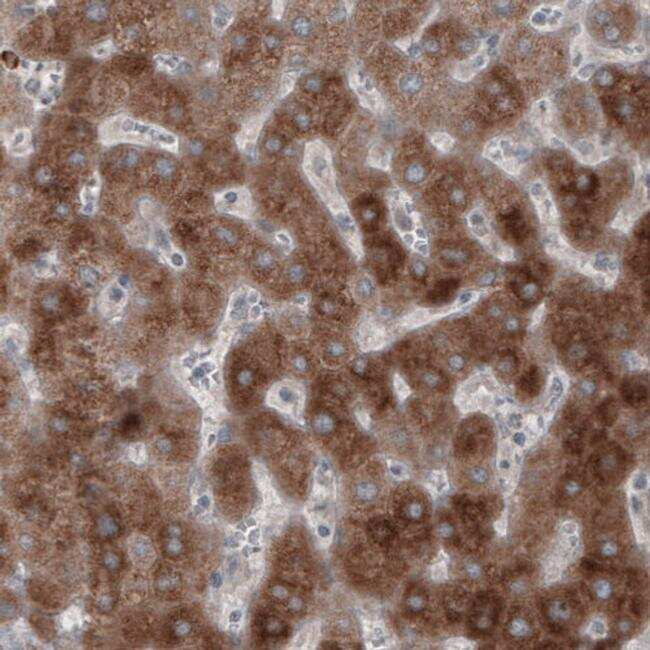
- Immunohistochemical analysis of HMGCR in human liver using a HMGCR monoclonal antibody (Product # MA5-31335). The analysis shows strong cytoplasmic immunoreactivity.
- Submitted by
- Invitrogen Antibodies (provider)
- Main image

- Experimental details
- Immunohistochemical analysis of HMGCR in human breast cancer using a HMGCR monoclonal antibody (Product # MA5-31335). The analysis shows moderate cytoplasmic immunoreactivity in tumor cells.

- Submitted by
- Invitrogen Antibodies (provider)
- Main image

- Experimental details
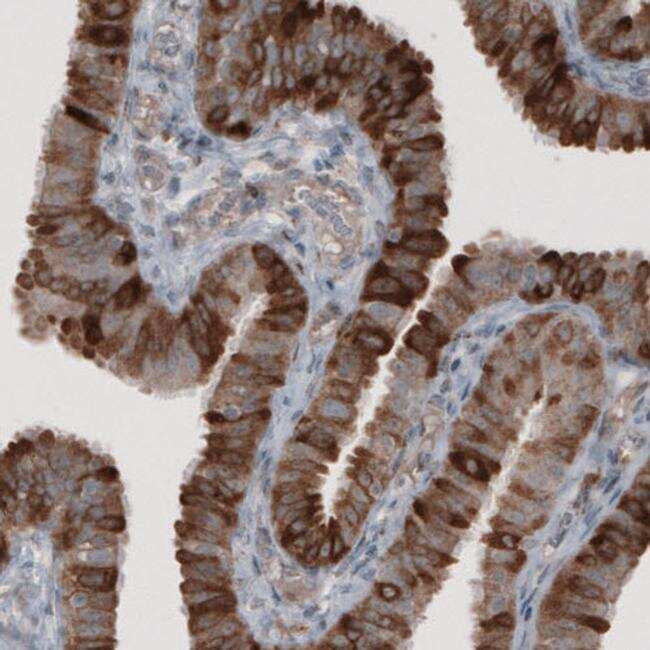
- Immunohistochemical analysis of HMGCR in human fallopian tube using a HMGCR monoclonal antibody (Product # MA5-31335). The analysis shows strong cytoplasmic positivity in glandular cells.
- Submitted by
- Invitrogen Antibodies (provider)
- Main image

- Experimental details
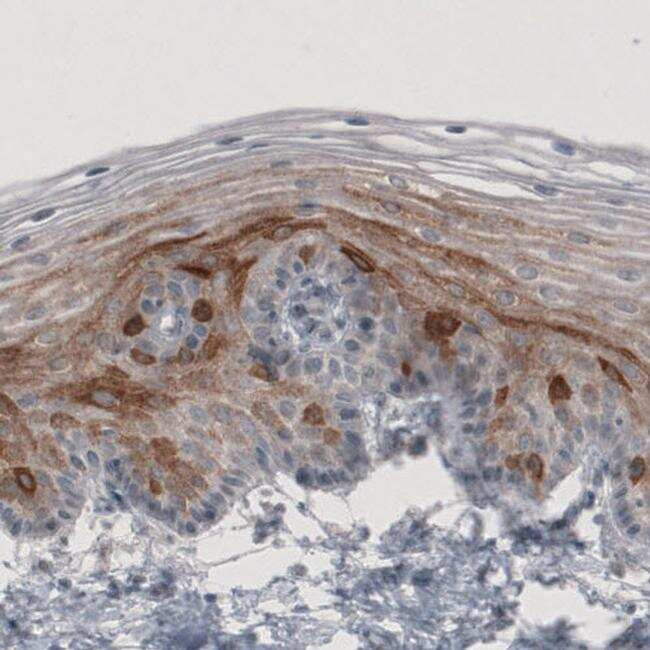
- Immunohistochemical analysis of HMGCR in human cervix using a HMGCR monoclonal antibody (Product # MA5-31335). The analysis shows cytoplasmic immunoreactivity in epithelial cells.
- Submitted by
- Invitrogen Antibodies (provider)
- Main image

- Experimental details
- Immunohistochemical analysis of HMGCR in human liver cancer using a HMGCR monoclonal antibody (Product # MA5-31335). The analysis shows strong cytoplasmic positivity in tumor cells.

- Submitted by
- Invitrogen Antibodies (provider)
- Main image
- Experimental details
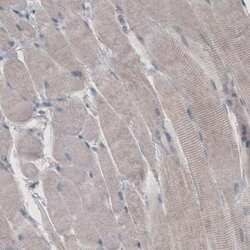
- Immunohistochemical analysis of HMGCR in human skeletal muscle using a HMGCR monoclonal antibody (Product # MA5-31335). The analysis shows absence of immunoreactivity (negative control).

Supportive validation
- Submitted by
- Invitrogen Antibodies (provider)
- Main image
- Experimental details
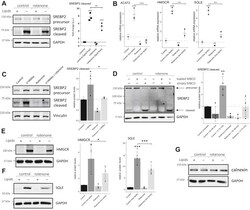
- Complex I inhibition affects posttranslational regulation of multiple cholesterol sensors on the ER. A , expression of SREBP2 precursor and cleaved SREBP2 after maturation in human primary fibroblasts following culture in the presence of DMSO (0.1%) or rotenone (100 nM) in either normal media or lipid-deficient media for 48 h as indicated. The lipid-deficient medium contained delipidated serum and atorvastatin (1 muM). Quantification of cleaved SREBP2 from three independent experiments is shown on the right . Individual values +-standard deviation is expressed as fold change compared to control cells in standard medium. Significance was calculated by ANOVA with Tukey HSD post-hoc test. B , gene expression of ACAT2, SQLE, and HMGCR measured by qPCR in human primary fibroblasts cultured and treated as in panel A . Individual measurements ( black circles ) +- standard deviation from three independent experiments are presented. Significance was calculated by ANOVA with Tukey HSD post-hoc test. C , protein expression of SREBP2 precursor and cleaved form in primary human fibroblasts following retention of cholesterol in endosomes. Cells were cultured in normal conditions, supplemented with either rotenone (100 nM), U18666a (2 muM), or both. Quantification of cleaved SREBP2 from three independent experiments is shown on the right. Individual values +-standard deviation are expressed as fold change compared to control cells in standard medium. Significance was calculated by ANOVA wit

- Submitted by
- Invitrogen Antibodies (provider)
- Main image

- Experimental details
- Complex I inhibition severely impairs mevalonate pathway expression in liver carcinoma cells. A , dose-dependent inhibition of oxygen consumption by complex I inhibition. The effect of increasing concentrations of rotenone on basal respiration in the presence of 5 mM glucose was studied. Data are expressed as percentage of baseline oxygen consumption as described in Figure 1 B . Shown is the average +-standard deviation from five replicates. B , apoptosis in HepG2 cells caused by increasing concentrations of rotenone. Staurosporine (100 nM) was included as a positive control. Apoptosis was measured as described for Figure 1 C after 2 days in culture in the presence of increasing concentrations of rotenone. Bar indicates mean four independent experiments +-standard deviation. Individual measurements shown ( black circles ). C and D , expression of SREBP2 precursor and cleaved form, SQLE ( E ), and HMGCR ( F ) in HepG2 cells was followed by Western blotting. HepG2 cells were treated with either dimethyl sulfoxide (0.1%) or rotenone (100 nM) in either normal media or lipid-deficient media for 2 days as described for Figure 5 A . The GAPDH signal was used as a loading control. D , HepG2 cells were grown as in C . For the final 2 h, cholesterol was acutely added or removed using cholesterol (50 muM) loaded or empty cyclodextrin respectively. G , RNA expression of ACAT2, SQLE, HMGCR, and HMGCS1 in HepG2 cells grown under conditions as described for panel C . Expression changes are
