Explore
 Validate
 Learn
LearnPA5-30622
antibody from Invitrogen Antibodies
Targeting: GOLM1
bA379P1.3, C9orf155, FLJ23608, GOLPH2, GP73
 Western blot
Antibody data
- Antibody Data
- Antigen structure
- References [2]
- Comments [0]
- Validations
- Western blot [3]
- Immunocytochemistry [2]
- Immunohistochemistry [1]
- Other assay [3]
Submit
Validation data
Reference
Comment
Report error
- Product number
- PA5-30622 - Provider product page

- Provider
- Invitrogen Antibodies
- Product name
- GOLPH2 Polyclonal Antibody
- Antibody type
- Polyclonal
- Antigen
- Recombinant protein fragment
- Description
- Recommended positive controls: HeLa, HeLa membrane extract, DU145.
- Concentration
- 0.16 mg/mL
Submitted references Argonaute 2 drives miR-145-5p-dependent gene expression program in breast cancer cells.
Thymic Epithelial Tumors phenotype relies on miR-145-5p epigenetic regulation.
Bellissimo T, Tito C, Ganci F, Sacconi A, Masciarelli S, Di Martino G, Porta N, Cirenza M, Sorci M, De Angelis L, Rosa P, Calogero A, Fatica A, Petrozza V, Fontemaggi G, Blandino G, Fazi F
Cell death & disease 2019 Jan 8;10(1):17
Cell death & disease 2019 Jan 8;10(1):17
Thymic Epithelial Tumors phenotype relies on miR-145-5p epigenetic regulation.
Bellissimo T, Ganci F, Gallo E, Sacconi A, Tito C, De Angelis L, Pulito C, Masciarelli S, Diso D, Anile M, Petrozza V, Giangaspero F, Pescarmona E, Facciolo F, Venuta F, Marino M, Blandino G, Fazi F
Molecular cancer 2017 May 10;16(1):88
Molecular cancer 2017 May 10;16(1):88
No comments: Submit comment
Supportive validation
- Submitted by
- Invitrogen Antibodies (provider)
- Main image

- Experimental details
- Western blot analysis of GOLPH2 using 20 µg of HeLa cell membrane lysate. Samples were loaded onto a 10% SDS-PAGE gel and probed with a GOLPH2 polyclonal antibody (Product # PA5-30622) at a dilution of 1:1000.
- Submitted by
- Invitrogen Antibodies (provider)
- Main image
- Experimental details
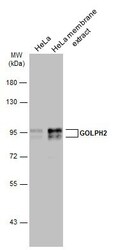
- Western Blot analysis of GOLPH2 was performed by separating 30 µg of HeLa whole cell and membrane extracts by 7.5% SDS-PAGE. Proteins were transferred to a membrane and probed with a GOLPH2 Polyclonal Antibody (Product # PA5-30622) at a dilution of 1:1000 and a HRP-conjugated anti-rabbit IgG secondary antibody.

- Submitted by
- Invitrogen Antibodies (provider)
- Main image

- Experimental details
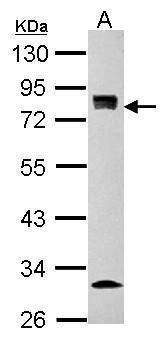
- Western blot analysis of GOLPH2 was performed by separating 30 µg of whole cell extract by 10% SDS-PAGE. Proteins were transferred to a membrane and probed with a GOLPH2 Polyclonal Antibody (Product # PA5-30622) at a dilution of 1:500. The HRP-conjugated anti-rabbit IgG antibody was used to detect the primary antibody.

Supportive validation
- Submitted by
- Invitrogen Antibodies (provider)
- Main image

- Experimental details
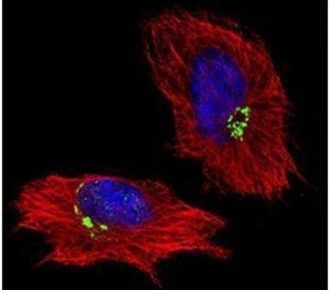
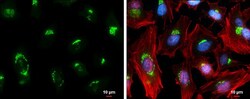
- Immunofluorescent analysis of GOLPH2 in methanol-fixed HeLa cells using a GOLPH2 polyclonal antibody (Product # PA5-30622) (Green) at a 1:500 dilution. Alpha-tubulin filaments were labeled with Product # PA5-29281 (Red) at a 1:2000.
- Submitted by
- Invitrogen Antibodies (provider)
- Main image
- Experimental details
- Immunocytochemistry-Immunofluorescence analysis of GOLPH2 was performed in HeLa cells fixed in 4% paraformaldehyde at RT for 15 min. Green: GOLPH2 Polyclonal Antibody (Product # PA5-30622) diluted at 1:500. Red: phalloidin, a cytoskeleton marker. Blue: Hoechst 33342 staining. Scale bar = 10 µm.

Supportive validation
- Submitted by
- Invitrogen Antibodies (provider)
- Main image

- Experimental details
- Immunohistochemistry (Paraffin) analysis of GOLPH2 was performed in paraffin-embedded human endometrial carcinoma tissue using GOLPH2 Polyclonal Antibody (Product # PA5-30622) at a dilution of 1:10000. Antigen Retrieval: Citrate buffer, pH 6.0, 15 min.

Supportive validation
- Submitted by
- Invitrogen Antibodies (provider)
- Main image
- Experimental details
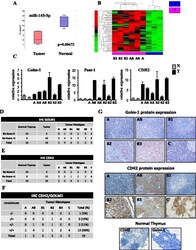
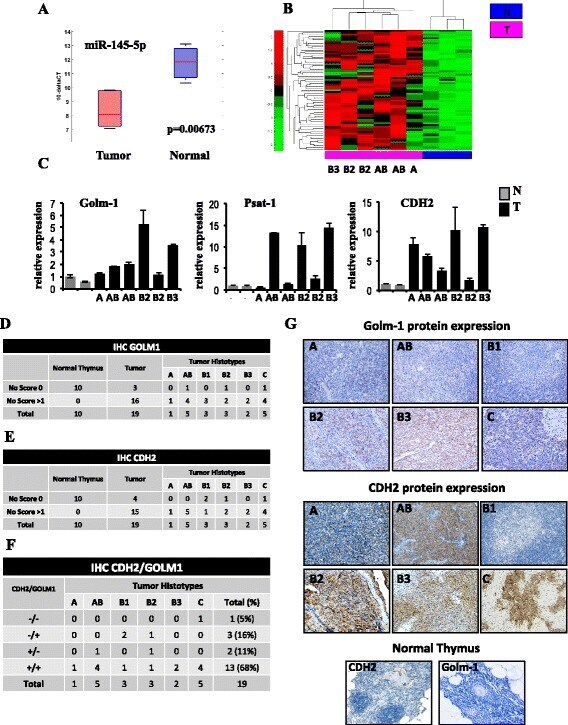
- Fig. 2 Expression profiling of putative targets of miR-145-5p in Thymoma versus normal Thymus tissues. a Box plot showing the modulation of miR-145-5p expression in the group of 6 tumors and 3 normal samples used to evaluate gene expression profiling. b Unsupervised clustering analysis representing the expression of putative targets of miR-145-5p inversely correlated to miR-145-5p expression in thymic tumors compared to normal tissues. c Validation by RT-qPCR of mRNA expression of three putative targets of miR-145-5p, Golm-1, Psat-1 and CDH2, in the same dataset of samples used for gene expression profiling (2 normal tissues and 6 tumors). d - e Table showing the number of Golm-1 and CDH2 positive (score > 1) and negative (score 0) samples in the subset of normal and tumor tissues of each histotype. f Table showing the number of Golm-1 and CDH2 co-expressing samples in the subset of tumor tissues of each histotype. g Expression of Golm-1 and CDH2 protein by immunohistochemistry (IHC) analysis in a representative normal thymus and tumor tissues of each histotype
- Submitted by
- Invitrogen Antibodies (provider)
- Main image
- Experimental details
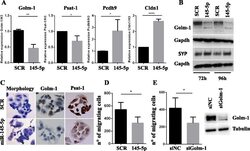
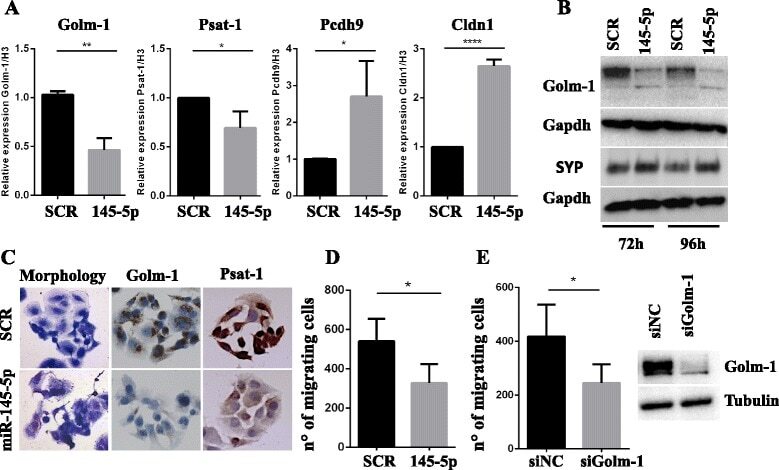
- Fig. 3 Overexpression of miR-145-5p in a Thymic Carcinoma (TC1889) cell line. a RT-qPCR to evaluate the expression levels of miR-145-5p inversely correlated (Golm-1 and Psat-1) and positively correlated (Pcdh9 and Cldn1) genes after miR-145-5p overexpression in TC1889 cells. b Western-blot analysis of Golm-1 and Synaptophysin (SYP) proteins after 72 h and 96 h of miR-145-5p overexpression in TC1889 cells. c Morphological and IHC analyses for Golm-1 and Psat-1 of miR-145-5p overexpression in TC1889 cells after 144 h or 96 h respectively. d - e Evaluation of the impact of miR-145-5p overexpression or siRNA for Golm-1 (siGolm-1) in TC1889 by migration assay after 120 h and 72 h respectively. P-value was calculated by unpaired t -test and a value of P
- Submitted by
- Invitrogen Antibodies (provider)
- Main image

- Experimental details
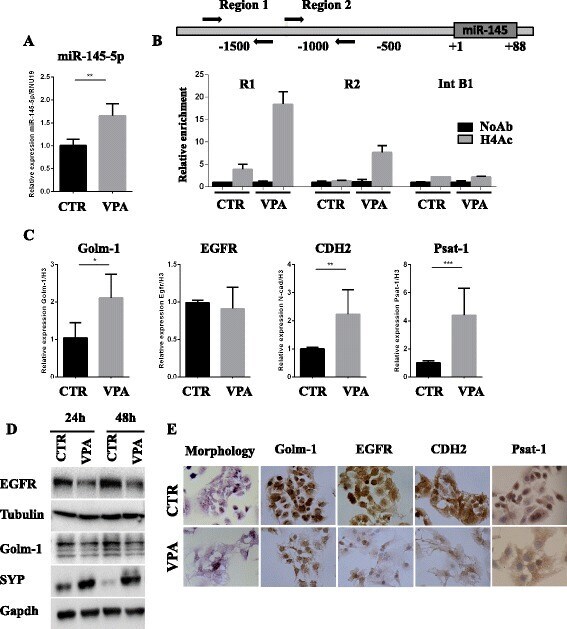
- Fig. 4 Inhibition of HDAC activity releases miR-145-5p expression resulting in miR-145-5p target genes modulation. a RT-qPCR to evaluate the expression levels of miR-145-5p after 72 h of 3 mM VPA treatment of TC1889 cells. b Schematic representation miR-145-5p upstream genomic region (upper panel) and Chromatin Immunoprecipitation (ChIP) analysis (lower panel) to evaluate the histone H4 acetylation (H4Ac) status of R1 and R2 miR-145 upstream genomic regions (R1 located at -1500 bp and R2 located at -1000pb) after 24 h of 3 mM VPA treatment in TC1886 cells. The intronic region of CCNB1 gene (Int B1) was used as negative control. c RT-qPCR to evaluate the expression levels of Golm-1, EGFR, CDH2 and Psat-1 after 72 h of 3 mM VPA treatment of TC1889 cells. d Wester blot analysis to evaluate Golm-1, EGFR and SYP after 24 h and 48 h of 3 mM VPA treatment of TC1889 cells. e Morphological and IHC analyses for Golm-1, EGFR, CDH2 and Psat-1 after 72 h of 3 mM VPA treatment of TC1889 cells. P -value was calculated by unpaired t -test and a value of P