Explore
 Validate
 Learn
Learn437000
antibody from Invitrogen Antibodies
Targeting: GAPDHS
GAPD2, GAPDH-2, GAPDS
 Western blot Immunocytochemistry
 Immunoprecipitation Immunohistochemistry Flow cytometry Other assay
Antibody data
- Antibody Data
- Antigen structure
- References [20]
- Comments [0]
- Validations
- Western blot [1]
- Immunocytochemistry [1]
- Immunohistochemistry [2]
- Flow cytometry [1]
- Other assay [9]
Submit
Validation data
Reference
Comment
Report error
- Product number
- 437000 - Provider product page

- Provider
- Invitrogen Antibodies
- Product name
- GAPDH Monoclonal Antibody (258)
- Antibody type
- Monoclonal
- Antigen
- Recombinant full-length protein
- Reactivity
- Human, Bovine, Feline, Porcine
- Host
- Mouse
- Isotype
- IgG
- Antibody clone number
- 258
- Vial size
- 100 µg
- Concentration
- 0.5 mg/mL
- Storage
- -20°C
Submitted references The Role of Selenoproteins SELENOM and SELENOT in the Regulation of Apoptosis, ER Stress, and Calcium Homeostasis in the A-172 Human Glioblastoma Cell Line.
Comparative Analysis of the Cytotoxic Effect of a Complex of Selenium Nanoparticles Doped with Sorafenib, "Naked" Selenium Nanoparticles, and Sorafenib on Human Hepatocyte Carcinoma HepG2 Cells.
Laminar Flow on Endothelial Cells Suppresses eNOS O-GlcNAcylation to Promote eNOS Activity.
High-throughput screening for natural compound-based autophagy modulators reveals novel chemotherapeutic mode of action for arzanol.
Human Adipose-derived mesenchymal stem cells promote lymphocyte apoptosis and alleviate atherosclerosis via miR-125b-1-3p/BCL11B signal axis.
HIFα independent mechanisms in renal carcinoma cells modulate divergent outcomes in fibronectin assembly mediated by hypoxia and CoCl(2).
Transgelin-2 and phosphoregulation of the LIC2 subunit of dynein govern mitotic spindle orientation.
Biomechanical regulation of drug sensitivity in an engineered model of human tumor.
Vascularized Tissue-Engineered Model for Studying Drug Resistance in Neuroblastoma.
Selenium supplementation through Se-rich dietary matrices can upregulate the anti-inflammatory responses in lipopolysaccharide-stimulated murine macrophages.
The addition of abemaciclib to sunitinib induces regression of renal cell carcinoma xenograft tumors.
Recapitulating the Size and Cargo of Tumor Exosomes in a Tissue-Engineered Model.
Actin remodeling by Nck regulates endothelial lumen formation.
Quantitative proteomics of synaptic and nonsynaptic mitochondria: insights for synaptic mitochondrial vulnerability.
Quantitative proteomics reveals oxygen-dependent changes in neuronal mitochondria affecting function and sensitivity to rotenone.
Autophagy-mediated turnover of dynamin-related protein 1.
Nck enables directional cell migration through the coordination of polarized membrane protrusion with adhesion dynamics.
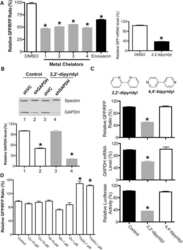
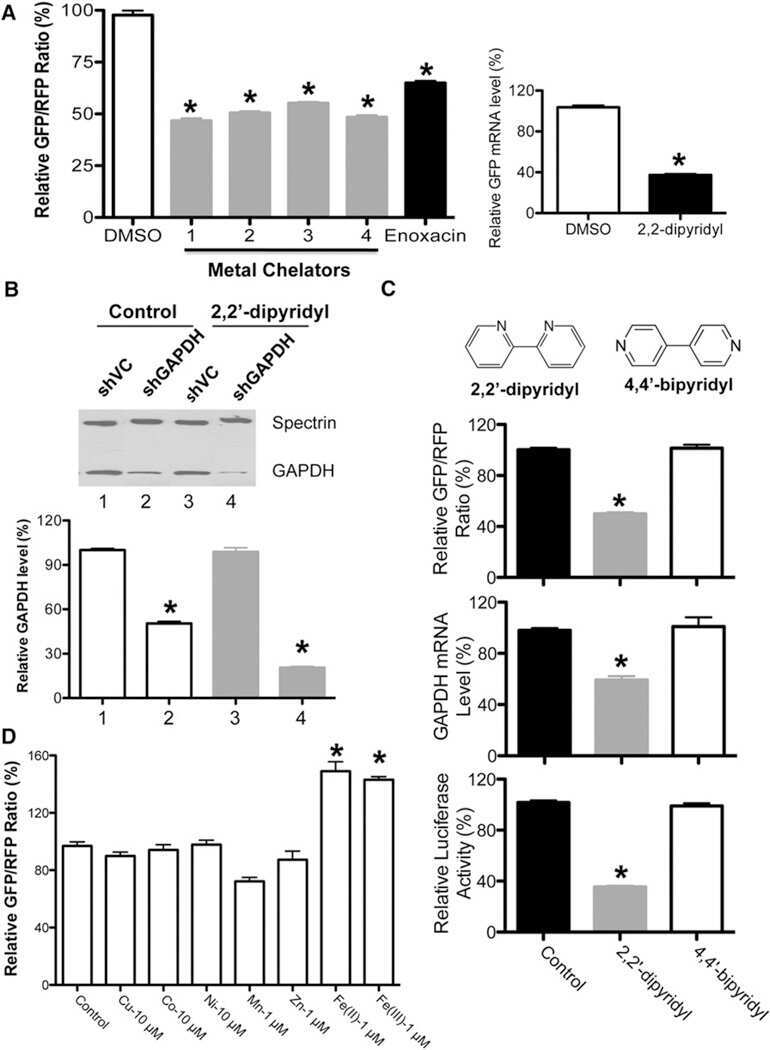
Iron homeostasis regulates the activity of the microRNA pathway through poly(C)-binding protein 2.
Membrane fusion-mediated autophagy induction enhances morbillivirus cell-to-cell spread.
A quantitative TR-FRET plate reader immunoassay for measuring autophagy.
Varlamova EG, Goltyaev MV, Turovsky EA
Biology 2022 May 25;11(6)
Biology 2022 May 25;11(6)
Comparative Analysis of the Cytotoxic Effect of a Complex of Selenium Nanoparticles Doped with Sorafenib, "Naked" Selenium Nanoparticles, and Sorafenib on Human Hepatocyte Carcinoma HepG2 Cells.
Varlamova EG, Goltyaev MV, Simakin AV, Gudkov SV, Turovsky EA
International journal of molecular sciences 2022 Jun 14;23(12)
International journal of molecular sciences 2022 Jun 14;23(12)
Laminar Flow on Endothelial Cells Suppresses eNOS O-GlcNAcylation to Promote eNOS Activity.
Basehore SE, Bohlman S, Weber C, Swaminathan S, Zhang Y, Jang C, Arany Z, Clyne AM
Circulation research 2021 Nov 12;129(11):1054-1066
Circulation research 2021 Nov 12;129(11):1054-1066
High-throughput screening for natural compound-based autophagy modulators reveals novel chemotherapeutic mode of action for arzanol.
Deitersen J, Berning L, Stuhldreier F, Ceccacci S, Schlütermann D, Friedrich A, Wu W, Sun Y, Böhler P, Berleth N, Mendiburo MJ, Seggewiß S, Anand R, Reichert AS, Monti MC, Proksch P, Stork B
Cell death & disease 2021 May 31;12(6):560
Cell death & disease 2021 May 31;12(6):560
Human Adipose-derived mesenchymal stem cells promote lymphocyte apoptosis and alleviate atherosclerosis via miR-125b-1-3p/BCL11B signal axis.
Yu C, Tang W, Lu R, Tao Y, Ren T, Gao Y
Annals of palliative medicine 2021 Feb;10(2):2123-2133
Annals of palliative medicine 2021 Feb;10(2):2123-2133
HIFα independent mechanisms in renal carcinoma cells modulate divergent outcomes in fibronectin assembly mediated by hypoxia and CoCl(2).
Magdaleno C, Dixon L, Rajasekaran N, Varadaraj A
Scientific reports 2020 Oct 29;10(1):18560
Scientific reports 2020 Oct 29;10(1):18560
Transgelin-2 and phosphoregulation of the LIC2 subunit of dynein govern mitotic spindle orientation.
Sharma A, Dagar S, Mylavarapu SVS
Journal of cell science 2020 Jun 23;133(12)
Journal of cell science 2020 Jun 23;133(12)
Biomechanical regulation of drug sensitivity in an engineered model of human tumor.
Marturano-Kruik A, Villasante A, Yaeger K, Ambati SR, Chramiec A, Raimondi MT, Vunjak-Novakovic G
Biomaterials 2018 Jan;150:150-161
Biomaterials 2018 Jan;150:150-161
Vascularized Tissue-Engineered Model for Studying Drug Resistance in Neuroblastoma.
Villasante A, Sakaguchi K, Kim J, Cheung NK, Nakayama M, Parsa H, Okano T, Shimizu T, Vunjak-Novakovic G
Theranostics 2017;7(17):4099-4117
Theranostics 2017;7(17):4099-4117
Selenium supplementation through Se-rich dietary matrices can upregulate the anti-inflammatory responses in lipopolysaccharide-stimulated murine macrophages.
Dhanjal NIK, Sharma S, Prabhu KS, Prakash NT
Food and agricultural immunology 2017;28(6):1374-1392
Food and agricultural immunology 2017;28(6):1374-1392
The addition of abemaciclib to sunitinib induces regression of renal cell carcinoma xenograft tumors.
Small J, Washburn E, Millington K, Zhu J, Holder SL
Oncotarget 2017 Nov 10;8(56):95116-95134
Oncotarget 2017 Nov 10;8(56):95116-95134
Recapitulating the Size and Cargo of Tumor Exosomes in a Tissue-Engineered Model.
Villasante A, Marturano-Kruik A, Ambati SR, Liu Z, Godier-Furnemont A, Parsa H, Lee BW, Moore MA, Vunjak-Novakovic G
Theranostics 2016;6(8):1119-30
Theranostics 2016;6(8):1119-30
Actin remodeling by Nck regulates endothelial lumen formation.
Chaki SP, Barhoumi R, Rivera GM
Molecular biology of the cell 2015 Sep 1;26(17):3047-60
Molecular biology of the cell 2015 Sep 1;26(17):3047-60
Quantitative proteomics of synaptic and nonsynaptic mitochondria: insights for synaptic mitochondrial vulnerability.
Stauch KL, Purnell PR, Fox HS
Journal of proteome research 2014 May 2;13(5):2620-36
Journal of proteome research 2014 May 2;13(5):2620-36
Quantitative proteomics reveals oxygen-dependent changes in neuronal mitochondria affecting function and sensitivity to rotenone.
Villeneuve L, Tiede LM, Morsey B, Fox HS
Journal of proteome research 2013 Oct 4;12(10):4599-606
Journal of proteome research 2013 Oct 4;12(10):4599-606
Autophagy-mediated turnover of dynamin-related protein 1.
Purnell PR, Fox HS
BMC neuroscience 2013 Aug 9;14:86
BMC neuroscience 2013 Aug 9;14:86
Nck enables directional cell migration through the coordination of polarized membrane protrusion with adhesion dynamics.
Chaki SP, Barhoumi R, Berginski ME, Sreenivasappa H, Trache A, Gomez SM, Rivera GM
Journal of cell science 2013 Apr 1;126(Pt 7):1637-49
Journal of cell science 2013 Apr 1;126(Pt 7):1637-49
Iron homeostasis regulates the activity of the microRNA pathway through poly(C)-binding protein 2.
Li Y, Lin L, Li Z, Ye X, Xiong K, Aryal B, Xu Z, Paroo Z, Liu Q, He C, Jin P
Cell metabolism 2012 Jun 6;15(6):895-904
Cell metabolism 2012 Jun 6;15(6):895-904
Membrane fusion-mediated autophagy induction enhances morbillivirus cell-to-cell spread.
Delpeut S, Rudd PA, Labonté P, von Messling V
Journal of virology 2012 Aug;86(16):8527-35
Journal of virology 2012 Aug;86(16):8527-35
A quantitative TR-FRET plate reader immunoassay for measuring autophagy.
Hancock MK, Hermanson SB, Dolman NJ
Autophagy 2012 Aug;8(8):1227-44
Autophagy 2012 Aug;8(8):1227-44
No comments: Submit comment
Supportive validation
- Submitted by
- Invitrogen Antibodies (provider)
- Main image
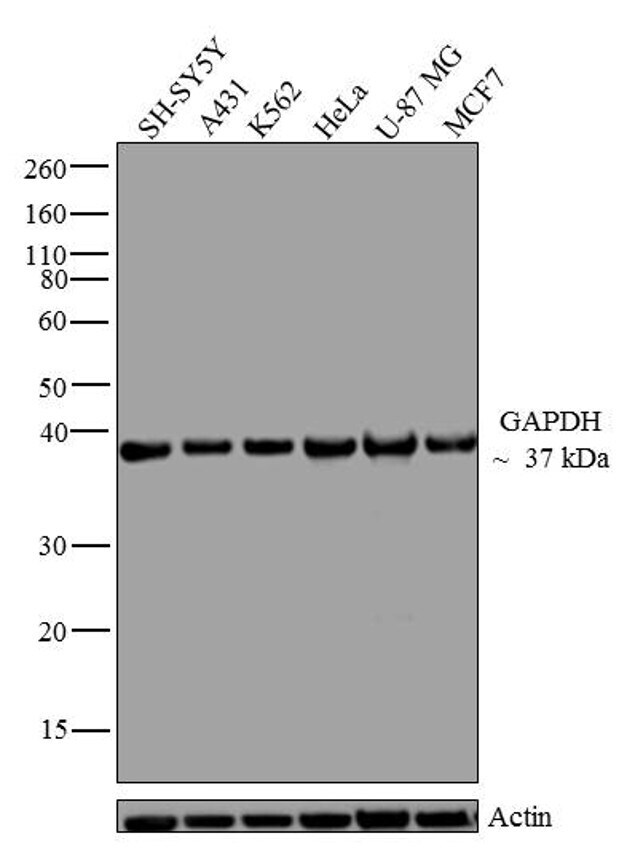
- Experimental details
- Western blot analysis of GAPDH was performed by loading 20 µg of SH-SY5Y (lane1), A431 (lane2), K562 (lane3), HeLa (lane4), U-87 MG (lane5) and MCF7 (lane6) cell lysate using Novex®NuPAGE®4-12 % Bis-Tris gel (Product # NP0321BOX), XCell SureLock Electrophoresis System (Product # EI0002), Novex® Sharp Pre-Stained Protein Standard (LC5800), and iBlot® Dry Blotting System (IB21001). Proteins were transferred to a nitrocellulose membrane and blocked with 5 % skim milk for 1 hour at room temperature. GAPDH was detected at ~37 kDa using GAPDH Mouse Monoclonal Antibody (Product # 437000) at 1-2 µg/mL in 2.5 % skim milk at 4°C overnight on a rocking platform. Goat Anti-Mouse IgG - HRP Secondary Antibody (Product # 62-6520) at 1:4000 dilution was used and chemiluminescent detection was performed using Pierce™ ECL Western Blotting Substrate (Product # 32106).
Supportive validation
- Submitted by
- Invitrogen Antibodies (provider)
- Main image
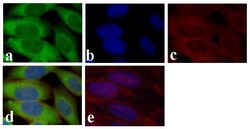
- Experimental details
- Immunofluorescent analysis of GAPDH was done on 70% confluent log phase HeLa cells. The cells were fixed with 4% paraformaldehyde for 15 minutes, permeabilized with 0.25% Triton™ X-100 for 10 minutes, and blocked with 5% BSA for 1 hour at room temperature. The cells were labeled with GAPDH Mouse Monoclonal Antibody (Product # 437000) at 1 µg/mL and incubated for 3 hours at room temperature and then labeled with Alexa Fluor 488 Rabbit Anti-Mouse IgG Secondary Antibody (Product # A-11059) at a dilution of 1:400 for 30 minutes at room temperature (Panel a: green). Nuclei (Panel b: blue) were stained with SlowFade® Gold Antifade Mountant with DAPI (Product # S36938). F-actin (Panel c: red) was stained with Alexa Fluor 594 Phalloidin (Product # A12381). Panel d is a merged image showing cytoplasmic localization. Panel e shows no primary antibody control. The images were captured at 20X magnification.

Supportive validation
- Submitted by
- Invitrogen Antibodies (provider)
- Main image
- Experimental details
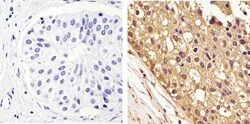
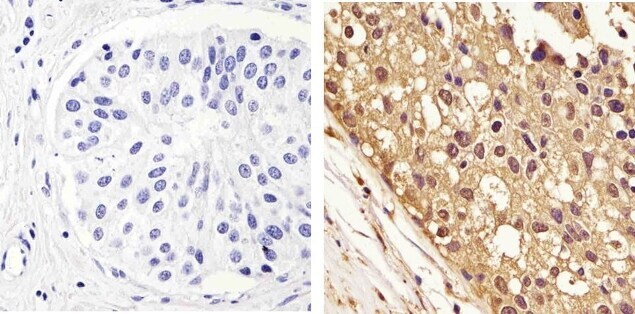
- Immunohistochemistry analysis of GAPDH showing staining in the cytoplasm and nucleus of paraffin-embedded human breast carcinoma (right) compared to a negative control without primary antibody (left). To expose target proteins, antigen retrieval was performed using 10mM sodium citrate (pH 6.0), microwaved for 8-15 min. Following antigen retrieval, tissues were blocked in 3% H2O2-methanol for 15 min at room temperature, washed with ddH2O and PBS, and then probed with a GAPDH monoclonal antibody (Product # 437000) diluted in 3% BSA-PBS at a dilution of 1:100 overnight at 4°C in a humidified chamber. Tissues were washed extensively in PBST and detection was performed using an HRP-conjugated secondary antibody followed by colorimetric detection using a DAB kit. Tissues were counterstained with hematoxylin and dehydrated with ethanol and xylene to prep for mounting.
- Submitted by
- Invitrogen Antibodies (provider)
- Main image
- Experimental details
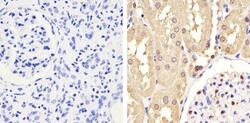
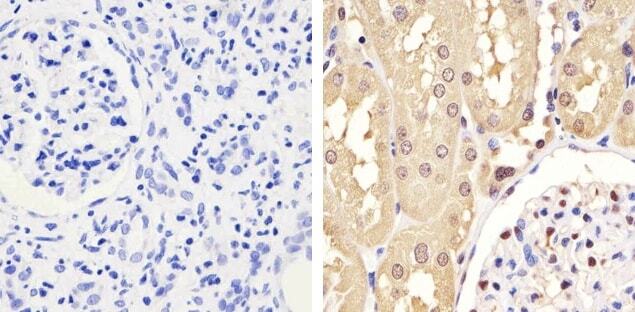
- Immunohistochemistry analysis of GAPDH showing staining in the cytoplasm and nucleus of paraffin-embedded human kidney tissue (right) compared to a negative control without primary antibody (left). To expose target proteins, antigen retrieval was performed using 10mM sodium citrate (pH 6.0), microwaved for 8-15 min. Following antigen retrieval, tissues were blocked in 3% H2O2-methanol for 15 min at room temperature, washed with ddH2O and PBS, and then probed with a GAPDH monoclonal antibody (Product # 437000) diluted in 3% BSA-PBS at a dilution of 1:100 overnight at 4°C in a humidified chamber. Tissues were washed extensively in PBST and detection was performed using an HRP-conjugated secondary antibody followed by colorimetric detection using a DAB kit. Tissues were counterstained with hematoxylin and dehydrated with ethanol and xylene to prep for mounting.
Supportive validation
- Submitted by
- Invitrogen Antibodies (provider)
- Main image
- Experimental details
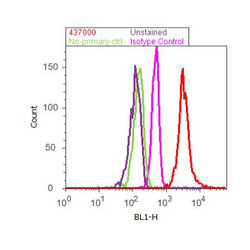
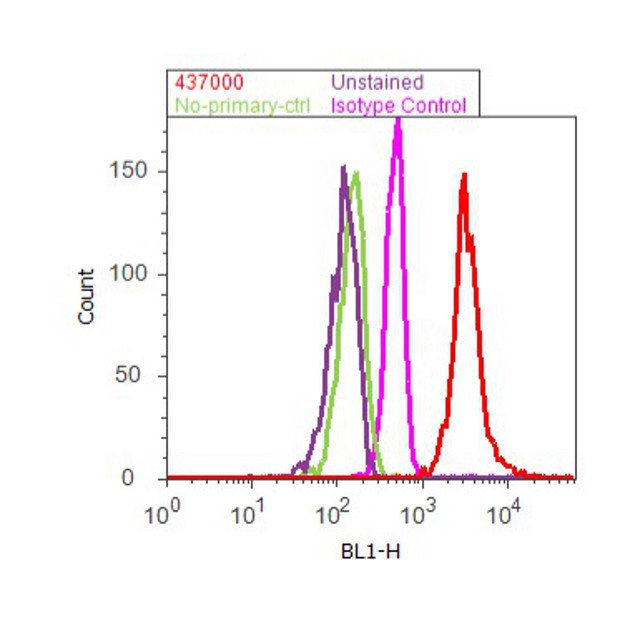
- Flow cytometry analysis of GAPDH was done on HeLa cells. Cells were fixed with 70% ethanol for 10 minutes, permeabilized with 0.25% Tritonª X-100 for 20 minutes, and blocked with 5% BSA for 30 minutes at room temperature. Cells were labeled with GAPDH Mouse Monoclonal Antibody (437000, red histogram) or with mouse isotype control (pink histogram) at 3-5 µg/million cells in 2.5% BSA. After incubation at room temperature for 2 hours, the cells were labeled with Alexa Fluor¨ 488 Rabbit Anti-Mouse Secondary Antibody (A11059) at a dilution of 1:400 for 30 minutes at room temperature. The representative 10,000 cells were acquired and analyzed for each sample using an Attune¨ Acoustic Focusing Cytometer. The purple histogram represents unstained control cells and the green histogram represents no-primary-antibody control.
Supportive validation
- Submitted by
- Invitrogen Antibodies (provider)
- Main image
- Experimental details
- NULL
- Submitted by
- Invitrogen Antibodies (provider)
- Main image
- Experimental details
- NULL
- Submitted by
- Invitrogen Antibodies (provider)
- Main image
- Experimental details
- NULL
- Submitted by
- Invitrogen Antibodies (provider)
- Main image

- Experimental details
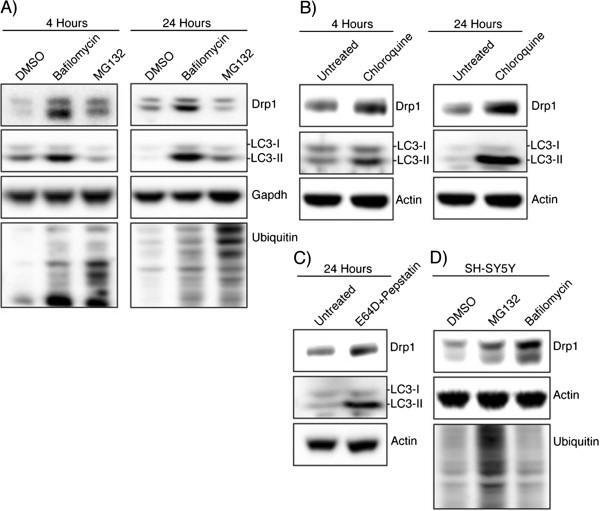
- Figure 1 Drp1 expression is increased after inhibiting autophagy. (A) HEK-293T cells were incubated with DMSO, Bafilomycin (100 nM), or MG132 (25 muM) for 4 hours and 24 hours and whole cell lysate was analyzed by Western blotting using the indicated antibodies. LC3 levels confirm the bafilomycin is inhibiting autophagic turnover and total ubiquitin levels confirm MG132 effect. (B) HEK-293T cells were incubated with chloroquine (10 muM) for 4 hours and 24 hours followed by Western blotting (C) Lysosomal protease inhibitors E64D (10 mug/ml) and pepstatin (10 mug/ml) were incubated with HEK-293T cells for 24 hours. (D) SH-SY5Y cells were incubated with DMSO, bafilomycin (100 nM), or MG132 (25 muM) for 24 hours.
- Submitted by
- Invitrogen Antibodies (provider)
- Main image

- Experimental details
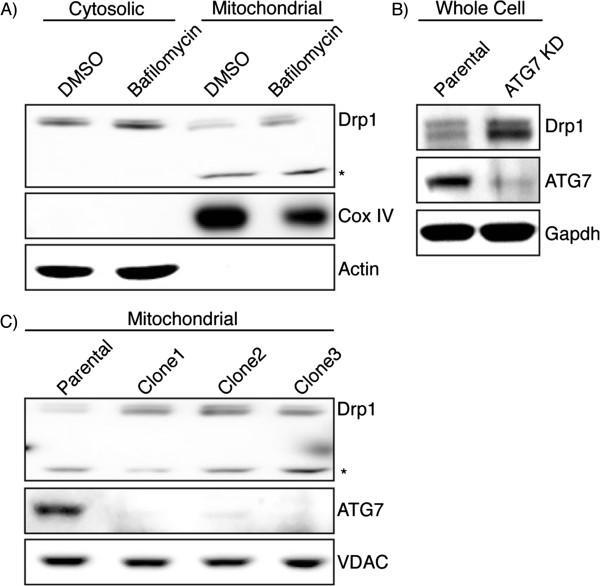
- Figure 2 Bafilomycin and ATG7 knockdown increases mitochondrial Drp1. (A) Cytosolic and mitochondrial fractions from bafilomycin treated HEK-293T cells were isolated by differential centrifugation and analyzed by immunoblotting. *Drp1 antibody reactive band that is only seen in the mitochondrial fraction. Cox IV is used as a mitochondrial loading control and Actin indicates most of the cytosol is absent from the mitochondrial fraction. (B) ATG7 stable knockdown clones were created and whole cell lysate was subject to immunoblotting. (C) Mitochondrial fractions of ATG7 knockdown clones were isolated and lysates were probed with the indicated antibodies. VDAC is used as a mitochondrial loading control.
- Submitted by
- Invitrogen Antibodies (provider)
- Main image
- Experimental details
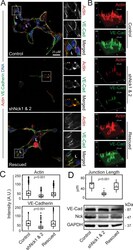
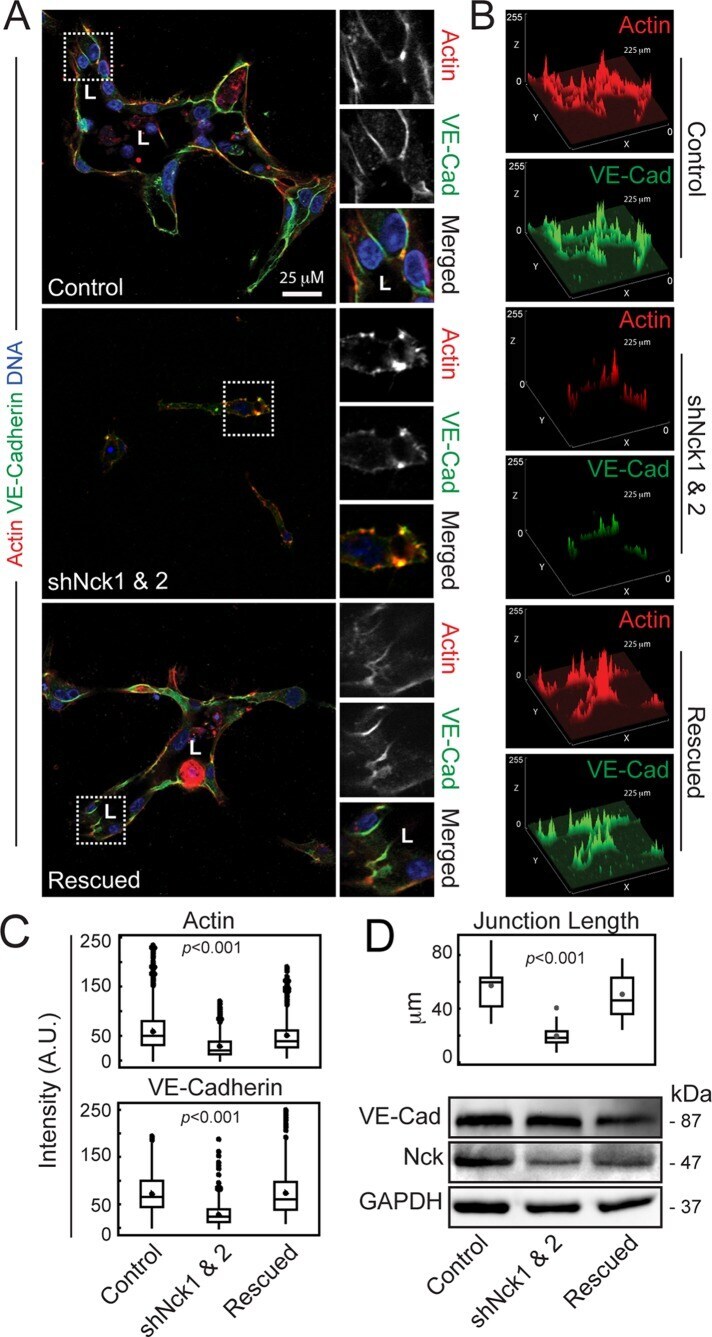
- FIGURE 3: Silencing of Nck disrupts the organization of F-actin and the distribution of VE-cadherin in cells cultured in 3D collagen matrices. (A) Confocal images showing F-actin (red), endogenous VE-cadherin (green), and nuclei (blue). Lumens (L) are indicated. The ROIs (dotted squares) were magnified and are shown to the right. (B) Surface plots showing pixel intensities for field images in A. (C) Actin and VE-cadherin accumulation at cell-cell contacts. Mean fluorescence intensity was quantified in 23-50 equal-size ROIs pooled from three independent experiments. (D) Quantitation of VE-cadherin cell-cell junctional lengths (top). Data represent mean junctional length (mum) determined in a total of 25-30 junctions pooled from three individual experiments. The Western blots (bottom) show the levels of VE-cadherin, Nck, and GAPDH (loading control) in cell extracts from 3D cultures.
- Submitted by
- Invitrogen Antibodies (provider)
- Main image
- Experimental details
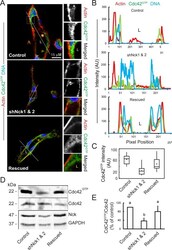
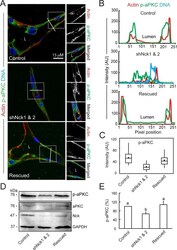
- FIGURE 5: Loss of Nck disrupts activation of endogenous Cdc42 in cells cultured in 3D collagen matrices. (A) Confocal images showing the cytoskeletal architecture (F-actin; red), distribution of GTP-bound Cdc42 (Cdc42 GTP ; green), and nuclei (DNA; blue). Lumens (L) are indicated. The ROIs (dotted squares) were magnified and are shown to the right. Scale bar, 15 mum. (B) Line scans showing intensities along the solid white lines displayed in A. (C) Quantification of luminal Cdc42 fluorescence intensity. Average pixel intensity was extracted from 35-50 ROIs from images acquired in three independent experiments. (D) Representative Western blots showing levels of GTP-bound Cdc42 (PBD Pak1 pull-down assays), total Cdc42, Nck, and GAPDH in cell extracts obtained from 3D cultures. (E) Quantification of active Cdc42. The intensity of bands corresponding to active Cdc42 (PBD Pak1 pull-down assays) was normalized by the intensity of bands corresponding to total Cdc42 in cell extracts and expressed as percentage of control cultures ( n = 3 independent experiments).
- Submitted by
- Invitrogen Antibodies (provider)
- Main image
- Experimental details
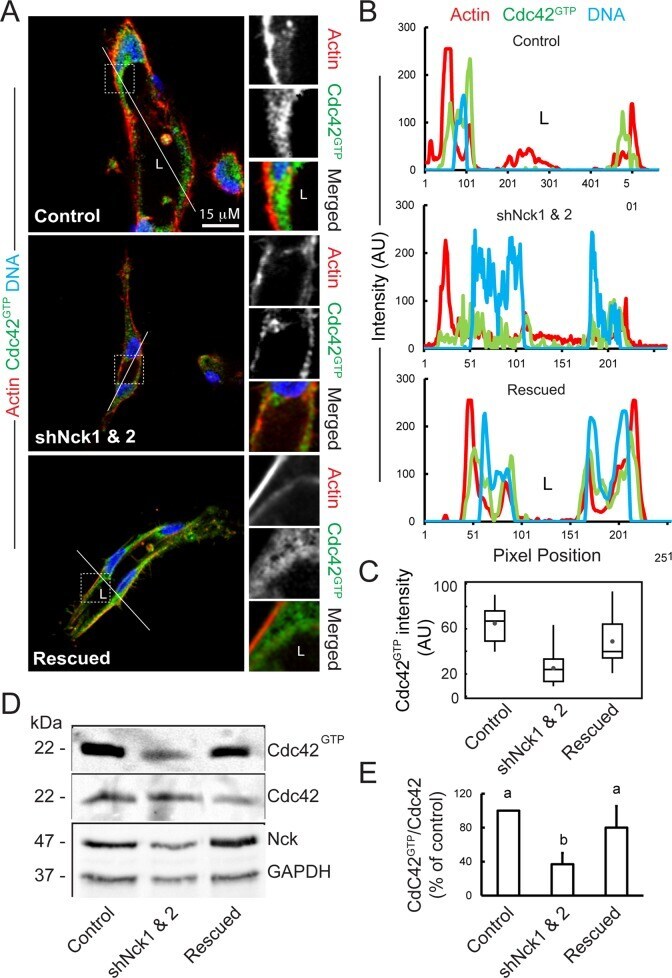
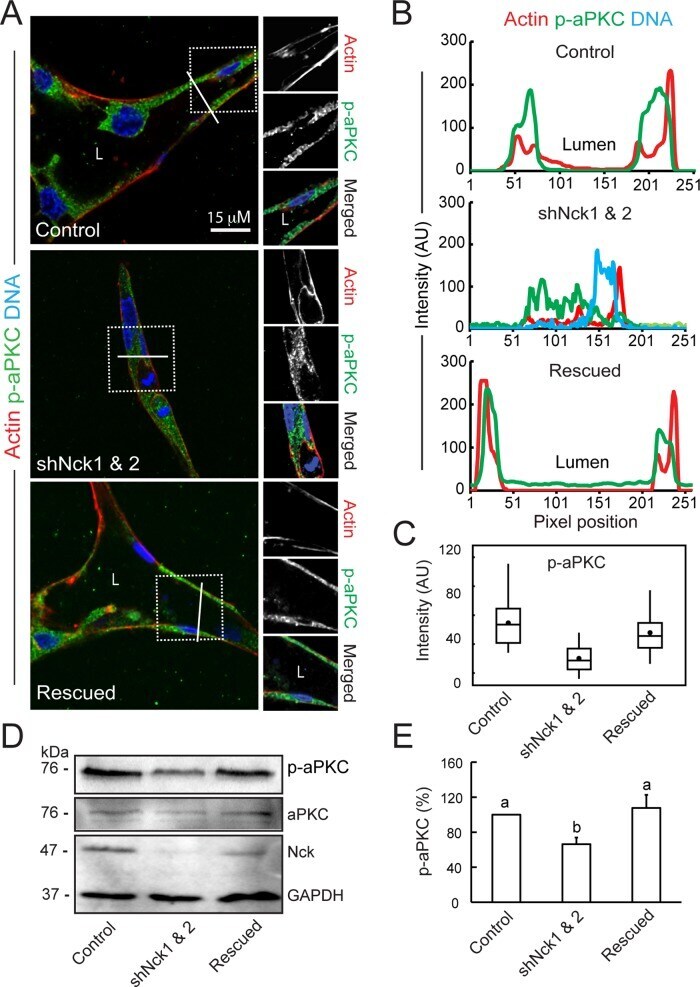
- FIGURE 7: Loss of Nck disrupts the activation of endogenous aPKC in cells cultured in 3D collagen matrices. (A) Confocal images showing the cytoskeletal architecture (F-actin; red), distribution of active aPKC (p-aPKC; green), and nuclei (DNA; blue). Lumens (L) are indicated. The ROIs (dotted squares) were magnified and are shown to the right. (B) Line scans showing intensities along the solid white lines displayed in A. (C) Quantification of luminal p-aPKC fluorescence intensity. Average pixel intensity was extracted from 35-50 ROIs from images acquired in three independent experiments. (D) Representative Western blots showing levels of p-aPKC, total aPKC, Nck, and GAPDH in cell extracts from 3D cultures. (E) Quantification of active aPKC. The intensity of bands corresponding to p-aPKC was normalized by the intensity of bands corresponding to total aPKC and expressed as percentage of control cultures ( n = 3 independent experiments). a, b, p < 0.05.
- Submitted by
- Invitrogen Antibodies (provider)
- Main image
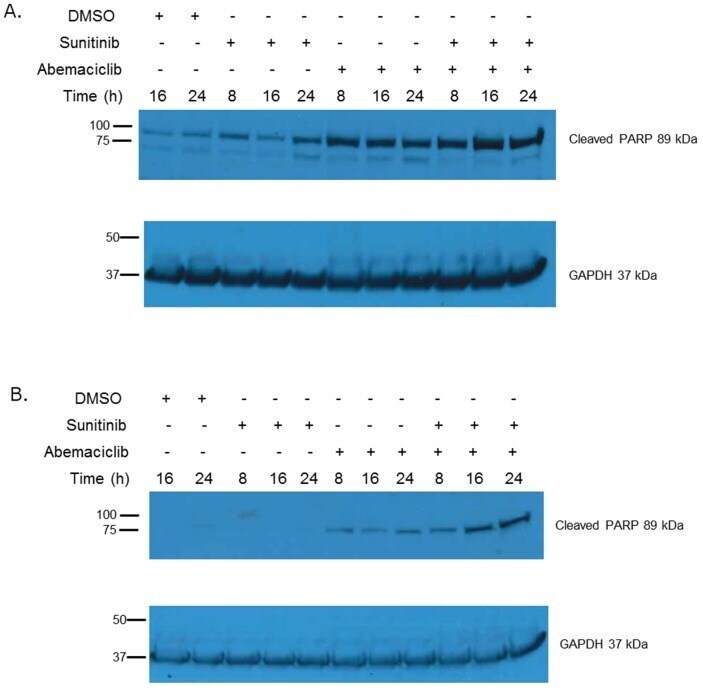
- Experimental details
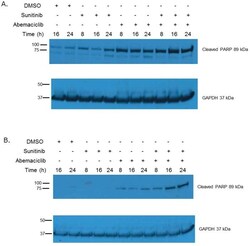
- Figure 5 Abemaciclib causes increased PARP cleavage in RCC In 786-O cells (A) and Caki-1 cells (B) abemaciclib exposure results in increased PARP cleavage. This effect is more rapid and pronounced when abemaciclib is combined with sunitinib.