Explore
 Validate
 Learn
Learn Western blot
Antibody data
- Antibody Data
- Antigen structure
- References [1]
- Comments [0]
- Validations
- Western blot [2]
- Immunocytochemistry [1]
- Flow cytometry [2]
- Other assay [1]
Submit
Validation data
Reference
Comment
Report error
- Product number
- MA5-24179 - Provider product page

- Provider
- Invitrogen Antibodies
- Product name
- TSPAN8 Monoclonal Antibody (458811)
- Antibody type
- Monoclonal
- Antigen
- Other
- Description
- Reconstitute at 0.5 mg/mL in sterile PBS.
- Reactivity
- Human
- Host
- Rat
- Isotype
- IgG
- Antibody clone number
- 458811
- Vial size
- 100 µg
- Concentration
- 0.5 mg/mL
- Storage
- -20° C, Avoid Freeze/Thaw Cycles
Submitted references PyMINEr Finds Gene and Autocrine-Paracrine Networks from Human Islet scRNA-Seq.
Tyler SR, Rotti PG, Sun X, Yi Y, Xie W, Winter MC, Flamme-Wiese MJ, Tucker BA, Mullins RF, Norris AW, Engelhardt JF
Cell reports 2019 Feb 12;26(7):1951-1964.e8
Cell reports 2019 Feb 12;26(7):1951-1964.e8
No comments: Submit comment
Supportive validation
- Submitted by
- Invitrogen Antibodies (provider)
- Main image
- Experimental details
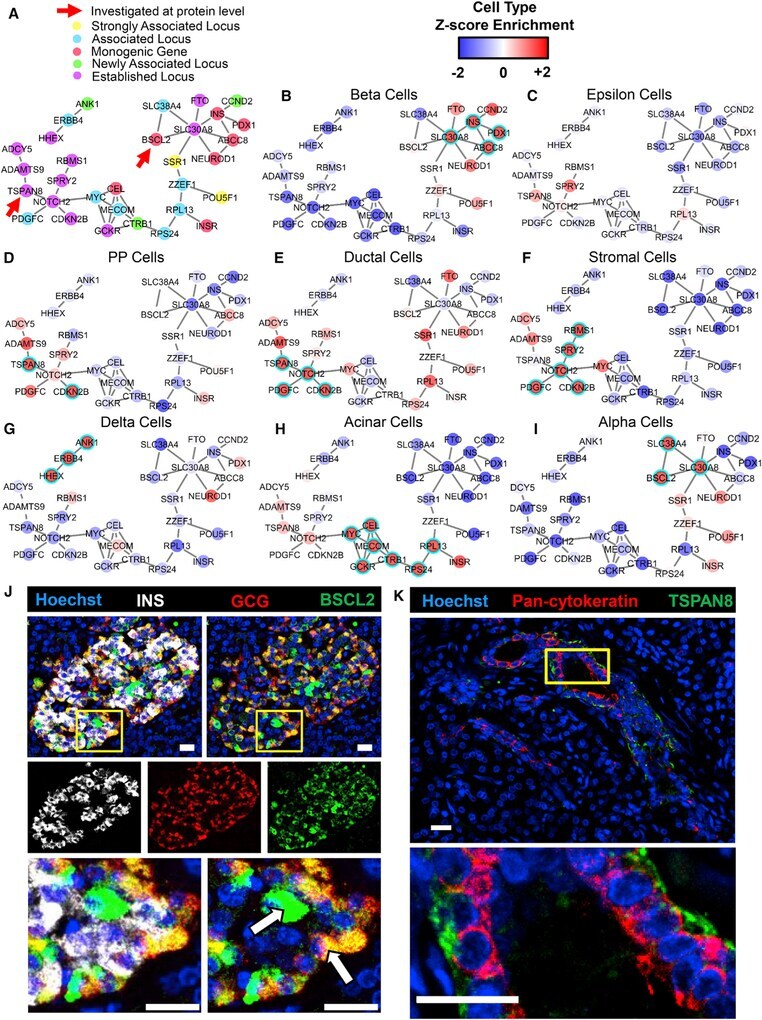
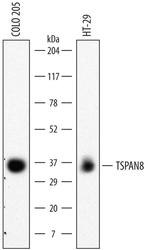
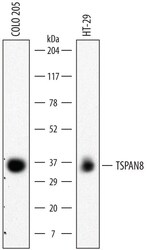
- Western blot analysis from lysates of COLO 205 human colorectal adenocarcinoma cell line and HT-29 human colon adenocarcinoma cell line. PVDF membrane was probed with 2 µg/mL of Rat Anti-human TSPAN8 Monoclonal Antibody (Product # MA5-24179) followed by HRP-conjugated Anti-Rat IgG Secondary Antibody. A specific band was detected for TSPAN8 at approximately 35 kDa (as indicated). This experiment was conducted under non-reducing conditions.

- Submitted by
- Invitrogen Antibodies (provider)
- Main image
- Experimental details
- Western blot analysis of TSPAN8 in COLO 205 human colorectal adenocarcinoma cell line and HT‚29 human colon adenocarcinoma cell line. Samples were incubated in TSPAN8 monoclonal antibody (Product # MA5-24179) using a dilution of 2 µg/mL followed by a HRP-conjugated Anti-Rat IgG secondary antibody. A specific band was detected for TSPAN8 at approximately 35 kDa (as indicated). This experiment was conducted under non-reducing conditions.
Supportive validation
- Submitted by
- Invitrogen Antibodies (provider)
- Main image
- Experimental details
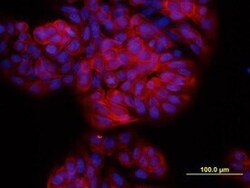
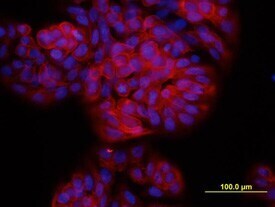
- Immunocytochemistry analysis of TSPAN8 in immersion fixed HT‚29 human colon adenocarcinoma cell line. Samples were incubated in TSPAN8 monoclonal antibody (Product # MA5-24179) using a dilution of 10 µg/mL for 3 hours at room temperature followed by NorthernLights™ 557-conjugated Anti-Rat IgG Secondary Antibody (red) and counterstained with DAPI (blue).
Supportive validation
- Submitted by
- Invitrogen Antibodies (provider)
- Main image
- Experimental details
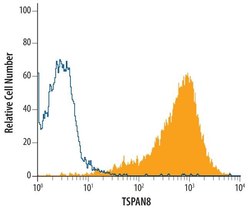
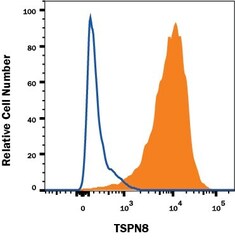
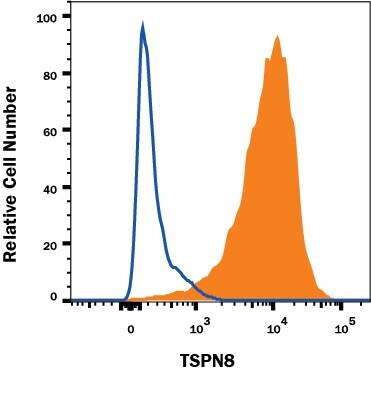
- Flow cytometric analysis of HT29 human colon adenocarcinoma cell line was stained with Rat Anti-human TSPAN8 Monoclonal (Product # MA5-24179, filled histogram) or isotype control antibody (open histogram), followed by Allophycocyanin-conjugated Anti-Rat IgG F (ab')2 Secondary Antibody.

- Submitted by
- Invitrogen Antibodies (provider)
- Main image
- Experimental details
- Flow cytometry of TSPAN8 in HT‚29 human colon adenocarcinoma cell line. Samples were incubated in TSPAN8 monoclonal antibody (Product # MA5-24179) or isotype control antibody followed by Allophycocyanin-conjugated Anti-Rat IgG F(ab)2 Secondary Antibody.
Supportive validation
- Submitted by
- Invitrogen Antibodies (provider)
- Main image
- Experimental details
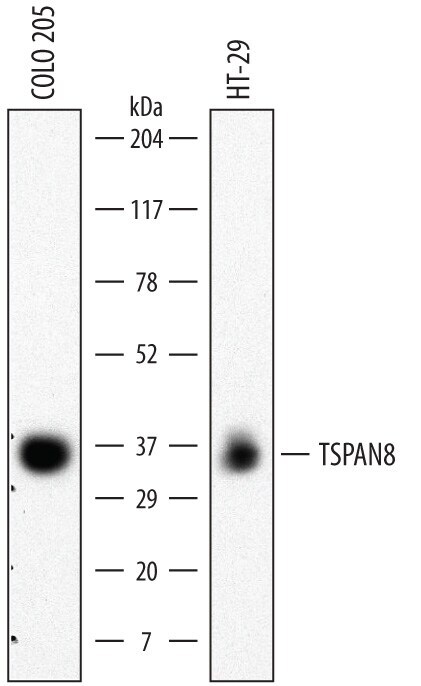
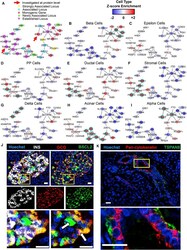
- Figure 5. Cell Type-Specific Enrichment of T2D-Associated Genes (A) A subset of the larger networks shown in Figure 2E focused on T2D-associated genes. The nature of the associations that were previously published is indicated by color ( Morris et al., 2012 ). Gene associations newly discovered through the cited meta-analysis are denoted as ""newly associated locus."" (B-I) The Z score enrichment of T2D-associated genes by cell type (from our dataset) are displayed over the two largest connected components of the T2D gene subset of the transcriptional network built by PyMINEr. As indicated, panels correspond to beta (B), epsilon (C), pancreatic polypeptide cells (D), ductal (E), stromal (F), delta (G), acinar (H), and alpha cells (I). Highly enriched genes are shown in red, whereas genes whose expression is low in the given cell type are shown in blue. If a gene passed the threshold for significant enrichment for the given cell type, then it is highlighted with a cyan ring. Table S2A lists cell type annotations for all T2D-associated genes, including those not shown here. (J) Immunofluorescence staining of a human pancreas section for glucagon (GCG; alpha cells, red), BSCL2 (green), and insulin (INS; beta cells, white) and counterstaining with Hoechst dye (nuclei, blue) (n = 5). Although many alpha cells were positive for BSCL2, we also observed expression in other islet cells (examples noted with arrows). (K) Representative immunofluorescence staining of a human pancreas sec