 Explore
 Validate
 Learn
LearnPA5-17018
antibody from Invitrogen Antibodies
Targeting: ATG3
APG3L, DKFZp564M1178, FLJ22125, MGC15201, PC3-96
 Western blot
Antibody data
- Antibody Data
- Antigen structure
- References [2]
- Comments [0]
- Validations
- Western blot [3]
- Other assay [2]
Submit
Validation data
Reference
Comment
Report error
- Product number
- PA5-17018 - Provider product page

- Provider
- Invitrogen Antibodies
- Product name
- ATG3 Polyclonal Antibody
- Antibody type
- Polyclonal
- Antigen
- Synthetic peptide
- Description
- It is not recommended to aliquot this antibody.
- Reactivity
- Human, Mouse, Rat, Bovine, Canine, Chicken/Avian, Xenopus
- Host
- Rabbit
- Isotype
- IgG
- Vial size
- 100 µL
- Storage
- -20°C
Submitted references ATG7 is dispensable for LC3-PE conjugation in thioglycolate-elicited mouse peritoneal macrophages.
Pseudogene legumain promotes thyroid carcinoma progression via the microRNA-495/autophagy pathway.
Vujić N, Bradić I, Goeritzer M, Kuentzel KB, Rainer S, Kratky D, Radović B
Autophagy 2021 Nov;17(11):3402-3407
Autophagy 2021 Nov;17(11):3402-3407
Pseudogene legumain promotes thyroid carcinoma progression via the microRNA-495/autophagy pathway.
Sun J, Peng Y, Liu J, Zhou H, Sun L, He Q, Yu E
Oncology letters 2021 Aug;22(2):616
Oncology letters 2021 Aug;22(2):616
No comments: Submit comment
Supportive validation
- Submitted by
- Invitrogen Antibodies (provider)
- Main image
- Experimental details
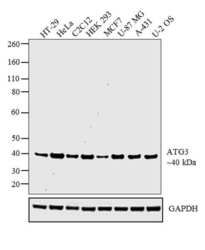
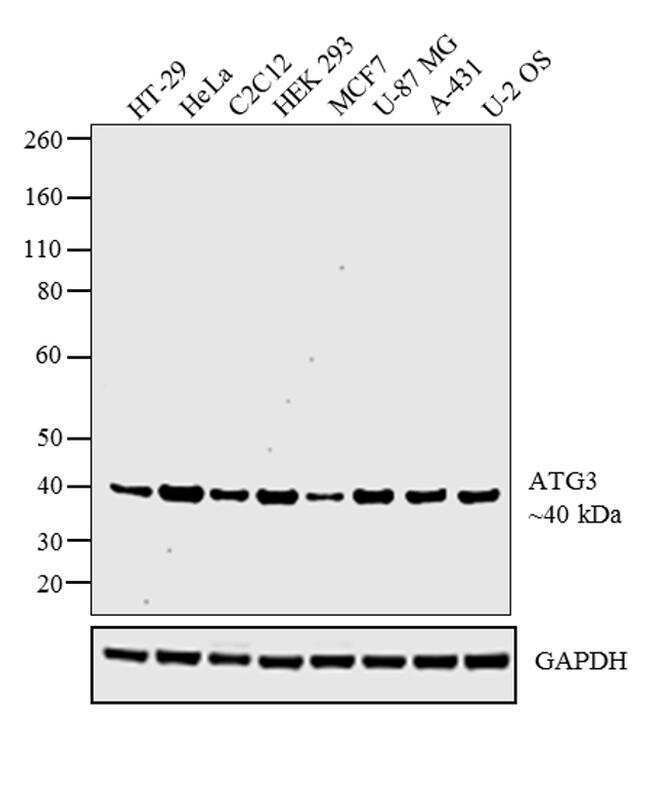
- Western blot analysis was performed on whole cell extracts (30 µg lysate) of HT-29 (Lane 1), HeLa (Lane 2), C2C12 (Lane 3), HEK 293 (Lane 4), MCF7 (Lane 5), U-87 MG (Lane 6), A-431 (Lane 7) and U-2 OS (Lane 8). The blot was probed with Anti-ATG3 Polyclonal Antibody (Product # PA5-17018, 1:1000 dilution) and detected by chemiluminescence using Goat anti-Rabbit IgG (H+L) Superclonal™ Secondary Antibody, HRP conjugate (Product # A27036, 0.25 µg/ml, 1:4000 dilution). A 40 kDa band corresponding to ATG3 was observed across the cell lines tested.
- Submitted by
- Invitrogen Antibodies (provider)
- Main image
- Experimental details
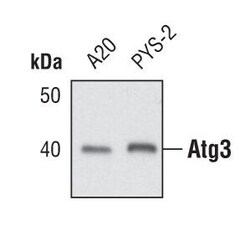
- Western blot analysis of Atg3 in extracts from A20 and PYS-2 cell lines using Atg3 polyclonal antibody (Product # PA5-17018).

- Submitted by
- Invitrogen Antibodies (provider)
- Main image

- Experimental details
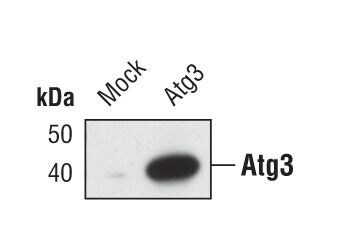
- Western blot analysis of Atg3 in extracts from HeLa cells, mock transfected or transfected with mouse Atg3, using Atg3 polyclonal antibody (Product # PA5-17018).
Supportive validation
- Submitted by
- Invitrogen Antibodies (provider)
- Main image
- Experimental details
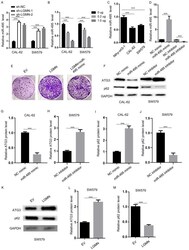
- Figure 3. miR-495 modulates autophagy. (A) RT-qPCR analysis was performed to determine the miR-495 expression levels in CAL-62 and SW579 cells transfected with sh-NC, sh-LGMN-1 or sh-LGMN-2. ***P

- Submitted by
- Invitrogen Antibodies (provider)
- Main image
- Experimental details
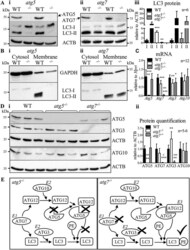
- Figure 1. Abolished ATG3 protein expression but comparable LC3-PE lipidation in thioglycolate-elicited atg7 -/- macrophages. Representative immunoblotting of LC3, ATG5, ATG7, and ss-actin in whole-cell lysates isolated from thioglycolate-elicited WT, ( Ai ) atg5 -/- , and ( Aii ) atg7 -/- peritoneal macrophages. Each lane represents a macrophage sample from an individual mouse. ( Aiii ) Quantification of LC3-I and LC3-II in atg5 -/- , atg7 -/- , and corresponding control macrophages normalized to ACTB/beta-actin (n = 6). Statistics were calculated using Student's t-test (two-tailed) with Welch correction for unequal variances; ** p < 0.01, *** p < 0.001. LC3 protein abundance in cellular fractions of WT, ( Bi ) atg5 -/- , and ( Bii ) atg7 -/- thioglycolate-elicited peritoneal macrophages with GAPDH as loading control. Each lane represents a sample pool from three mice. ( C ) mRNA expression of Atg5, Atg7, Atg3 , and Atg10 in WT, atg5 -/- , and atg7 -/- macrophages relative to Hprt (n = 12). ( Ci ) Representative immunoblotting of (ATG12 - )ATG5, ATG3 (upper blot), and ATG10 (lower blot), using the same samples obtained from three individual mice. ( Dii ) Protein quantification relative to ACTB/beta-actin (n = 5-6). Data represent mean values + SD. Statistics in ( C and Dii ) were calculated using one-way ANOVA with Bonferroni correction; * relative to WT; # atg5 -/- relative to atg7 -/- ; * , # p < 0.05, ** p < 0.01, *** /### p < 0.001. (E) Schematic presentation of the summa
