 Explore
 Validate
 Learn
LearnMIC0101
antibody from Invitrogen Antibodies
Targeting: CEACAM5
CD66e, CEA
 Western blot
 ELISA Immunocytochemistry Immunoprecipitation Flow cytometry Radioimmunoassay Other assay
Antibody data
- Antibody Data
- Antigen structure
- References [2]
- Comments [0]
- Validations
- Western blot [3]
- Immunocytochemistry [2]
- Flow cytometry [1]
- Other assay [7]
Submit
Validation data
Reference
Comment
Report error
- Product number
- MIC0101 - Provider product page

- Provider
- Invitrogen Antibodies
- Product name
- CEA Monoclonal Antibody (1105)
- Antibody type
- Monoclonal
- Antigen
- Purifed from natural sources
- Description
- The predicted MW of CEA is ~77kD, but by Western blot MIC0101 detects CEA with varying degrees of glycosylation at ~77-180kD. MIC0101 was formerly sold as a Seradyn product. Material can be stored for at least 6 months at 2-8°C, or up to 4 years when stored at -20°C.
- Reactivity
- Human
- Host
- Mouse
- Isotype
- IgG
- Antibody clone number
- 1105
- Vial size
- 1 mg
- Concentration
- 2.63 mg/mL
- Storage
- -20° C, Avoid Freeze/Thaw Cycles
Submitted references A Scaffold-Free 3-D Co-Culture Mimics the Major Features of the Reverse Warburg Effect In Vitro.
Development and Evaluation of a Fluorescent Antibody-Drug Conjugate for Molecular Imaging and Targeted Therapy of Pancreatic Cancer.
Keller F, Bruch R, Schneider R, Meier-Hubberten J, Hafner M, Rudolf R
Cells 2020 Aug 13;9(8)
Cells 2020 Aug 13;9(8)
Development and Evaluation of a Fluorescent Antibody-Drug Conjugate for Molecular Imaging and Targeted Therapy of Pancreatic Cancer.
Knutson S, Raja E, Bomgarden R, Nlend M, Chen A, Kalyanasundaram R, Desai S
PloS one 2016;11(6):e0157762
PloS one 2016;11(6):e0157762
No comments: Submit comment
Supportive validation
- Submitted by
- Invitrogen Antibodies (provider)
- Main image

- Experimental details
- Western blot analysis of Carcinoembryonic Antigen (CEA) was performed by loading 20 µg of BxPC-3, HeLa, and HepG2 whole cell lysates per well and 5 µL of PageRuler Plus Prestained Protein Ladder (Product # 26619) onto a 4-20% Tris-Glycine polyacrylamide gel. Proteins were transferred to a nitrocellulose membrane using the G2 Blotter (Product # 62288), and blocked with 5% milk in TBST for 1 hour at room temperature. CEA (with varying degrees of glycosylation) was detected at ~77-180 kD using a CEA monoclonal antibody (Product # MIC0101) at a dilution of 1 µg/mL in 5% milk in TBST overnight at 4C on a rocking platform, followed by a goat anti-mouse IgG-HRP secondary antibody (Product # 31430) at a dilution of 1:10,000 for at least 30 minutes at room temperature. Chemiluminescent detection was performed using SuperSignal West Pico substrate (Product # 34080).

- Submitted by
- Invitrogen Antibodies (provider)
- Main image

- Experimental details
- Western blot was performed using Anti-CEA Monoclonal Antibody (1105) (Product # MIC0101) and a 160 kDa band corresponding to Carcinoembryonic antigen-related cell adhesion molecule 5 was observed across cell lines tested. Membrane enriched extracts (30 µg lysate) of MCF7 (Lane 1), HCT 116 (Lane 2), SW480 (Lane 3), HT-29 (Lane 4), HT-29 treated with IL-6, 100 ng/mL, 48Hrs.(Lane 5), MDA-MB-231 (Lane 6) were electrophoresed using NuPAGE™ 10% Bis-Tris Protein Gel (Product # NP0301BOX). Resolved proteins were then transferred onto a Nitrocellulose membrane (Product # IB23001) by iBlot® 2 Dry Blotting System (Product # IB21001). The blot was probed with the primary antibody (1:1000 Dilution) and detected by chemiluminescence with Goat anti-Mouse IgG (H+L) Superclonal™ Recombinant Secondary Antibody, HRP (Product # A28177, 1:4000 dilution) using the iBright FL 1000 (Product # A32752). Chemiluminescent detection was performed using Novex® ECL Chemiluminescent Substrate Reagent Kit (Product # WP20005).Relative expression of Carcinoembryonic antigen-related cell adhesion molecule 5 was observed higher in MCF-7,HT29 as compared to HCT 116, SW480 and MDA-MB-231.Also, CEACAM5 found to be up regulated upon IL-6 treatment in HT-29 cell line.

Supportive validation
- Submitted by
- Invitrogen Antibodies (provider)
- Main image

- Experimental details
- Immunofluorescent analysis of Carcinoembryonic Antigen (CEA, green) in BxPC-3 cells. Cells were fixed with 4% paraformaldehyde, permeabilized with 0.1% Triton X-100, and blocked with 0.3% BSA in PBS, each for 15 minutes at room temperature. Cells were stained with a CEA monoclonal antibody (Product # MIC0101) at a dilution of 10 µg/mL in blocking buffer for 1 hour at room temperature, and then incubated with a goat anti-mouse IgG Superclonal™ secondary antibody, Alexa Fluor® 488 conjugate (Product # A28175) at a dilution of 1:1000 for 1 hour at room temperature. Nuclei (blue) were stained with Hoechst nuclear stain. Images were taken on a Thermo Scientific ToxInsight Instrument at 20X magnification.

- Submitted by
- Invitrogen Antibodies (provider)
- Main image

- Experimental details
- Immunofluorescence analysis of Carcinoembryonic antigen-related cell adhesion molecule 5 was performed using 70% confluent log phase HT-29 cells. The cells were fixed with 4% paraformaldehyde for 10 minutes, permeabilized with 0.1% Triton™ X-100 for 15 minutes, and blocked with 2% BSA for 45 minutes at room temperature. The cells were labeled with CEA Monoclonal Antibody (1105) (Product # MIC0101) at 5 µg/mL in 0.1% BSA, incubated at 4 degree celsius overnight and then labeled with Goat anti-Mouse IgG (H+L) Superclonal™ Recombinant Secondary Antibody, Alexa Fluor® 488 conjugate (Product # A28175), (1:2000 dilution), for 45 minutes at room temperature (Panel a: Green). Nuclei (Panel b:Blue) were stained with ProLong™ Diamond Antifade Mountant with DAPI (Product # P36962). F-actin (Panel c: Red) was stained with Rhodamine Phalloidin (Product # R415, 1:300 dilution). Panel d represents the merged image showing Plasma Membrane localization. Panel e represents control cells with no primary antibody to assess background. The images were captured at 60x magnification.

Supportive validation
- Submitted by
- Invitrogen Antibodies (provider)
- Main image
- Experimental details
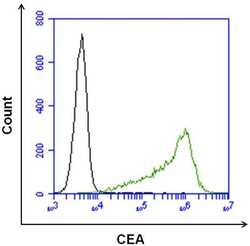
- Flow cytometry analysis of Carcinoembryonic Antigen (CEA) on BxPC-3 cells. Cells were harvested with 0.25% Trypsin-EDTA and stained with a CEA monoclonal antibody (Product # MIC0101) at a dilution of 10 µg/mL (pink histogram), or with a mouse isotype control (black histogram) at a dilution of 10 µg/mL in 5% FCS in PBS. After incubation of the primary antibody for 1 hour on ice, the cells were stained with a goat anti-mouse IgG secondary antibody, DyLight 488 conjugate (Product # 35502) at a dilution of 1:40 for 1 hour on ice. A representative 10,000 cells were acquired for each sample.

Supportive validation
- Submitted by
- Invitrogen Antibodies (provider)
- Main image

- Experimental details
- NULL

- Submitted by
- Invitrogen Antibodies (provider)
- Main image

- Experimental details
- NULL

- Submitted by
- Invitrogen Antibodies (provider)
- Main image

- Experimental details
- NULL

- Submitted by
- Invitrogen Antibodies (provider)
- Main image

- Experimental details
- Figure 4 Growth of HT-29 spheroids is unaffected in the presence of CCD-1137Sk cells. Human HT-29 or CCD-1137Sk cells were seeded into ultra-low attachment plates to form spheroids, following different seeding orders (mixed, HT-29 first or CCD-1137Sk first) and cell numbers (ranging from 2000 to 6000 cells per type) as indicated. From 0 to 30 days in culture, brightfield images were taken to perform spheroid-size analysis based on the mean diameter ( A-B ). Additionally, co-culture spheroids with 250 HT-29 cells together with simultaneously seeded 500 CCD-1137Sk cells were fixed after four days and stained with DAPI as well as with anti-CEA and anti-Coll4 antibodies as markers for nuclei, HT-29 cells, and fibroblasts, respectively ( C ). ( A ) Representative brightfield images of HT-29 and CCD-1137Sk mono- and co-culture spheroids seeded in different ratios and orders, as depicted. ( B ) Graph shows a quantitative analysis of the mean diameters of mono- and co-culture spheroids at different time-points as indicated. Mean + SEM ( n = 5-9 experiments). ( C ) Representative optical slice of DAPI (blue), anti-CEA (green), and anti-Coll4 signals (red). Arrowheads, exemplary clusters of Coll4-positive areas. Bottom right panel shows an overlay image of all three channels.

- Submitted by
- Invitrogen Antibodies (provider)
- Main image

- Experimental details
- Figure 6 DAPI, CEA, and Coll4 staining jointly discriminate HT-29 and CCD-1137Sk cell populations in 3-D Dynarray co-cultures. A total of 4000 cells per chip cavity were seeded to yield either mono- or co-cultures of HT-29 and CCD-1137Sk cells. In case of co-cultures, 2000 HT-29 cells were co-seeded with 2000 CCD-1137Sk cells per well. After four days, chips were fixed, cleared, and stained with DAPI and antibodies against CEA and Coll4 as markers for nuclei, cancer cells, and fibroblasts, respectively. Subsequently, samples were imaged with 3-Dconfocal microscopy. ( A ) Representative sum-z projections. ( B ) Scatter plots showing the anti-Coll4 intensity distribution as a function of the anti-CEA intensity for HT-29 mono-cultures (left), HT-29 + CCD-1137Sk co-cultures (middle), and CCD-1137Sk mono-cultures (right). Each dot shows the average intensity of voxel cubes in a total of five Dynarray cavities. Red vertical line, CEA brightness range that contains 95% of all CCD-1137Sk voxel cubes in mono-culture. ( C ) Exemplary images showing the voxel-cube grid used for the quantification of the average fluorescence intensities. Upper panel, raw sum-z projection of DAPI signal; lower panel, sum-z projection upon nuclei segmentation and background subtraction.

- Submitted by
- Invitrogen Antibodies (provider)
- Main image

- Experimental details
- Figure 7 The expression of relevant metabolic marker proteins is altered upon co-culturing of HT-29 and CCD-1137Sk cells in Dynarrays. A total of 4000 cells per chip cavity were seeded to yield either mono- or co-cultures of HT-29 and CCD-1137Sk cells. In the case of co-cultures, 2000 HT-29 cells were co-seeded with 2000 CCD-1137Sk cells per well. After four days, chips were fixed, cleared, and stained with DAPI and antibodies against CEA as well as HK-2, LDH, TIGAR, or TOMM20 as markers for nuclei, cancer cells, and different metabolic activities, respectively. Then, samples were imaged with 3-D confocal microscopy. ( A ) Representative sum-z projections. ( B - E ) Scatter plots showing the fluorescence intensity distributions of anti-HK-2 ( B ), anti-LDH ( C ), anti-TIGAR ( D ), or anti-TOMM20 ( E ) as a function of the anti-CEA intensity for HT-29 mono-cultures (left), HT-29 + CCD-1137Sk co-cultures (middle), and CCD-1137Sk mono-cultures (right). Each dot shows the average intensity of a voxel cube in a total of five Dynarray cavities. Red vertical line, CEA brightness range that contains 95% of all CCD-1137Sk voxel cubes in mono-culture.

- Submitted by
- Invitrogen Antibodies (provider)
- Main image

- Experimental details
- Figure 8 Co-culturing of HT-29 and CCD-1137Sk cells in Dynarrays leads to a rise of autophagic markers. A total of 4000 cells per chip cavity were seeded to yield either mono- or co-cultures of HT-29 and CCD-1137Sk cells. In the case of co-cultures, 2000 HT-29 cells were co-seeded with 2000 CCD-1137Sk cells per well. After four days, chips were fixed, cleared, and stained with DAPI and antibodies against CEA as well as LC3 or P62 as markers for nuclei, cancer cells, and autophagy, respectively. Then, samples were imaged with 3-D confocal microscopy. ( A ) Representative sum-z projections. ( B , C ) Scatter plots showing fluorescence intensity distributions of anti-LC3 ( B ) or anti-P62 signals ( C ) as a function of anti-CEA intensity for HT-29 mono-cultures (left), HT-29 + CCD-1137Sk co-cultures (middle), and CCD-1137Sk mono-cultures (right). Each dot shows the average intensity of a voxel cube of a total of five Dynarray cavities. Red vertical line, CEA brightness range that contains 95 % of all CCD-1137Sk voxel cubes in mono-culture. ( D ) LC3/P62 fluorescence intensity per um 3 . Mean + SEM ( n = 5 experiments).
