Explore
 Validate
 Learn
Learn Western blot
Antibody data
- Antibody Data
- Antigen structure
- References [26]
- Comments [0]
- Validations
- Western blot [2]
- Immunocytochemistry [1]
- Immunohistochemistry [1]
- Other assay [19]
Submit
Validation data
Reference
Comment
Report error
- Product number
- PA1-10004 - Provider product page

- Provider
- Invitrogen Antibodies
- Product name
- GFAP Polyclonal Antibody
- Antibody type
- Polyclonal
- Antigen
- Purifed from natural sources
- Description
- PA1-10004 was made against full length human recombinant GFAP, and works well on western blots, and on immunostaining of cell culture or tissue sections. This product is supplied as an IgY prep and is not a pure antibody, therefore concentration is not determined. Dilutions are to be determined by the end user.
- Reactivity
- Human, Mouse, Rat, Bovine, Porcine
- Host
- Chicken/Avian
- Isotype
- IgY
- Vial size
- 100 µL
- Concentration
- Conc. not determined
- Storage
- 4° C
Submitted references Acute and Delayed Effects of Mechanical Injury on Calcium Homeostasis and Mitochondrial Potential of Primary Neuroglial Cell Culture: Potential Causal Contributions to Post-Traumatic Syndrome.
Toll-like receptors 2 and 4 differentially regulate the self-renewal and differentiation of spinal cord neural precursor cells.
LILRB2-mediated TREM2 signaling inhibition suppresses microglia functions.
4,8-dicarboxyl-8,9-iridoid-1-glycoside Promotes Neural Stem Cell Differentiation Through MeCP2.
Precise control of embolic stroke with magnetized red blood cells in mice.
Ultrastructural Analysis of Neuroimplant-Parenchyma Interfaces Uncover Remarkable Neuroregeneration Along-With Barriers That Limit the Implant Electrophysiological Functions.
Inflammatory Foreign Body Response Induced by Neuro-Implants in Rat Cortices Depleted of Resident Microglia by a CSF1R Inhibitor and Its Implications.
Sex differences in the expression of the endocannabinoid system within V1M cortex and PAG of Sprague Dawley rats.
Human-Induced Neural and Mesenchymal Stem Cell Therapy Combined with a Curcumin Nanoconjugate as a Spinal Cord Injury Treatment.
AEG-1 Regulates TWIK-1 Expression as an RNA-Binding Protein in Astrocytes.
Immunohistological and Ultrastructural Study of the Inflammatory Response to Perforated Polyimide Cortical Implants: Mechanisms Underlying Deterioration of Electrophysiological Recording Quality.
Meningeal Lymphangiogenesis and Enhanced Glymphatic Activity in Mice with Chronically Implanted EEG Electrodes.
Erythrocytic α-synuclein contained in microvesicles regulates astrocytic glutamate homeostasis: a new perspective on Parkinson's disease pathogenesis.
Astrocyte Infection during Rabies Encephalitis Depends on the Virus Strain and Infection Route as Demonstrated by Novel Quantitative 3D Analysis of Cell Tropism.
Optogenetic Modulation of Neural Progenitor Cells Improves Neuroregenerative Potential.
Organized Neurogenic-Niche-Like Pinwheel Structures Discovered in Spinal Cord Tissue-Derived Neurospheres.
Implication of Melanopsin and Trigeminal Neural Pathways in Blue Light Photosensitivity in vivo.
CYP46A1 Activation by Efavirenz Leads to Behavioral Improvement without Significant Changes in Amyloid Plaque Load in the Brain of 5XFAD Mice.
Neutrophil extracellular traps in the central nervous system hinder bacterial clearance during pneumococcal meningitis.
Voluntary running enhances glymphatic influx in awake behaving, young mice.
Mechanisms that minimize retinal impact of apolipoprotein E absence.
Pericytes of Multiple Organs Do Not Behave as Mesenchymal Stem Cells In Vivo.
The astrocytic response to the dopaminergic denervation of the striatum.
PI3K/AKT pathway regulates E-cadherin and Desmoglein 2 in aggressive prostate cancer.
Localization and behaviors in null mice suggest that ASIC1 and ASIC2 modulate responses to aversive stimuli.
Intranasal delivery of caspase-9 inhibitor reduces caspase-6-dependent axon/neuron loss and improves neurological function after stroke.
Bakaeva Z, Goncharov M, Krasilnikova I, Zgodova A, Frolov D, Grebenik E, Timashev P, Pinelis V, Surin A
International journal of molecular sciences 2022 Mar 31;23(7)
International journal of molecular sciences 2022 Mar 31;23(7)
Toll-like receptors 2 and 4 differentially regulate the self-renewal and differentiation of spinal cord neural precursor cells.
Sanchez-Petidier M, Guerri C, Moreno-Manzano V
Stem cell research & therapy 2022 Mar 21;13(1):117
Stem cell research & therapy 2022 Mar 21;13(1):117
LILRB2-mediated TREM2 signaling inhibition suppresses microglia functions.
Zhao P, Xu Y, Jiang LL, Fan X, Ku Z, Li L, Liu X, Deng M, Arase H, Zhu JJ, Huang TY, Zhao Y, Zhang C, Xu H, Tong Q, Zhang N, An Z
Molecular neurodegeneration 2022 Jun 18;17(1):44
Molecular neurodegeneration 2022 Jun 18;17(1):44
4,8-dicarboxyl-8,9-iridoid-1-glycoside Promotes Neural Stem Cell Differentiation Through MeCP2.
Wang W, Liu Z, Jing B, Mai H, Jiao H, Guan T, Chen D, Kong J, Pan T
Dose-response : a publication of International Hormesis Society 2022 Jul-Sep;20(3):15593258221112959
Dose-response : a publication of International Hormesis Society 2022 Jul-Sep;20(3):15593258221112959
Precise control of embolic stroke with magnetized red blood cells in mice.
Jin Y, Shi P, Wang Y, Li J, Zhang J, Zhao X, Ge Y, Huang Y, Guo M, Wang F, Ci B, Xiao X, Gao X, Xu J, Dang B, Ji B, Ge WP, Jia JM
Communications biology 2022 Feb 16;5(1):136
Communications biology 2022 Feb 16;5(1):136
Ultrastructural Analysis of Neuroimplant-Parenchyma Interfaces Uncover Remarkable Neuroregeneration Along-With Barriers That Limit the Implant Electrophysiological Functions.
Sharon A, Shmoel N, Erez H, Jankowski MM, Friedmann Y, Spira ME
Frontiers in neuroscience 2021;15:764448
Frontiers in neuroscience 2021;15:764448
Inflammatory Foreign Body Response Induced by Neuro-Implants in Rat Cortices Depleted of Resident Microglia by a CSF1R Inhibitor and Its Implications.
Sharon A, Jankowski MM, Shmoel N, Erez H, Spira ME
Frontiers in neuroscience 2021;15:646914
Frontiers in neuroscience 2021;15:646914
Sex differences in the expression of the endocannabinoid system within V1M cortex and PAG of Sprague Dawley rats.
Levine A, Liktor-Busa E, Lipinski AA, Couture S, Balasubramanian S, Aicher SA, Langlais PR, Vanderah TW, Largent-Milnes TM
Biology of sex differences 2021 Nov 8;12(1):60
Biology of sex differences 2021 Nov 8;12(1):60
Human-Induced Neural and Mesenchymal Stem Cell Therapy Combined with a Curcumin Nanoconjugate as a Spinal Cord Injury Treatment.
Bonilla P, Hernandez J, Giraldo E, González-Pérez MA, Alastrue-Agudo A, Elkhenany H, Vicent MJ, Navarro X, Edel M, Moreno-Manzano V
International journal of molecular sciences 2021 May 31;22(11)
International journal of molecular sciences 2021 May 31;22(11)
AEG-1 Regulates TWIK-1 Expression as an RNA-Binding Protein in Astrocytes.
Jung HG, Kim A, Kim SC, Park JY, Hwang EM
Brain sciences 2021 Jan 11;11(1)
Brain sciences 2021 Jan 11;11(1)
Immunohistological and Ultrastructural Study of the Inflammatory Response to Perforated Polyimide Cortical Implants: Mechanisms Underlying Deterioration of Electrophysiological Recording Quality.
Huang SH, Shmoel N, Jankowski MM, Erez H, Sharon A, Abu-Salah W, Nelken I, Weiss A, Spira ME
Frontiers in neuroscience 2020;14:926
Frontiers in neuroscience 2020;14:926
Meningeal Lymphangiogenesis and Enhanced Glymphatic Activity in Mice with Chronically Implanted EEG Electrodes.
Hauglund NL, Kusk P, Kornum BR, Nedergaard M
The Journal of neuroscience : the official journal of the Society for Neuroscience 2020 Mar 11;40(11):2371-2380
The Journal of neuroscience : the official journal of the Society for Neuroscience 2020 Mar 11;40(11):2371-2380
Erythrocytic α-synuclein contained in microvesicles regulates astrocytic glutamate homeostasis: a new perspective on Parkinson's disease pathogenesis.
Sheng L, Stewart T, Yang D, Thorland E, Soltys D, Aro P, Khrisat T, Xie Z, Li N, Liu Z, Tian C, Bercow M, Matsumoto J, Zabetian CP, Peskind E, Quinn JF, Shi M, Zhang J
Acta neuropathologica communications 2020 Jul 8;8(1):102
Acta neuropathologica communications 2020 Jul 8;8(1):102
Astrocyte Infection during Rabies Encephalitis Depends on the Virus Strain and Infection Route as Demonstrated by Novel Quantitative 3D Analysis of Cell Tropism.
Potratz M, Zaeck L, Christen M, Te Kamp V, Klein A, Nolden T, Freuling CM, Müller T, Finke S
Cells 2020 Feb 11;9(2)
Cells 2020 Feb 11;9(2)
Optogenetic Modulation of Neural Progenitor Cells Improves Neuroregenerative Potential.
Giraldo E, Palmero-Canton D, Martinez-Rojas B, Sanchez-Martin MDM, Moreno-Manzano V
International journal of molecular sciences 2020 Dec 31;22(1)
International journal of molecular sciences 2020 Dec 31;22(1)
Organized Neurogenic-Niche-Like Pinwheel Structures Discovered in Spinal Cord Tissue-Derived Neurospheres.
Rodriguez-Jimenez FJ, Clemente E, Moreno-Manzano V, Erceg S
Frontiers in cell and developmental biology 2019;7:334
Frontiers in cell and developmental biology 2019;7:334
Implication of Melanopsin and Trigeminal Neural Pathways in Blue Light Photosensitivity in vivo.
Marek V, Reboussin E, Dégardin-Chicaud J, Charbonnier A, Domínguez-López A, Villette T, Denoyer A, Baudouin C, Réaux-Le Goazigo A, Mélik Parsadaniantz S
Frontiers in neuroscience 2019;13:497
Frontiers in neuroscience 2019;13:497
CYP46A1 Activation by Efavirenz Leads to Behavioral Improvement without Significant Changes in Amyloid Plaque Load in the Brain of 5XFAD Mice.
Petrov AM, Lam M, Mast N, Moon J, Li Y, Maxfield E, Pikuleva IA
Neurotherapeutics : the journal of the American Society for Experimental NeuroTherapeutics 2019 Jul;16(3):710-724
Neurotherapeutics : the journal of the American Society for Experimental NeuroTherapeutics 2019 Jul;16(3):710-724
Neutrophil extracellular traps in the central nervous system hinder bacterial clearance during pneumococcal meningitis.
Mohanty T, Fisher J, Bakochi A, Neumann A, Cardoso JFP, Karlsson CAQ, Pavan C, Lundgaard I, Nilson B, Reinstrup P, Bonnevier J, Cederberg D, Malmström J, Bentzer P, Linder A
Nature communications 2019 Apr 10;10(1):1667
Nature communications 2019 Apr 10;10(1):1667
Voluntary running enhances glymphatic influx in awake behaving, young mice.
von Holstein-Rathlou S, Petersen NC, Nedergaard M
Neuroscience letters 2018 Jan 1;662:253-258
Neuroscience letters 2018 Jan 1;662:253-258
Mechanisms that minimize retinal impact of apolipoprotein E absence.
Saadane A, Petrov A, Mast N, El-Darzi N, Dao T, Alnemri A, Song Y, Dunaief JL, Pikuleva IA
Journal of lipid research 2018 Dec;59(12):2368-2382
Journal of lipid research 2018 Dec;59(12):2368-2382
Pericytes of Multiple Organs Do Not Behave as Mesenchymal Stem Cells In Vivo.
Guimarães-Camboa N, Cattaneo P, Sun Y, Moore-Morris T, Gu Y, Dalton ND, Rockenstein E, Masliah E, Peterson KL, Stallcup WB, Chen J, Evans SM
Cell stem cell 2017 Mar 2;20(3):345-359.e5
Cell stem cell 2017 Mar 2;20(3):345-359.e5
The astrocytic response to the dopaminergic denervation of the striatum.
Morales I, Sanchez A, Rodriguez-Sabate C, Rodriguez M
Journal of neurochemistry 2016 Oct;139(1):81-95
Journal of neurochemistry 2016 Oct;139(1):81-95
PI3K/AKT pathway regulates E-cadherin and Desmoglein 2 in aggressive prostate cancer.
Barber AG, Castillo-Martin M, Bonal DM, Jia AJ, Rybicki BA, Christiano AM, Cordon-Cardo C
Cancer medicine 2015 Aug;4(8):1258-71
Cancer medicine 2015 Aug;4(8):1258-71
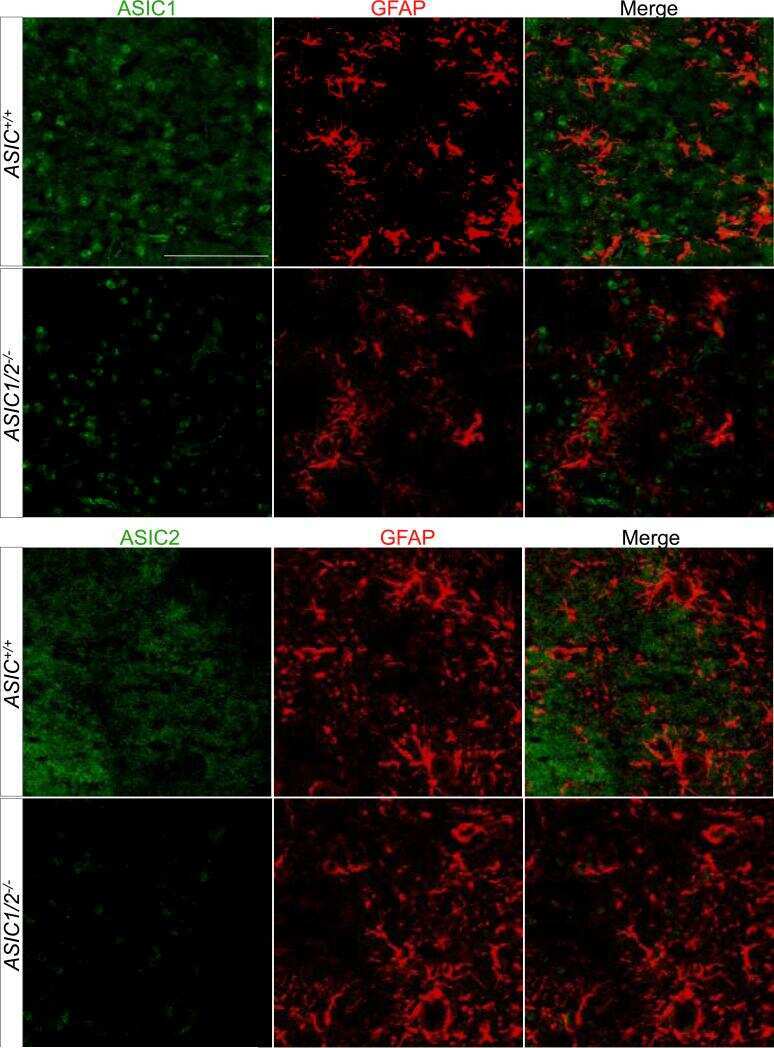
Localization and behaviors in null mice suggest that ASIC1 and ASIC2 modulate responses to aversive stimuli.
Price MP, Gong H, Parsons MG, Kundert JR, Reznikov LR, Bernardinelli L, Chaloner K, Buchanan GF, Wemmie JA, Richerson GB, Cassell MD, Welsh MJ
Genes, brain, and behavior 2014 Feb;13(2):179-94
Genes, brain, and behavior 2014 Feb;13(2):179-94
Intranasal delivery of caspase-9 inhibitor reduces caspase-6-dependent axon/neuron loss and improves neurological function after stroke.
Akpan N, Serrano-Saiz E, Zacharia BE, Otten ML, Ducruet AF, Snipas SJ, Liu W, Velloza J, Cohen G, Sosunov SA, Frey WH 2nd, Salvesen GS, Connolly ES Jr, Troy CM
The Journal of neuroscience : the official journal of the Society for Neuroscience 2011 Jun 15;31(24):8894-904
The Journal of neuroscience : the official journal of the Society for Neuroscience 2011 Jun 15;31(24):8894-904
No comments: Submit comment
Supportive validation
- Submitted by
- Invitrogen Antibodies (provider)
- Main image

- Experimental details
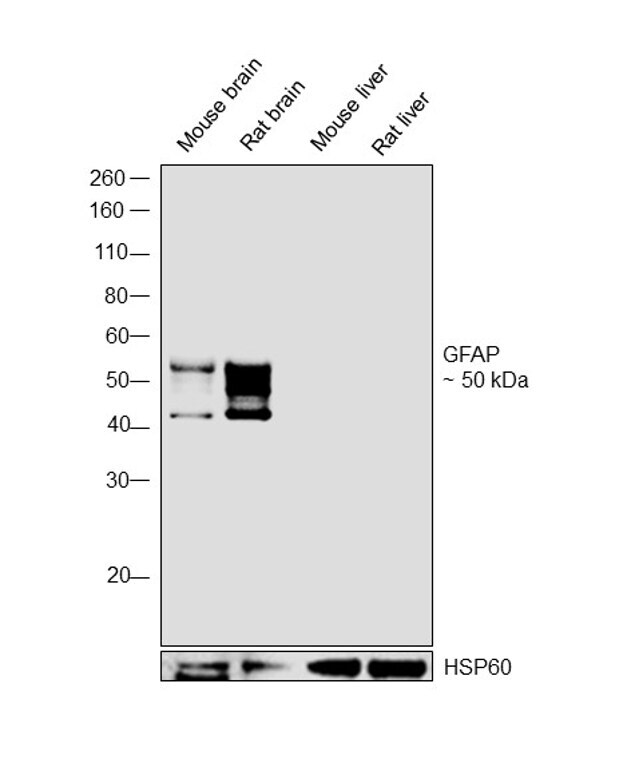
- Western blot was performed using Anti-GFAP Chicken Polyclonal Antibody (Product # PA1-10004) and a 50 kDa band corresponding to GFAP was observed across tissues tested except Mouse and Rat liver. Whole cell extracts (30 µg lysate) of Mouse brain (Lane 1), Rat brain (Lane 2), Mouse liver (Lane 3) and Rat liver (Lane 4) were electrophoresed using Novex® NuPAGE® 4-12 % Bis-Tris gel (Product # NP0321BOX). Resolved proteins were then transferred onto a nitrocellulose membrane (Product # IB23001) by iBlot® 2 Dry Blotting System (Product # IB21001). The blot was probed with the primary antibody (1:5000 dilution) and detected by chemiluminescence Goat anti-Chicken IgY (H+L) Secondary Antibody, HRP (Product # A16054, 1:4000 dilution) using the iBright FL 1000 (Product # A32752). Chemiluminescent detection was performed using Novex® ECL Chemiluminescent Substrate Reagent Kit (Product # WP20005).
- Submitted by
- Invitrogen Antibodies (provider)
- Main image
- Experimental details
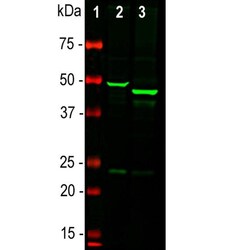
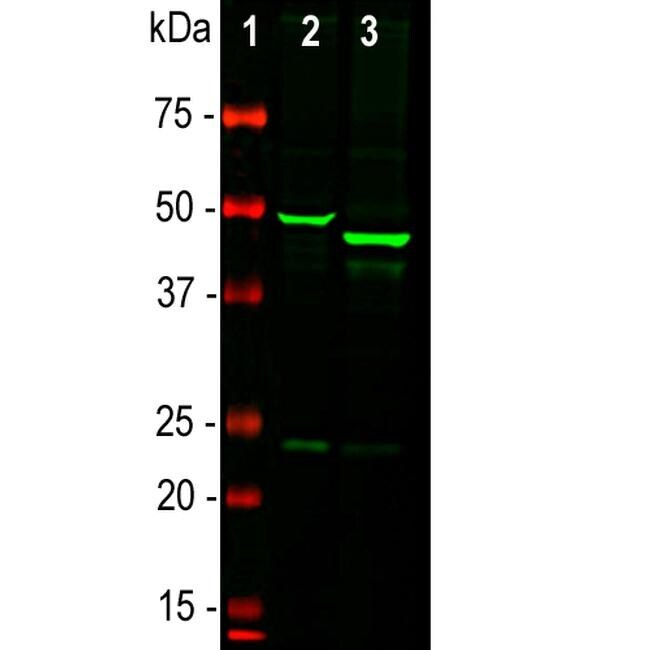
- Western blot analysis of GFAP in whole brain lysates using a GFAP polyclonal antibody to GFAP (Product # PA1-10004) at a dilution of 1:5,000 as seen in green. 1) protein standard (red), 2) rat brain, 3) mouse brain. The strong band at about 50 kDa corresponds to the GFAP protein. Smaller proteolytic fragments and alternate transcripts of GFAP may also be detected on such blots.
Supportive validation
- Submitted by
- Invitrogen Antibodies (provider)
- Main image

- Experimental details
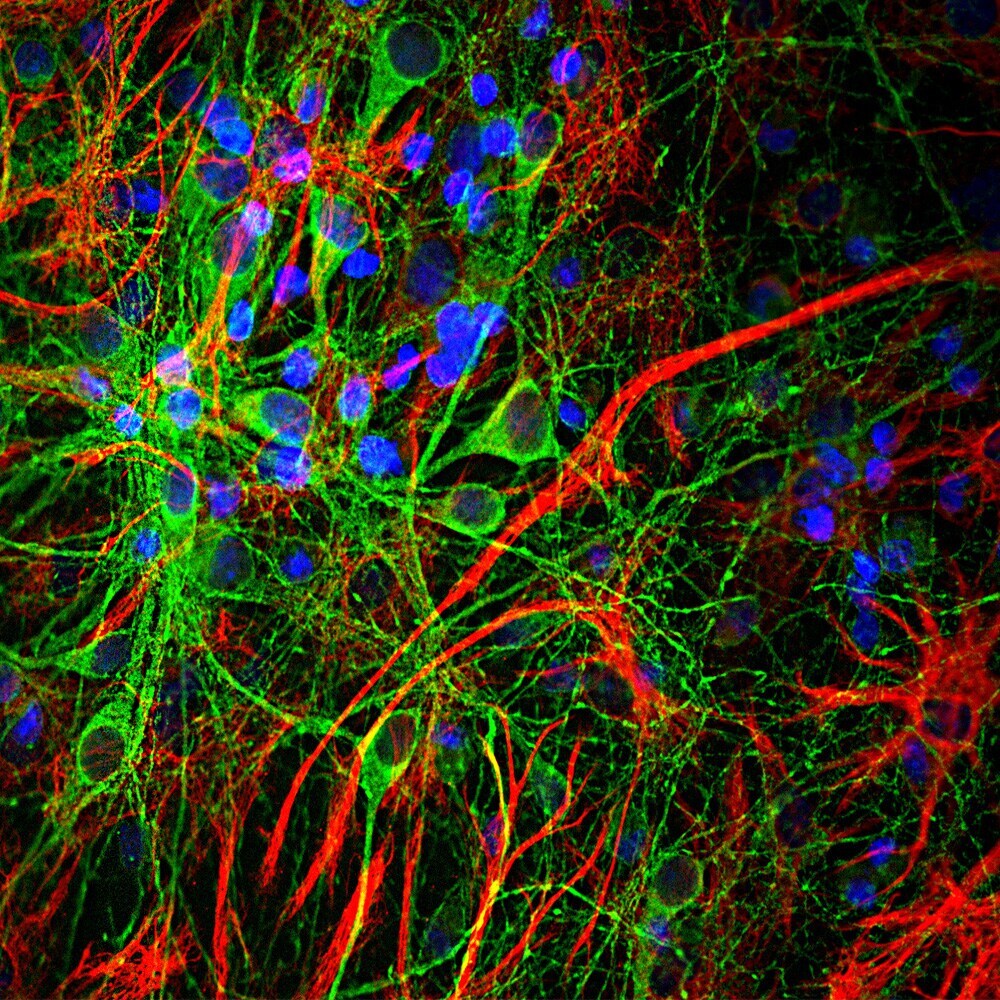
- Immunofluorescent analysis of GFAP cortical neuron-glial cell culture from E20 rat costained with Glial Fibrillary Acidic Protein-GFAP polyclonal antibody (Product # PA1-10004, dilution 1:2,000 in red) and mouse mAb to MAP-τ (tau), dilution 1:2,000 in green. The blue is DAPI staining of nuclear DNA. The GFAP labels astroglial cells, while the MAP-τ antibody stains neuronal cell perikarya, dendrites and axons.
Supportive validation
- Submitted by
- Invitrogen Antibodies (provider)
- Main image

- Experimental details
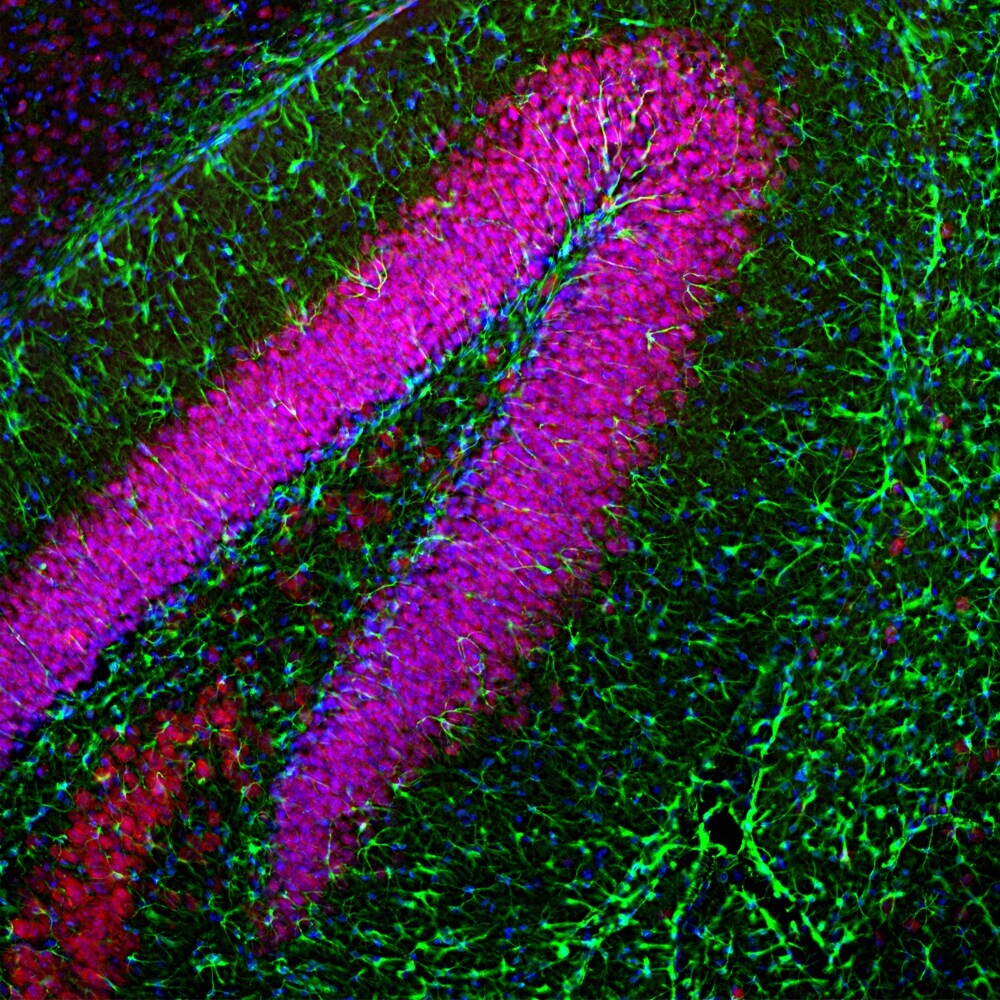
- Immunofluorescent analysis of GFAP in a mouse hippocampus. The mouse brain section was obtained following transcardial perfusion of the mouse with 4% paraformaldehyde, brain was post fixed for 24 hours, and cut to 45µM. Free-floating sections were stained with a GFAP polyclonal antibody (Product # PA1-10004) at a dilution of 1:5,000 as seen in green, and costained with a NeuN/FOX3 polyclonal antibody at a dilution of 1:5,000 as seen in red, and with DAPI staining the nuclear DNA in blue. The GFAP antibody stains a network of astroglial cells while the Fox3/NeuN antibody stains the nuclei and proximal perikarya of neurons.
Supportive validation
- Submitted by
- Invitrogen Antibodies (provider)
- Main image
- Experimental details
- NULL
- Submitted by
- Invitrogen Antibodies (provider)
- Main image
- Experimental details
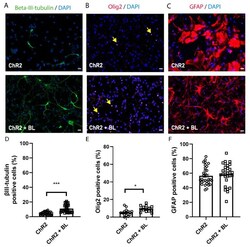
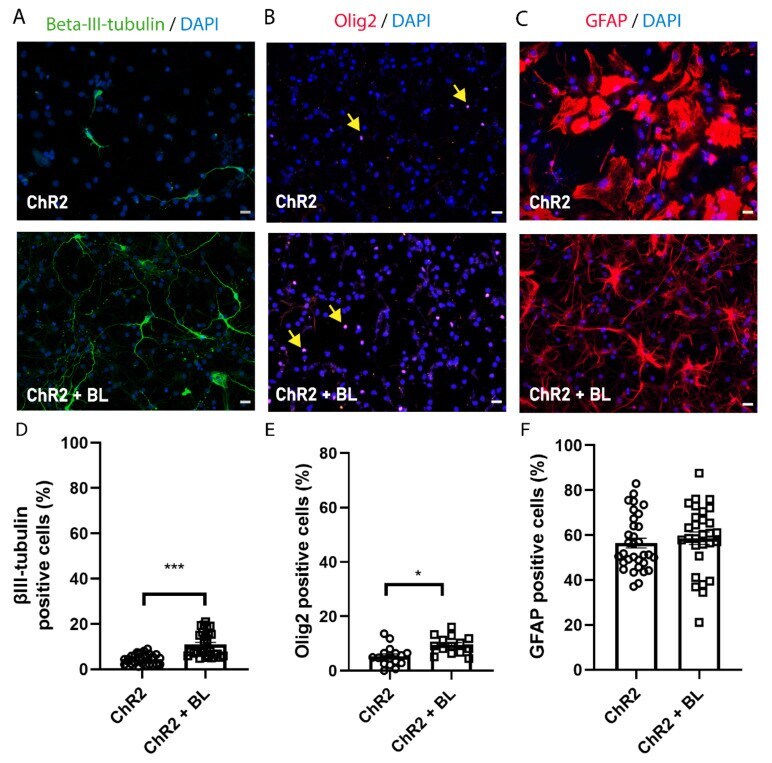
- Figure 3 Optogenetic stimulation enhances neuronal and oligodendrocytic but not astrocytic differentiation of NPCs. ChR2-NPCs were differentiated for seven days. ( A - C ) Representative images of immunofluorescence staining for beta-III-tubulin (green; A), oligodendrocyte transcription factor 2 (Olig2) (red; nuclear signal indicated with yellow arrows; B), and glial fibrillary acidic protein (GFAP) (red; C) for unstimulated (ChR2) and BL-stimulated ChR2-NPCs (ChR2 + BL). ( D ) Quantification of the percentage of neurons (beta-III-tubulin-positive cells). Data are expressed as mean +- SEM from three independent experiments (ChR2: 4.5 +- 0.4; ChR2 + BL: 10.9 +- 1) *** p < 0.001 vs. ChR2 determined by Mann-Whitney test. ( E ) Quantification of the percentage of oligodendrocytes (Olig2-positive cells). Data are expressed as mean +- SEM from three independent experiments (ChR2: 5.3 +- 0.9; ChR2 + BL: 9.5 +- 0.9) * p < 0.05, unpaired t -test. ( F ) Quantification of the percentage of astrocytes (GFAP-positive cells). Data are expressed as mean +- SEM from three independent experiments (ChR2: 56.47 +- 2.2; ChR2 + BL: 58.65 +- 2.7). Scale bars, 20 uM.
- Submitted by
- Invitrogen Antibodies (provider)
- Main image
- Experimental details
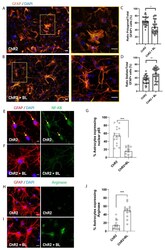
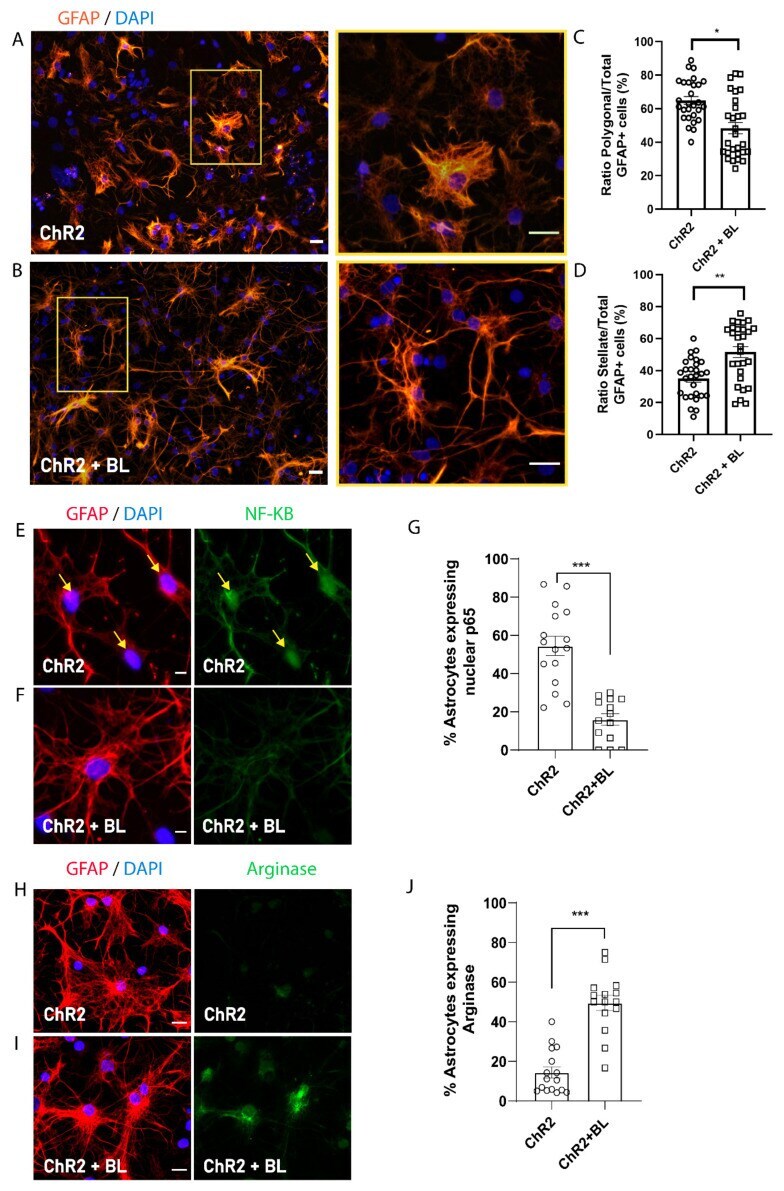
- Figure 4 Optogenetic stimulation triggers morphological and functional shift in ChR2-NPC-derived astrocytes. Astrocyte morphology was determined after GFAP staining. ( A ) Representative images of immunofluorescence staining for GFAP (orange) and nuclear detection by 4',6-diamidino-2-phenylindole (DAPI) (blue) in unstimulated ChR2-NPCs (ChR2). Yellow square shows higher magnification for polygonal astrocytes. Scale bars, 20 uM. ( B ) Representative images of immunofluorescence staining for GFAP (orange) and nuclear detection by DAPI (blue) in BL-stimulated ChR2-NPCs (ChR2 + BL). Yellow square shows higher magnification for stellate astrocyte. Scale bars, 20 uM. ( C ) Quantification of the ratio of polygonal astrocytes in unstimulated (ChR2) and BL-stimulated ChR2-NPCs (ChR2 + BL) cultures. Data are expressed as mean +- SEM from three independent experiments (ChR2: 64.9 +- 2.3; ChR2 + BL: 48.4 +- 3.4). * p < 0.05 vs. ChR2 determined by unpaired t -test. ( D ) Quantification of the ratio of stellate astrocytes in unstimulated (ChR2) and BL-stimulated ChR2-NPCs (ChR2 + BL) cultures. Data are expressed as mean +- SEM from three independent experiments (ChR2: 35.1 +- 2.3; ChR2 + BL: 51.6 +- 3.4). ** p < 0.01 vs. ChR2 determined by unpaired t -test. ( E ) Representative images of immunofluorescence staining for GFAP (red), nuclear factor-kappa B (NF-kB) (green), and nuclear detection by DAPI (blue) in unstimulated ChR2-NPCs (ChR2). Yellow arrows show nuclear staining. Scale bars, 1
- Submitted by
- Invitrogen Antibodies (provider)
- Main image
- Experimental details
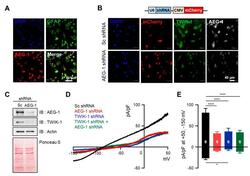
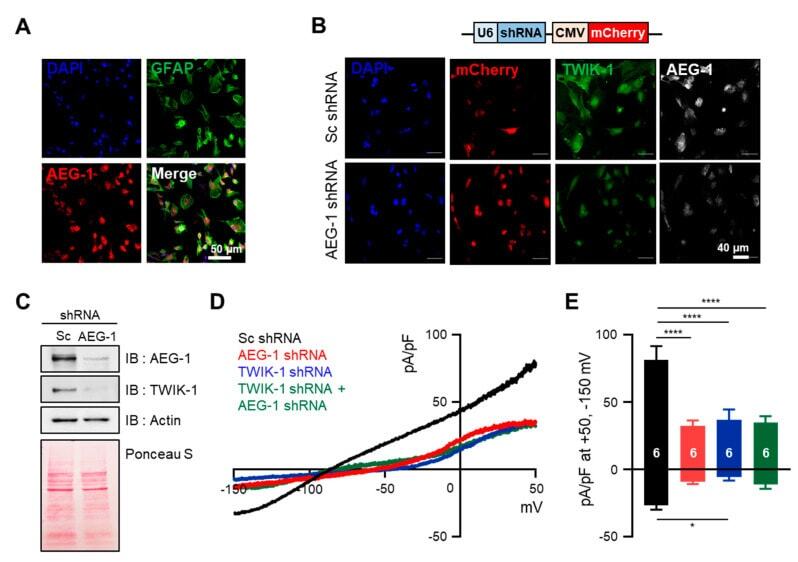
- Figure 2 AEG-1 knockdown reduces TWIK-1 protein levels and TWIK-1-mediated potassium currents in primary cultured astrocytes. ( A ) Immunofluorescence staining of cultured astrocytes using AEG-1 and GFAP, an astrocyte marker. ( B ) Immunofluorescence staining of TWIK-1 and AEG-1 in transfected astrocyte. Knockdown of the AEG-1 inhibits the levels of TWIK-1. Scale bar, 40 mum. The shRNA vector contains a shRNA sequence under the control of U6 promoter, with mCherry co-expression under a CMV promoter. ( C ) Knockdown of the AEG-1 in primary cultured astrocytes. Immunoblot data show the decreased AEG-1 and TWIK-1 expression. ( D ) Representative whole-cell I-V curves of astrocytes overexpressing Sc shRNA (black), AEG-1 shRNA (red), TWIK-1 shRNA (blue), and AEG-1 and TWIK-1 shRNAs (green). ( E ) Pooled data for whole-cell current amplitudes in AEG-1 knockdown, TWIK-1 knockdown, and AEG-1 and TWIK-1 double knockdown astrocytes. All values are presented as mean +- SEM. * p < 0.05, **** p < 0.0001. Two-way ANOVA followed by the Tukey's post hoc.
- Submitted by
- Invitrogen Antibodies (provider)
- Main image
- Experimental details
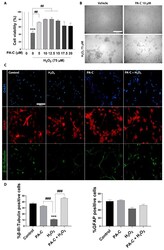
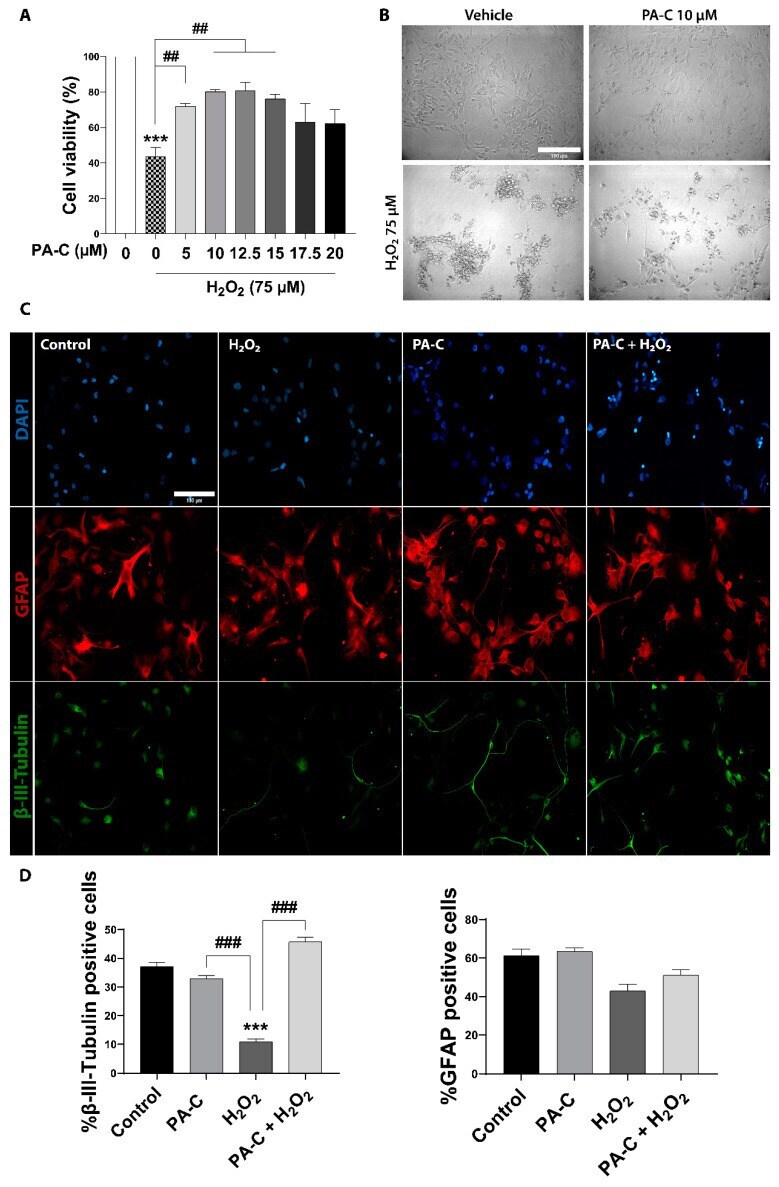
- Figure 3 Neuroprotective effect of PA-C pre-treatment following peroxide-induced cytotoxicity in iPSC-NSC. ( A ). Effect of PA-C pre-treatment (5, 10, 12.5, 15, 17.5, and 20 uM) on iPSC-NSC viability following a 24 h incubation with 75 uM H 2 O 2 . MTS viability values represented as a percentage of vehicle-treated control cells. Data expressed as mean +- S.E.M. of three independent experiments determined by one-way ANOVA multiple comparison tests (*** p < 0.0001 vs. Control; ## p < 0.01 as indicated). ( B ). Representative bright-field images of iPSC-NSC morphology after PA-C pre-treatment and H 2 O 2 treatment (scale bar = 150 um). ( C ). Representative immunofluorescence staining of beta-III-Tubulin (green), GFAP (red), and DAPI (blue) of iPSC-NSC pre-treated for 30 min with 10 uM PA-C and then incubated with 75 uM H 2 O 2 for 24 h. Scale bar = 150 um. ( D ). Quantitative analysis of the ratio of beta-III-Tubulin cells and GFAP cells shown as a percentage of total DAPI from immunostaining. Data expressed as mean +- S.E.M. from three independent experiments as determined by one-way ANOVA with Tukey's multiple comparison test (*** p < 0.001 vs. Control; ### p < 0.001 as indicated).
- Submitted by
- Invitrogen Antibodies (provider)
- Main image
- Experimental details
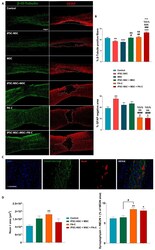
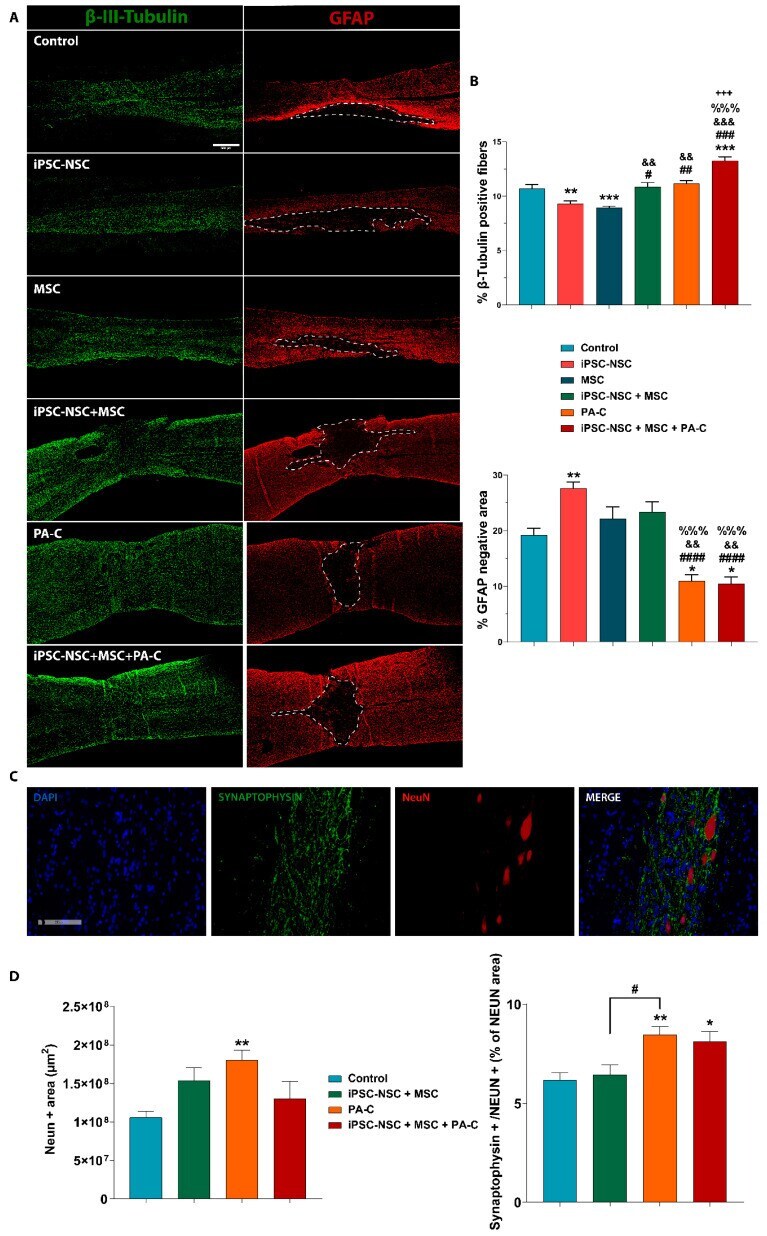
- Figure 6 ( A ). PA-C and PA-C combined with iPSC-NSC + MSC transplantation preserves beta-III-Tubulin fibers and synapses and reduces scar size A. Representative immunofluorescence images ( left panel ) of beta-III-Tubulin (green) and GFAP (red) of longitudinal spinal cord sections, including the injured area nine weeks after SCI (scale bar = 500 um). Dotted lines delimit the GFAP-negative area. ( B ). Quantification of beta-III-Tubulin-positive fibers ( upper panel ) and GFAP-negative scar area ( lower panel ) represented as a percentage of the total analyzed area and expressed as mean +- S.E.M. determined by one-way ANOVA with Tukey's multiple comparison test for beta-III-Tubulin and Kruskal-Wallis one-way ANOVA with Dunn's method for GFAP (control, n = 8; iPSC-NSC + MSC, n = 8; n = 4 for iPSC-NSC, MSC, PA-C, iPSC-NSC + MSC + PA-C). * p < 0.05, ** p < 0.01, *** p < 0.001 vs. control; # p < 0.05, ## p < 0.01, ### p < 0.001, #### p < 0.0001 vs. iPSC-NSC; && p < 0.01, &&& p < 0.001, vs. MSC, %%% p < 0.001 vs. iPSC-NSC + MSC, +++ p < 0.001 vs. PA-C. ( C ). Representative immunofluorescence images of longitudinal spinal cord sections of synaptophysin (green), NeuN (red), and DAPI (blue) staining (scale bar = 200 u). ( D ). Quantification of NeuN-positive area ( left panel ) and functional synapses by analyzing the co-localization of synaptophysin and NeuN ( right panel ), represented as a percentage of the NeuN-positive area. Quantitative data expressed as mean +- S.E.M determin
- Submitted by
- Invitrogen Antibodies (provider)
- Main image
- Experimental details
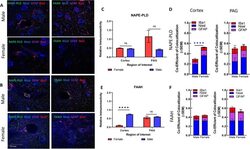
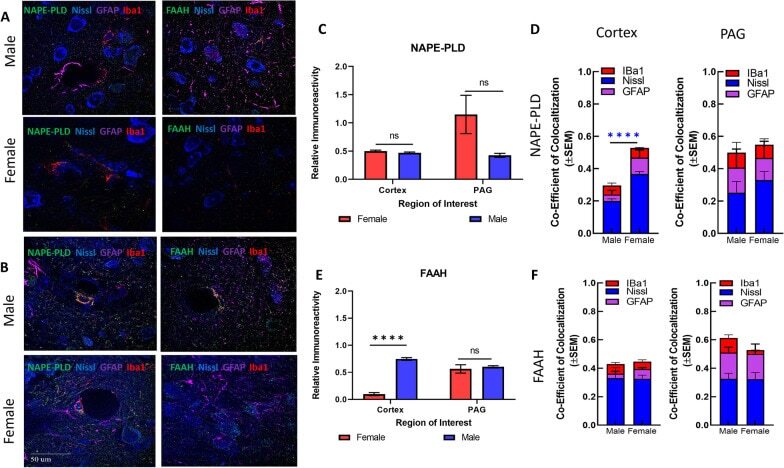
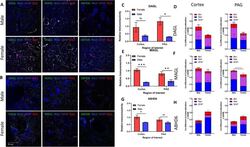
- Fig. 3 Immunohistochemical analysis of the AEA system. A Immunohistochemistry of naive male and female cortex. Staining for NAPE-PLD, FAAH, Iba1, GFAP, and Nissl was performed. Original magnification x63. B Immunohistochemistry of naive male and female PAG. Staining for NAPE-PLD, FAAH, Iba1, GFAP, and Nissl was performed. Original magnification x63. Scale on lower left image applies to all frames. C Measurement of relative area of IHC field occupied by NAPE-PLD staining pixels for each sex and region. No significant differences were observed between region or sex. D Measurement of co-efficient of colocalization for NAPE-PLD with IBa1, Nissl, and GFAP. NAPE-PLD colocalized with Nissl at significantly higher rates in female cortex vs male cortex (**** p = 0.004). No significant differences observed in PAG. E Measurement of relative area of IHC field occupied by FAAH staining pixels for each sex and region. FAAH immunoreactivity was significantly higher in male cortex vs female cortex (**** p = 0.003). F Measurement of co-efficient of colocalization for FAAH with IBa1, Nissl, and GFAP. No significant differences observed between region or sex. All calculations for co-efficient of colocalization were performed with respect to the relevant enzyme. n = 3/sex for each analysis
- Submitted by
- Invitrogen Antibodies (provider)
- Main image
- Experimental details
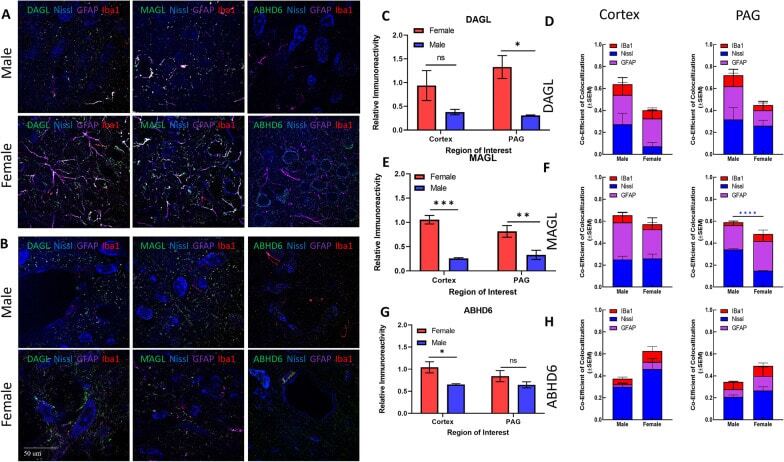
- Fig. 4 Immunohistochemical analysis of the AEA system. A Immunohistochemistry of naive male and female V1M cortex. Staining for NAPE-PLD, FAAH, Iba1, GFAP, and Nissl was performed. Original magnification x63. B Immunohistochemistry of naive male and female PAG. Staining for NAPE-PLD, FAAH, Iba1, GFAP, and Nissl was performed. Original magnification x63. C Measurement of relative area of IHC field occupied by NAPE-PLD staining pixels for each sex and region. Female NAPE-PLD immunoreactivity was significantly higher in PAG vs male PAG (* p = 0.02). D Measurement of co-efficient of colocalization for NAPE-PLD with IBa1, Nissl, and GFAP. NAPE-PLD colocalized with Nissl at significantly higher rates in female V1M cortex vs male V1M cortex (**** p = 0.001). No significant differences observed in PAG. E Measurement of relative area of IHC field occupied by FAAH staining pixels for each sex and region. FAAH immunoreactivity was significantly higher in female PAG vs male PAG (*** p = 0.0042) as well as female PAG vs female V1M cortex ( ### p = 0.002). F Measurement of co-efficient of colocalization for FAAH with IBa1, Nissl, and GFAP. No significant differences observed between region or sex. All calculations for co-efficient of colocalization were performed with respect to the relevant enzyme. n = 3/sex for each analysis
- Submitted by
- Invitrogen Antibodies (provider)
- Main image
- Experimental details
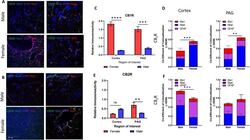
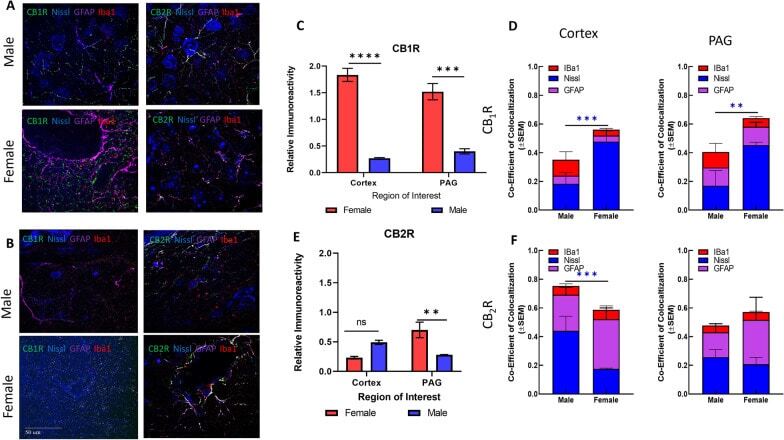
- Fig. 5 Immunohistochemical analysis of CB1R and CB2R. A Immunohistochemistry of naive male and female cortex. Staining for CB1R, CB2R, Iba1, GFAP, and Nissl was performed. Original magnification x63. B Immunohistochemistry of naive male and female PAG. Staining for CB1R, CB2R, Iba1, GFAP, and Nissl was performed. Original magnification x63. Scale on lower left image applies to all frames. C Relative immunoreactivity of CB1R staining revealed significantly greater staining for CB1R in female cortex and lPAG vs males for both regions (**** p < 0.0001 female cortex vs male cortex, *** p = 0.001 female lPAG vs male lPAG). D Measurement of co-efficient of colocalization for CB1R with Iba1, Nissl, and GFAP. CB1R colocalization with Nissl was significantly higher in female cortex vs male cortex (*** p = 0.008) and female PAG vs male PAG (** p = 0.01). E CB2R immunoreactivity was significantly higher in female lPAG vs male lPAG (** p = 0.0053). F Measurement of co-efficient of colocalization for CB2R with IBa1, Nissl, and GFAP. CB2R colocalization with Nissl in the male cortex was significantly greater than in female cortex (*** p = 0.0178). All calculations for co-efficient of colocalization were performed with respect to the relevant enzyme. n = 3/sex for each analysis
- Submitted by
- Invitrogen Antibodies (provider)
- Main image
- Experimental details
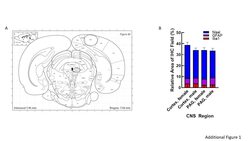
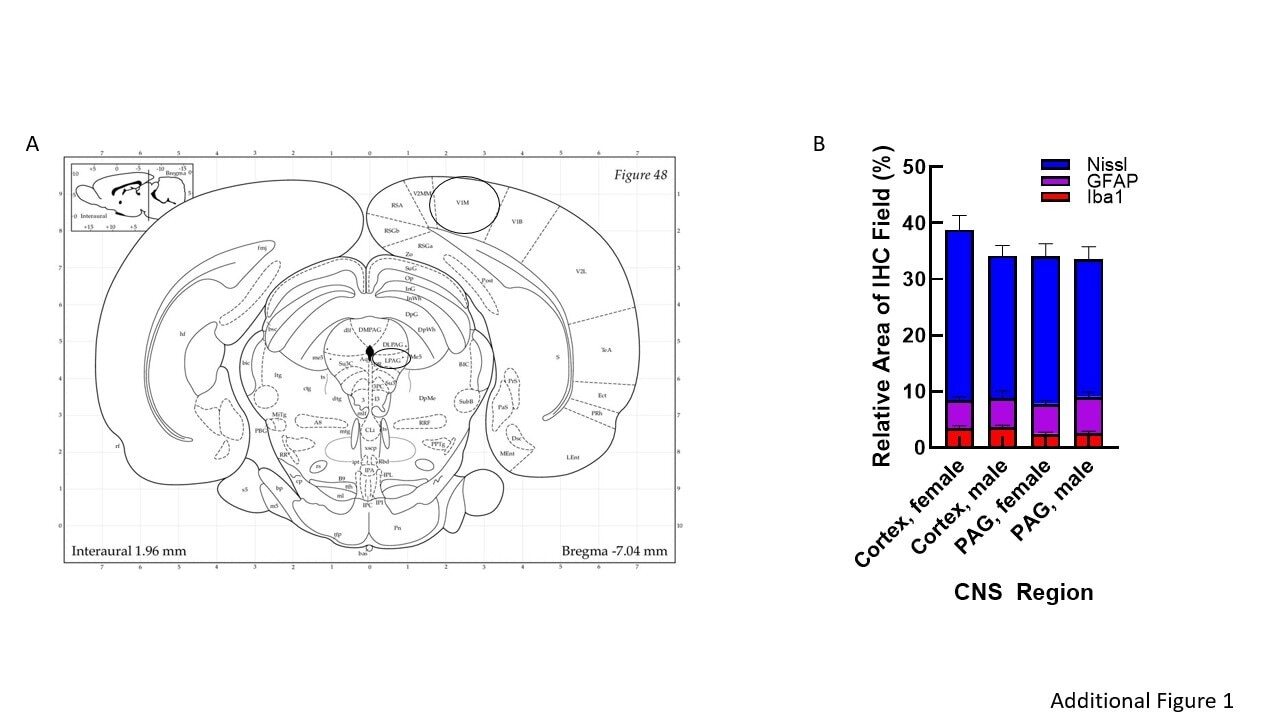
- Additional file 1: Figure 1. Regional analysis. A Serial sections from rats' brains were obtained at a thickness of 30um, moving posteriorly from approximately Bregma -7mm with PAG imaging in the lateral PAG. B Quantification of the relative area immunoreactive in each field for Nissl (neuronal soma), GFAP (astrocytes), and Iba1 (microglia) was statistically similar between regions and sex.
- Submitted by
- Invitrogen Antibodies (provider)
- Main image
- Experimental details
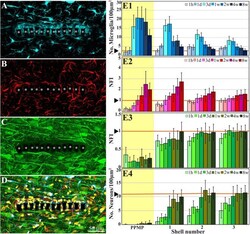
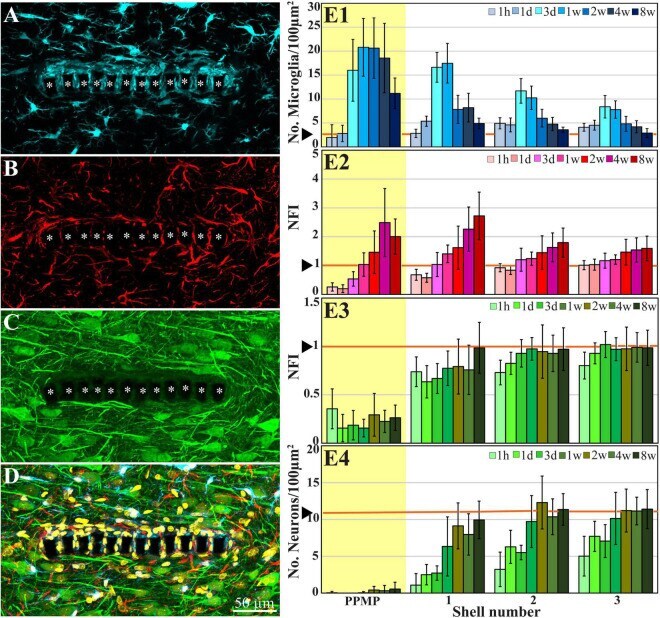
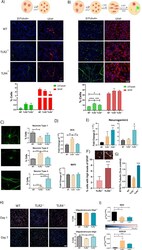
- FIGURE 2 Confocal microscope images showing horizontal-sections of immuno-labeled cortical brain tissue along with cross sections of the perforated segment of an implanted PPMP, 2 weeks post implantation. Shown are: microglia (cyan) within and around the implant marked by asterisks (A) , astrocytes ( B , red), neurons and neurites ( C , green), and a merged image of (A-C) which also includes the nuclei of the cells labeled in yellow (D) . (E) Histograms depicting the average Normalized Fluorescent Intensity (NFI) or number of cells/100 mum 2 . Microglia ( E1 , cyan), astrocytes ( E2 , red), neurites and cell bodies ( E3 , green), and neuronal cell bodies ( E4 , green) within and around the platform's perforated segments. The time post-platform implantation is coded by the darkening of the column color as indicated by the legend on the right hand side of the histograms. The average NFI values or the cells/100 mum 2 within the platforms (PPMP) are highlighted in yellow. The distance of the average NFI from the MEA platform is given by shell number. Each shell is 25 mum wide (as illustrated in Figure 1F ). Vertical lines correspond to one standard deviation. The orange lines indicated by the arrowheads depict the normal NFI values or the number of cell/100 mum 2 in the control cortices. An enlarged image of (D) is presented as Supplementary Figure 2 .
- Submitted by
- Invitrogen Antibodies (provider)
- Main image
- Experimental details
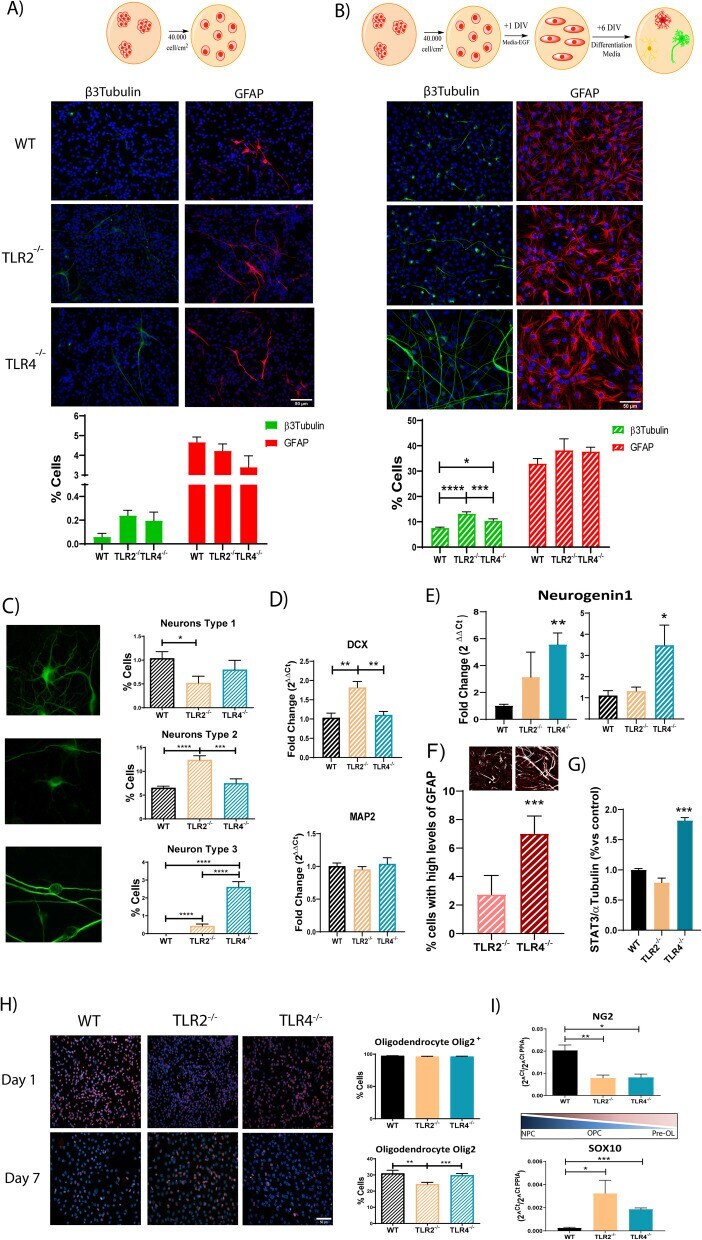
- Fig. 4 TLR2 and TLR4 loss influence the spontaneous differentiation of in vitro-expanded spinal cord NPCs. A , B Representative immunofluorescence images of beta3tubulin (neural marker; green) and GFAP (astrocytic marker, red) and the corresponding quantification data of the percentage of positive cells (lower panels) in NPCs grown in growth medium ( A ) or in differentiation medium ( B ) as summarized in the diagrams (top images). DAPI used for nuclei counterstaining (blue). C Morphological classification of the three distinct types of neurons identified from beta3tubulin staining--type 1 (pyramidal-like cells; upper panel), Type 2 (rounded, with no cell expansions; central panel), and Type 3 (bipolar cells; lower panel). Quantification and comparative analysis of the percentage of the corresponding type of neurons shown for WT, TLR2 -/- , and TLR4 -/- NPCs; D Gene expression analysis of Dcx (early neuronal marker, upper graph) and MAP2 (late neuronal marker, lower graph). E Gene expression analysis of Neurogenin1 in growth medium (left) or differentiation medium (right) in WT, TLR2 -/- and TLR4 -/- NPCs. F (lower graph) Quantification and comparative analysis versus WT NPCs of the number of cells expressing higher GFAP protein expression levels in TLR2 -/- and TLR4 -/- cells; (upper panels) Binarized representative images for TLR2 -/- and TLR4 -/- NPCs showing cells with a fluorescence intensity above the WT levels threshold. G Protein expression levels of STAT3 in WT, TLR2
- Submitted by
- Invitrogen Antibodies (provider)
- Main image
- Experimental details
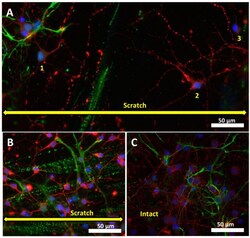
- Fluorescence staining of neuroglial culture for cell markers GFAP and beta-III tubulin. Fluorescent images of cell culture on days 3 ( A ) and 7 ( B ) after scratching (7 DIV and 10 DIV, respectively) and intact cell culture (10 DIV) without scratching ( C ) were taken with a fluorescent microscope Zeiss Axiovert-200, objective 40x/NA = 1.35 (oil). Scale bar is shown on the images. The yellow double arrow corresponds to the width of the scratch. Pairwise stitching ( A ) of two adjacent fragments was obtained using ImageJ software. ( A ) On day 3 after injury, a few neurons are observed in the injured area (indicated by numbers 1-3). ( B ) Numerous neurons migrate into the damaged area on day 7 after scratching.

- Submitted by
- Invitrogen Antibodies (provider)
- Main image
- Experimental details
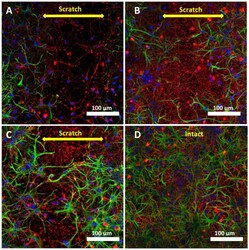
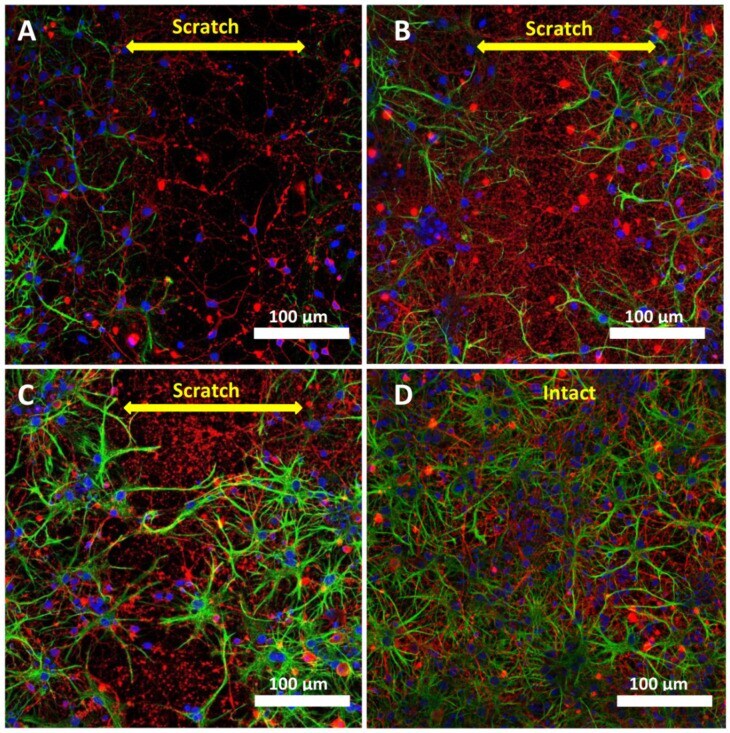
- Fluorescence staining of neuroglial culture for GFAP i beta-III tubulin. Fluorescent images of the cell culture were obtained on day 3 after scratching, 7 DIV ( A ); on day 7 after scratching, 10 DIV ( B ); on day 10 after scratching, 14 DIV ( C ), and intact cell culture without scratching, 14 DIV ( D ). Scale bar is shown on the images. The yellow double arrow corresponds to the width of the scratch. Images were acquired using a LSM 880 scanning laser confocal microscope equipped with an AiryScan module and GaAsP detector. The ZEN Black tile scanning function was used to stitch four separate images in each panel.
- Submitted by
- Invitrogen Antibodies (provider)
- Main image
- Experimental details
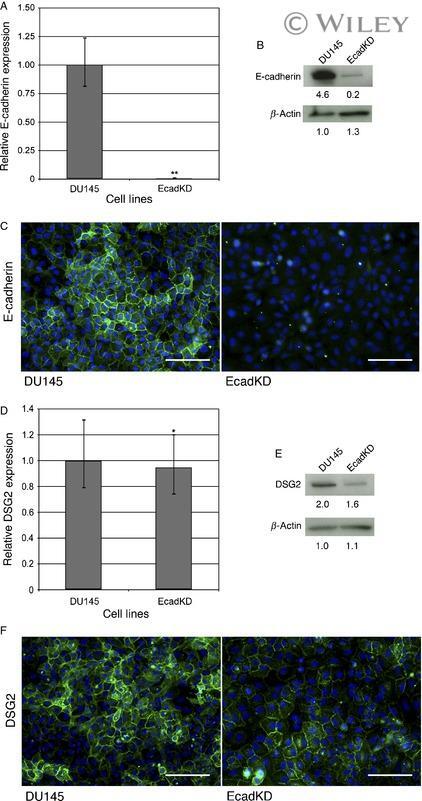
- Constitutively active AKT signaling reduces E-cadherin expression via Snail transcriptional downregulation but does not affect DSG 2. (A) qRT - PCR analysis shows that overexpression of constitutively active AKT results in a 93% reduction in E-cadherin mRNA expression. (B) Western Blot analysis shows that E-cadherin protein expression is dramatically reduced in the MAH cell line. (C) Representative immunofluorescence (IF) analysis shows that E-cadherin is undetectable at the cell-cell border in MAH cell line. E-cadherin is shown in green, HA in red and DAPI in blue. (D) qRT - PCR analysis shows that DSG 2 mRNA expression is slightly increased (1.6X) in the MAH cell line. (E) Western Blot analysis confirms an increase in DSG 2 protein expression. (F) IF analysis shows that DSG 2 is detected at the cell-cell border in MAH cells, though less frequently than as compared to the DU 145 parental cell line by observation. Most of the cells that express DSG 2 at the cell border also express HA , although scattered cells with high HA expression displayed loss of DSG 2 (white arrows). DSG is shown in green, HA in red and DAPI in blue. (G) qRT - PCR analysis shows a slight but significant increase (1.8X) in Snail mRNA expression in the MAH cell line. (H) Western Blot analysis shows that Snail protein expression is comparable to that of the DU 145 parental cell line. (I) IF analysis shows a dramatic increase in the nuclear localization of Snail in the MAH cell line, indicative of Snail ac
- Submitted by
- Invitrogen Antibodies (provider)
- Main image

- Experimental details
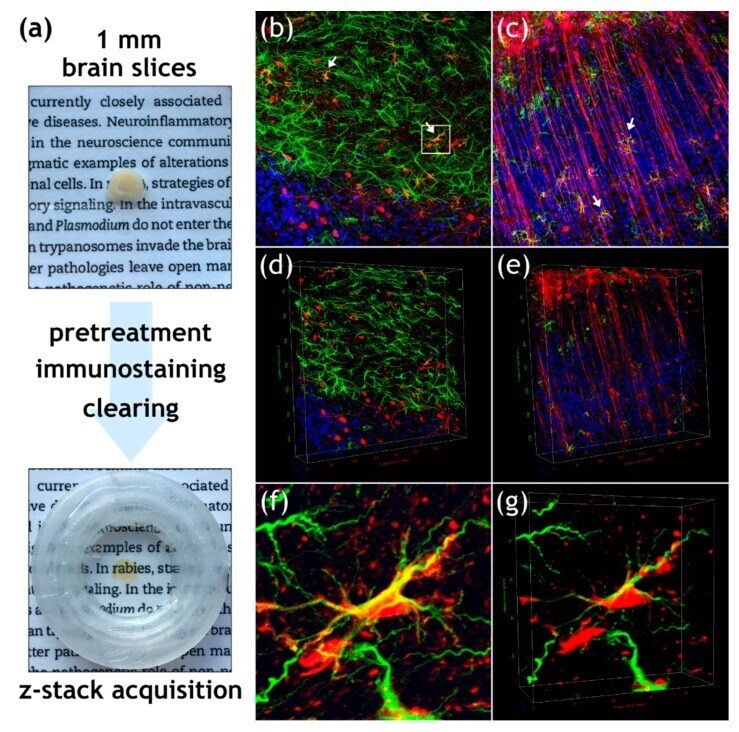
- Figure 2 3D immunofluorescence imaging of field RABV-infected neurons and astrocytes in a mouse brain. ( a ) Workflow for 3D immunofluorescence imaging, including vibratome sectioning into 1 mm slices, pretreatment, immunostaining, and subsequent optical clearing with organic solvents. Confocal imaging and acquisition of cleared tissue slices was done in custom-made imaging containers (see lower image). ( b , c ) Maximum z- and ( d - e ) 3D projections of z-stack (x, y, z = 400 um, 400 um, 59 um for D and 400 um, 400 um, 103 um for E) after indirect immunofluorescence for RABV phosphoprotein P (red), GFAP (green), and NeuN (blue). White arrows in Figure 2 b indicate RABV P and GFAP-positive astrocytes. ( f ) Maximum projection of detail from Figure 2 b (see white box) with GFAP-positive cell (green) and associated RABV P fluorescence (red). ( g ) 3D projection of detail view from Figure 2 f.
- Submitted by
- Invitrogen Antibodies (provider)
- Main image
- Experimental details
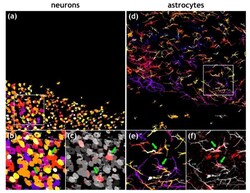
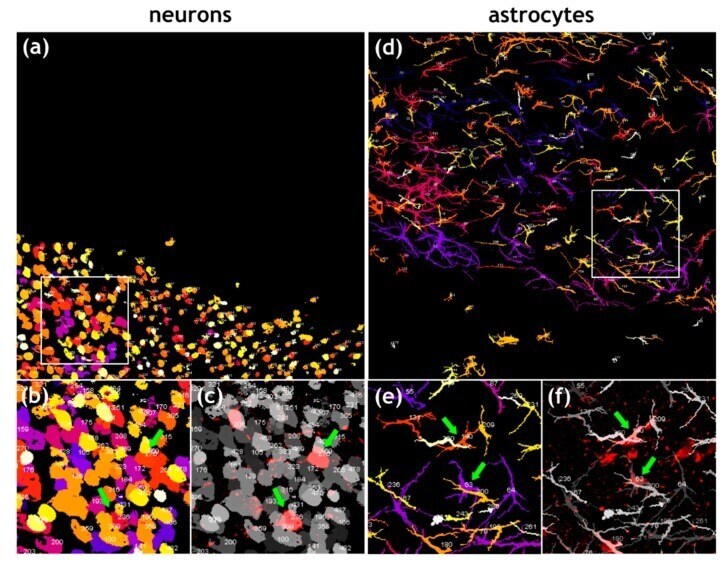
- Figure 3 Quantification of RABV-infected neurons and astrocytes. ( a ) Maximum z-projection of objects map for NeuN-positive neurons generated from a confocal z-stack (see Figure 2 b). Individual neurons in the z-stack were identified by NeuN-specific fluorescence and converted to objects. Numbers indicate individual cell counts (for improved legibility of the individual numbers, refer to the enlarged details in Supplementary Video S3 ). n = 762 neurons in a volume of 400 um x 400 um x 59 um. The object colors indicate different z-positions (darker colors in the back and brighter colors in the front). ( b ) Detail of area indicated by white box in Figure 3 a. Green arrows indicate RABV-positive neuron cell bodies. ( c ) Overlay of objects map (greyscale) with RABV P signals allows identification and counting of rRABV Fox-infected neurons. ( d ) Maximum z-projection of objects map for GFAP-positive astrocytes generated from a confocal z-stack (see Figure 2 b). Individual astrocytes in the z-stack were identified by GFAP-specific fluorescence and converted to objects. Numbers indicate individual cell counts. n = 272 astrocytes in a volume of 400 um x 400 um x 59 um. The object colors indicate different z-positions (darker colors in the back and brighter colors in the front). ( e ) Detail of area indicated by white box in Figure 3 d. Green arrows indicate RABV-positive astrocytes. ( f ) Overlay of objects map (greyscale) with RABV P signals allows identification and counting of
- Submitted by
- Invitrogen Antibodies (provider)
- Main image
- Experimental details
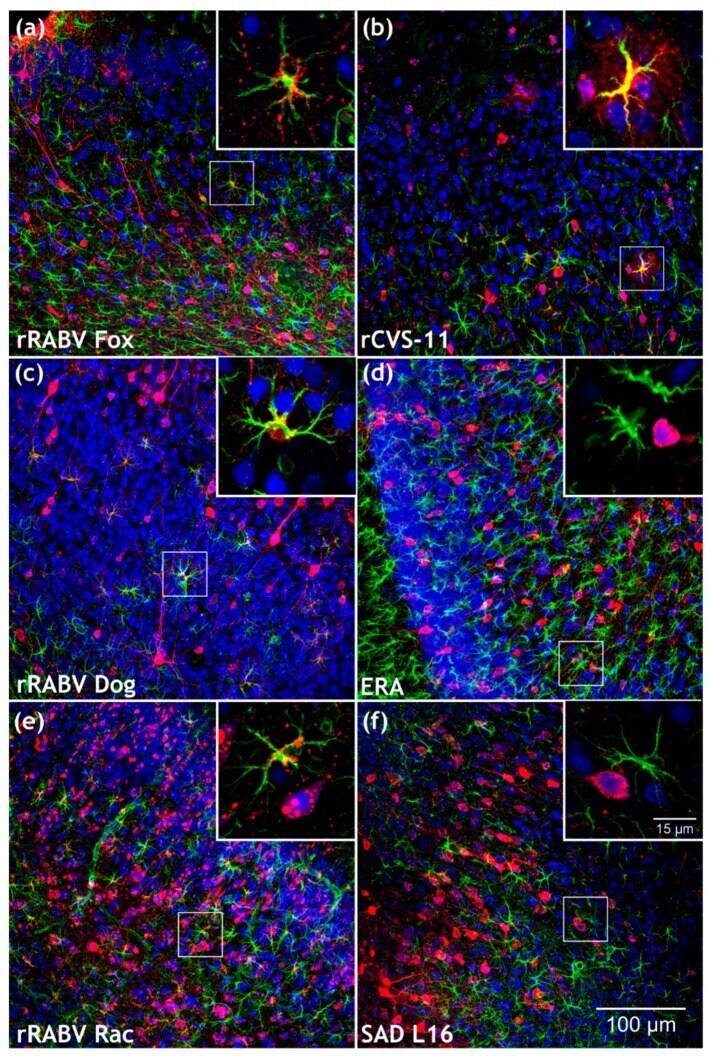
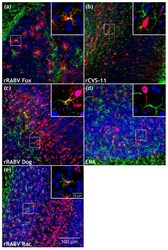
- Figure 4 Comparison of field and lab RABV-infected brains after intramuscular (i.m.) infection with rRABV Fox, rRABV Dog, rRABV Rac, rCVS-11, and Evelyn Rokitnicki Abelseth (ERA). ( a-e ) Maximum z-projections of z-stacks [x, y = 400 um, 400 um ( a-e ); z = 59 um ( a , rRABV Fox), 66 um ( b , rCVS-11), 49 um ( c , rRABV Dog), 100 um ( d , ERA) and 89 um ( e , rRABV Rac)] after indirect immunofluorescence for RABV phosphoprotein P (red), GFAP (green), and NeuN (blue). To improve visualization of the maximum z-projections, some z-stacks were reduced in thickness. For the full z-stacks, refer to Supplementary Video S4 . Insets in Figure 4 a,c,e show RABV P accumulation (red) at GFAP-positive cells (green). Insets in Figure 4 b,d show NeuN- (blue) and RABV P (red)-positive neurons. For the individual channels of the detail images, see Supplementary Figure S4 .

- Submitted by
- Invitrogen Antibodies (provider)
- Main image
- Experimental details
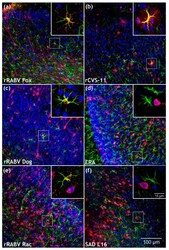
- Figure 7 Comparison of field and lab RABV-infected brains after i.c. infection. ( a - f ) Maximum z-projections of z-stacks [x, y = 400 um, 400 um ( a - f ); z = 21 um ( a , rRABV Fox), 48 um ( b , rCVS-11), 74 um ( c , rRABV Dog), 98 um ( d , ERA), 75 um ( e , rRABV Rac) and 67 um ( f , SAD L16)] after indirect immunofluorescence for RABV phosphoprotein P (red), GFAP (green), and NeuN (blue). Insets in Figure 7 a,b,c,e show RABV P accumulation (red) at GFAP-positive cells (green). To improve visualization of the maximum z-projections, some z-stacks were reduced in thickness. Insets in Figure 7 d,f show NeuN- (blue) and RABV P (red)-positive neurons. For the individual channels of the detail images, see Supplementary Figure S5 .