Explore
 Validate
 Learn
Learn Other assay
Antibody data
- Antibody Data
- Antigen structure
- References [1]
- Comments [0]
- Validations
- Other assay [2]
Submit
Validation data
Reference
Comment
Report error
- Product number
- PA5-12991 - Provider product page

- Provider
- Invitrogen Antibodies
- Product name
- Phospho-GFAP (Ser8) Polyclonal Antibody
- Antibody type
- Polyclonal
- Antigen
- Synthetic peptide
- Reactivity
- Human
- Host
- Rabbit
- Isotype
- IgG
- Vial size
- 400 µL
- Concentration
- 0.5 mg/mL
- Storage
- Store at 4°C short term. For long term storage, store at -20°C, avoiding freeze/thaw cycles.
Submitted references Inhibition of class I PI3K enhances chaperone-mediated autophagy.
Endicott SJ, Ziemba ZJ, Beckmann LJ, Boynton DN, Miller RA
The Journal of cell biology 2020 Dec 7;219(12)
The Journal of cell biology 2020 Dec 7;219(12)
No comments: Submit comment
Supportive validation
- Submitted by
- Invitrogen Antibodies (provider)
- Main image

- Experimental details
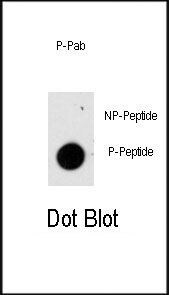
- Dot blot analysis of Phospho-GFAP pSer8 polyclonal antibody (Product # PA5-12991) on nitrocellulose membrane. 50 ng of Phospho-peptide or Non Phospho-peptide per dot were adsorbed. Antibody working concentrations are 0.5 µg per mL.
- Submitted by
- Invitrogen Antibodies (provider)
- Main image
- Experimental details
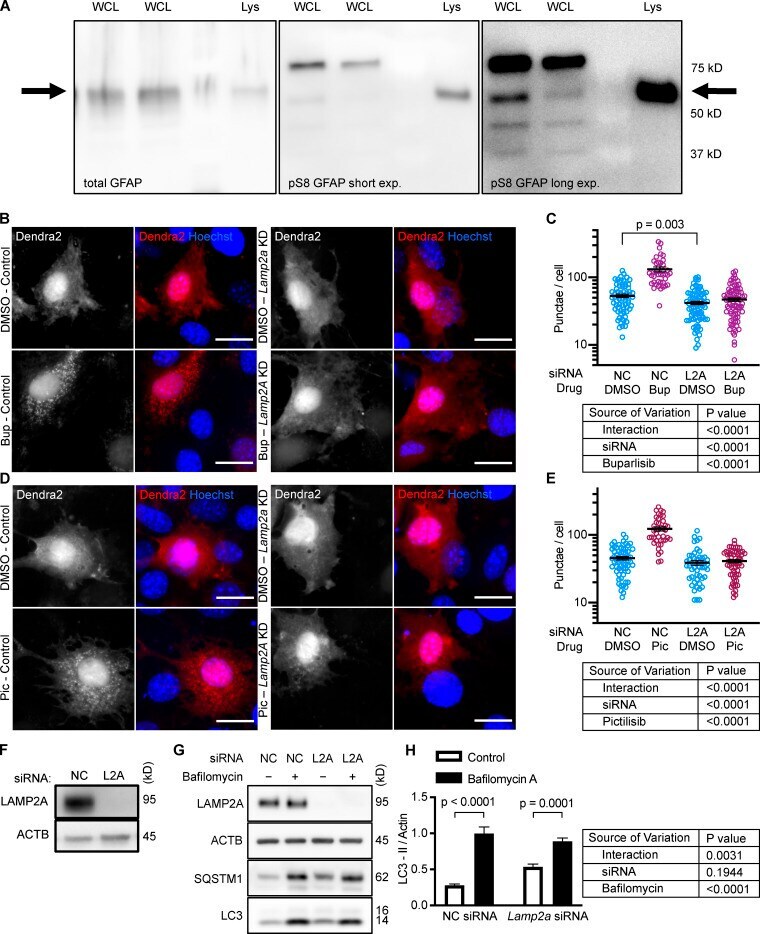
- Figure S2. Controls for GFAP isoforms and Dendra2 reporter. (A) Displays which band of GFAP and pGFAP from NIH3T3 whole cell lysate (WCL) is the same molecular weight as the GFAP and pGFAP from purified lysosomes (Lys). (B-E) NIH3T3 cells depleted of LAMP2A by siRNA do not form more Dendra2 puncta in response to buparlisib and pictilisib treatment. For B-E, data were pooled from at least three independent experiments. In C, NC-DMSO = 68 cells, NC-Bup = 40 cells, Lamp2a -DMSO = 80 cells, and Lamp2a -Bup = 81 cells. In E, NC-DMSO = 62 cells, NC-Pic = 41 cells, Lamp2A -DMSO = 50 cells, and Lamp2A -Pic = 64 cells. (F) Control for knockdown efficiency under conditions used in B-E. (G and H) NIH3T3 cells treated with siRNA against Lamp2a show a small but significant decrease in LC3-II flux, indicating macroautophagy impairment, n = 6. NC is negative control siRNA. P values written above brackets are derived from unpaired t tests. Two-way ANOVA tables are displayed next to graphs where appropriate. Error bars are SEM. Scale bars are 20 um. ACTB, beta-Actin; Bup, buparlisib; exp., exposure; Pic, pictilisib.