 Explore
 Validate
 Learn
Learn Western blot
Antibody data
- Antibody Data
- Antigen structure
- References [1]
- Comments [0]
- Validations
- Western blot [1]
- Other assay [1]
Submit
Validation data
Reference
Comment
Report error
- Product number
- PA5-36600 - Provider product page

- Provider
- Invitrogen Antibodies
- Product name
- MT-ND5 Polyclonal Antibody
- Antibody type
- Polyclonal
- Antigen
- Synthetic peptide
- Description
- This antibody detects endogenous protein at a molecular weight of 67 kDa.
- Concentration
- 1 mg/mL
Submitted references Cyclophilin D-dependent mitochondrial permeability transition amplifies inflammatory reprogramming in endotoxemia.
Veres B, Eros K, Antus C, Kalman N, Fonai F, Jakus PB, Boros E, Hegedus Z, Nagy I, Tretter L, Gallyas F Jr, Sumegi B
FEBS open bio 2021 Mar;11(3):684-704
FEBS open bio 2021 Mar;11(3):684-704
No comments: Submit comment
Supportive validation
- Submitted by
- Invitrogen Antibodies (provider)
- Main image
- Experimental details
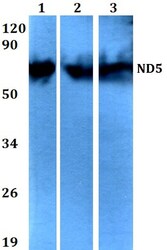
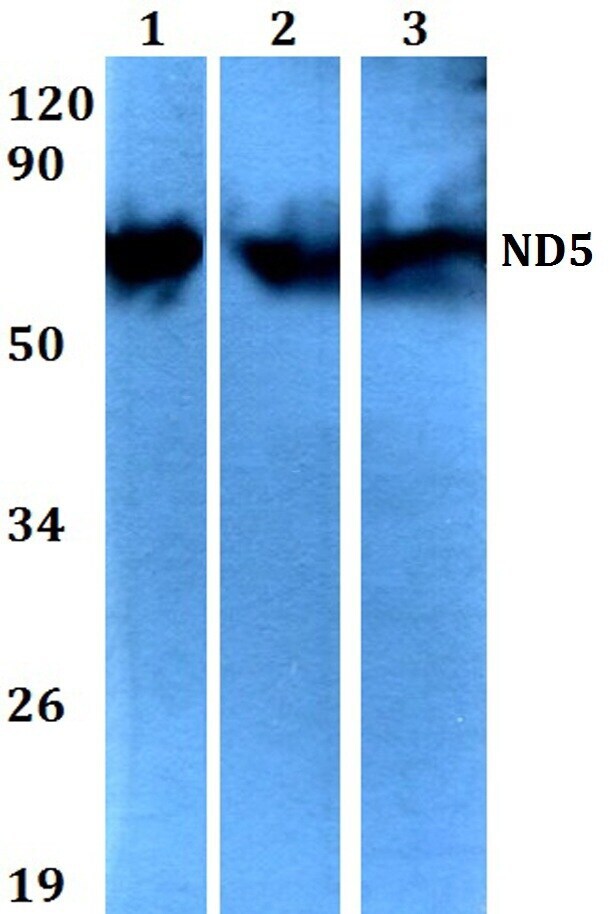
- Western blot analysis of MT-ND5 in Lane 1: HEK293T whole cell lysate, Lane 2: Raw264.7 whole cell lysate, Lane 3: H9C2 whole cell lysate. Samples were incubated with MT-ND5 polyclonal antibody (Product # PA5-36600) at a dilution of 1:500.
Supportive validation
- Submitted by
- Invitrogen Antibodies (provider)
- Main image
- Experimental details
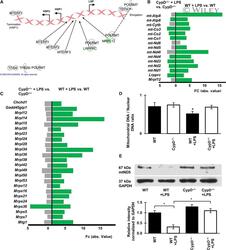
- 7 Fig. CypD deficiency attenuates LPS-induced alterations regarding processes of mitochondrial replication in the sterile shock model. (A) Effect of CypD deficiency on the LPS-induced alterations of regulators of transcription from mtDNA. Green symbols represent downregulated genes, while white symbols show genes not significantly affected. (B) Fold change values of LPS-induced DEGs in the mitochondrial transcription regulators and mtDNA-encoded genes in WT and CypD -/- mice. Green bars represent downregulated genes gray bars show genes not significantly affected, ( n = 5), Kal's Z -test, adjPval < 0.05, [FC] > 1.5. (C) Bar graph demonstrating DEGs for mitochondrial ribosomes and accessory proteins in LPS-exposed WT and CypD -/- mouse liver tissues. Green bars represent downregulated genes gray bars show genes not significantly affected, ( n = 5), Kal's Z -test, adjPval < 0.05, [FC] > 1.5. (D) The effect of CypD disruption on LPS-induced changes of mtDNA levels relative to nuclear DNA content in liver tissues during endotoxemia, determined by qPCR. Data are presented as mean +- SEM, ( n = 5), * P < 0.05, one-way ANOVA followed by Bonferroni post hoc comparisons. (E) Western blot analysis of the effect of CypD disruption after LPS exposure on the cellular level of mitochondrial protein complex I component, mtND5. Data are presented as mean +- SEM ( n = 5), * P < 0.05, one-way ANOVA followed by Bonferroni post hoc comparisons.
