Explore
 Validate
 Learn
Learn Western blot
Antibody data
- Antibody Data
- Antigen structure
- References [1]
- Comments [0]
- Validations
- Western blot [2]
- Immunohistochemistry [1]
- Other assay [1]
Submit
Validation data
Reference
Comment
Report error
- Product number
- PA5-29979 - Provider product page

- Provider
- Invitrogen Antibodies
- Product name
- C3a Receptor Polyclonal Antibody
- Antibody type
- Polyclonal
- Antigen
- Recombinant protein fragment
- Description
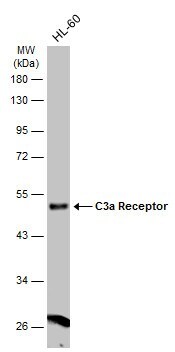
- Recommended positive controls: HL-60.
- Concentration
- 1.01 mg/mL
Submitted references Single-Cell RNA Sequencing Reveals a Dynamic Stromal Niche That Supports Tumor Growth.
Davidson S, Efremova M, Riedel A, Mahata B, Pramanik J, Huuhtanen J, Kar G, Vento-Tormo R, Hagai T, Chen X, Haniffa MA, Shields JD, Teichmann SA
Cell reports 2020 May 19;31(7):107628
Cell reports 2020 May 19;31(7):107628
No comments: Submit comment
Supportive validation
- Submitted by
- Invitrogen Antibodies (provider)
- Main image

- Experimental details
- Western blot analysis of C3a receptor 1 using 30 µg of A549 lysate. Samples were loaded onto a 10% SDS-PAGE gel and probed with a C3a receptor 1 polyclonal antibody (Product # PA5-29979) at a dilution of 1:3000.

- Submitted by
- Invitrogen Antibodies (provider)
- Main image

- Experimental details
- Western blot analysis of C3a Receptor was performed by separating 30 µg of whole cell extract by 10% SDS-PAGE. Proteins were transferred to a membrane and probed with a C3a Receptor Polyclonal Antibody (Product # PA5-29979) at a dilution of 1:1000. The HRP-conjugated anti-rabbit IgG antibody was used to detect the primary antibody.
Supportive validation
- Submitted by
- Invitrogen Antibodies (provider)
- Main image

- Experimental details
- Immunohistochemical analysis of paraffin-embedded human colon carcinoma, using C3a receptor 1 (Product # PA5-29979) antibody at 1:500 dilution. Antigen Retrieval: EDTA based buffer, pH 8.0, 15 min.

Supportive validation
- Submitted by
- Invitrogen Antibodies (provider)
- Main image
- Experimental details
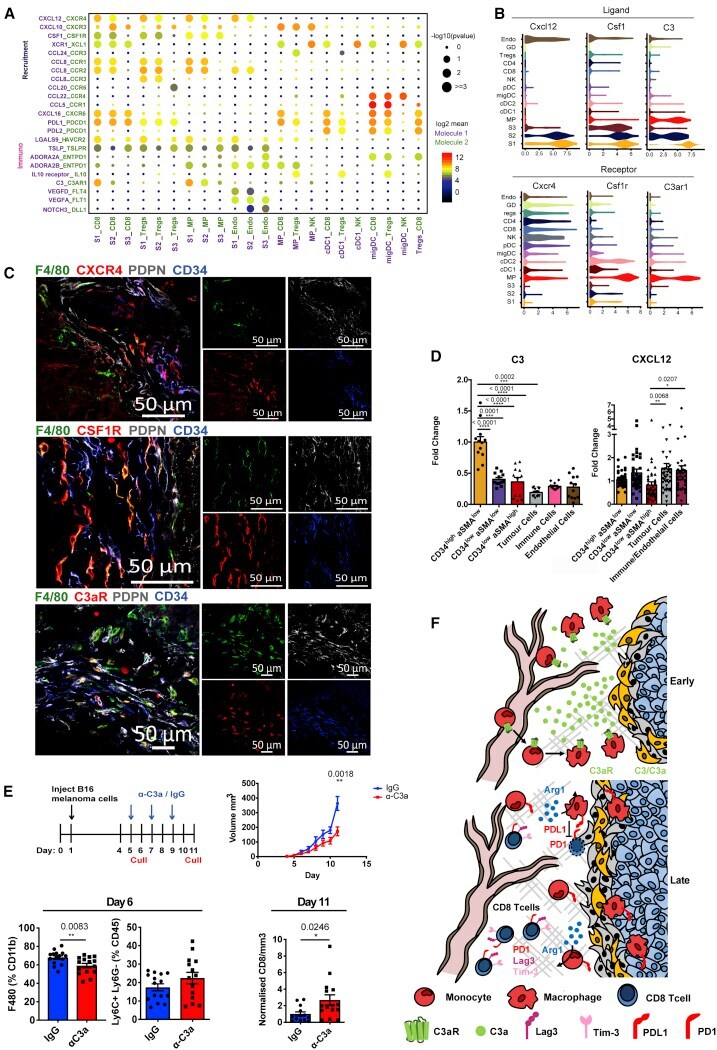
- Figure 6 Stromal-Immune Crosstalk Supports the Development of an Immunosuppressive Niche (A) Overview of selected statistically significant interactions between stromal subsets and other cell types using a cell-cell communication pipeline based on CellPhoneDB. Size indicates p values (permutation test, see STAR Methods ), and color indicates the means of the receptor-ligand pairs between 2 clusters. (B) Violin plots displaying expression log(TPM+1) of ligands Cxcl12 , Csf1 , and C3 and cognate receptors Cxcr4 , Csf1r , and C3ar1 on respective stromal populations. n = 26 mice. (C) Confocal images of representative tumor-tissue borders. CXCR4, CSFR1, or C3aR expressing macrophages located proximally to CD34 + CAFs (green, F4/80; red, CXCR4, CSF1R, or C3aR; white, PDPN; blue, CD34). Scale bars, 50 mum. (D) Flow cytometric quantification of CXCL12 and C3 expression across compartments of the tumor microenvironment. Each point represents a tumor. CXCL12 n = 42 tumors, C3 n = 12 tumors. One-way ANOVA with Tukey post hoc test. (E) In vivo blockade of C3a in established tumors. Top left: experimental design and treatment regimen; top right: tumor volume (in cubic millimeters) of mice treated with IgG control (blue) or anti-C3a (red); bottom left: myeloid infiltration in day 6 tumors, after 24 h of treatment with IgG or anti-C3a. The number of F4/80 and Ly6C + Ly6G - cells are shown as a percentage of Cd11b and CD45 cells, respectively; bottom right: the number of tumor-infiltrating C