 Explore
 Validate
 Learn
Learn Western blot
Antibody data
- Antibody Data
- Antigen structure
- References [4]
- Comments [0]
- Validations
- Western blot [7]
- Immunocytochemistry [2]
- Immunohistochemistry [1]
- Other assay [6]
Submit
Validation data
Reference
Comment
Report error
- Product number
- MA1-91128 - Provider product page

- Provider
- Invitrogen Antibodies
- Product name
- N-cadherin Monoclonal Antibody (CH-19)
- Antibody type
- Monoclonal
- Antigen
- Synthetic peptide
- Description
- Recommended positive controls: MDBK. Store product as a concentrated solution. Centrifuge briefly prior to opening the vial.
- Reactivity
- Human, Mouse, Rat, Bovine, Canine, Chicken/Avian, Feline, Goat, Guinea Pig, Hamster, Porcine, Rabbit
- Host
- Mouse
- Isotype
- IgG
- Antibody clone number
- CH-19
- Vial size
- 100 µL
- Concentration
- 6.1 mg/mL
- Storage
- Store at 4°C short term. For long term storage, store at -20°C, avoiding freeze/thaw cycles.
Submitted references Deubiquitinase ubiquitin-specific peptidase 10 maintains cysteine rich angiogenic inducer 61 expression via Yes1 associated transcriptional regulator to augment immune escape and metastasis of pancreatic adenocarcinoma.
ShapeMetrics: A userfriendly pipeline for 3D cell segmentation and spatial tissue analysis.
Epithelial-to-mesenchymal transition and keratinocyte differentiation in equine experimental body and limb wounds healing by second intention.
ST8SIA2 promotes oligodendrocyte differentiation and the integrity of myelin and axons.
Liu X, Chen B, Chen J, Su Z, Sun S
Cancer science 2022 May;113(5):1868-1879
Cancer science 2022 May;113(5):1868-1879
ShapeMetrics: A userfriendly pipeline for 3D cell segmentation and spatial tissue analysis.
Takko H, Pajanoja C, Kurtzeborn K, Hsin J, Kuure S, Kerosuo L
Developmental biology 2020 Jun 1;462(1):7-19
Developmental biology 2020 Jun 1;462(1):7-19
Epithelial-to-mesenchymal transition and keratinocyte differentiation in equine experimental body and limb wounds healing by second intention.
Jørgensen E, Pirone A, Jacobsen S, Miragliotta V
Veterinary dermatology 2019 Oct;30(5):417-e126
Veterinary dermatology 2019 Oct;30(5):417-e126
ST8SIA2 promotes oligodendrocyte differentiation and the integrity of myelin and axons.
Szewczyk LM, Brozko N, Nagalski A, Röckle I, Werneburg S, Hildebrandt H, Wisniewska MB, Kuznicki J
Glia 2017 Jan;65(1):34-49
Glia 2017 Jan;65(1):34-49
No comments: Submit comment
Supportive validation
- Submitted by
- Invitrogen Antibodies (provider)
- Main image
- Experimental details
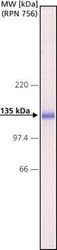
- Western blot analysis of pan Cadherin in Madin Darby Bovine Kidney (MDBK) extract using a pan Cadherin monoclonal antibody (Product # MA1-91128) at a dilution of 1:2000 and developed with HRP APA mouse Fab ads/HIgG conjugate and a NBT/BCIP substrate.

- Submitted by
- Invitrogen Antibodies (provider)
- Main image
- Experimental details
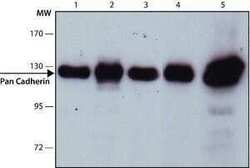
- Western Blot analysis of N-cadherin was performed by loading (1) C2C12 (2) HeLa (3) NIH-3T3 (4) MDBK (5) COS-7 cell lysates. Proteins were transferred to a membrane and probed with a N-cadherin Monoclonal Antibody (CH-19) (Product # MA1-91128) at a dilution of 1:1,000..

- Submitted by
- Invitrogen Antibodies (provider)
- Main image
- Experimental details
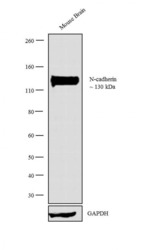
- Western blot analysis was performed on tissue extract (30 µg lysate) of Mouse Brain (Lane 1). The blot was probed with Anti-N-cadherin Monoclonal Antibody (Product # MA1-91128, 1:500 dilution) and detected by chemiluminescence using Goat anti-Mouse IgG (H+L) Superclonal™ Secondary Antibody, HRP conjugate (Product # A28177, 0.25 µg/mL, 1:4000 dilution). A 130 kDa band corresponding to N-cadherin was observed in the tissue tested.

- Submitted by
- Invitrogen Antibodies (provider)
- Main image
- Experimental details
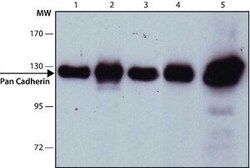
- Western Blot analysis of N-cadherin was performed by loading (1) C2C12 (2) HeLa (3) NIH-3T3 (4) MDBK (5) COS-7 cell lysates. Proteins were transferred to a membrane and probed with a N-cadherin Monoclonal Antibody (CH-19) (Product # MA1-91128) at a dilution of 1:1,000..

- Submitted by
- Invitrogen Antibodies (provider)
- Main image
- Experimental details
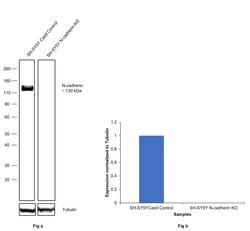
- Knockout of N-cadherin was achieved by CRISPR-Cas9 genome editing using LentiArray™ Lentiviral sgRNA (Product # A32042, Assay ID CRISPR914282_LV) and LentiArray Cas9 Lentivirus (Product # A32064). Western blot analysis of N-cadherin was performed by loading 30 µg of SHSY5Y Wild Type (Lane 1), SHSY5Y Cas9 (Lane 2) andSHSY5Y N-Cadherin KO (Lane 3) membrane enriched extracts. The samples were electrophoresed using NuPAGE™ Novex™ 4-12% Bis-Tris Protein Gel (Product # NP0322BOX). Resolved proteins were then transferred onto a nitrocellulose membrane (Product # IB23001) by iBlot® 2 Dry Blotting System (Product # IB21001). The blot was probed with Anti-N-cadherin Monoclonal Antibody (CH-19) (Product # MA1-91128, 1:500 dilution) and Goat anti-Mouse IgG (H+L) Superclonal™ Recombinant Secondary Antibody, HRP (Product # A28177, 1:5000 dilution) using the iBright FL 1000 (Product # A32752). Chemiluminescent detection was performed using Novex® ECL Chemiluminescent Substrate Reagent Kit (Product # WP20005). Loss of signal upon CRISPR mediated knockout (KO) using the LentiArray™ CRISPR product line confirms that antibody is specific to N-cadherin.

- Submitted by
- Invitrogen Antibodies (provider)
- Main image

- Experimental details
- Western Blot analysis of N-cadherin was performed by loading MDBK cell lysate. Proteins were transferred to a membrane and probed with a N-cadherin Monoclonal Antibody (CH-19) (Product # MA1-91128) at a dilution of 1:2000.

- Submitted by
- Invitrogen Antibodies (provider)
- Main image
- Experimental details
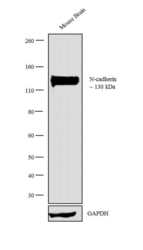
- Western blot analysis was performed on tissue extract (30 µg lysate) of Mouse Brain (Lane 1). The blot was probed with Anti-N-cadherin Monoclonal Antibody (Product # MA1-91128, 1:500 dilution) and detected by chemiluminescence using Goat anti-Mouse IgG (H+L) Superclonal™ Secondary Antibody, HRP conjugate (Product # A28177, 0.25 µg/mL, 1:4000 dilution). A 130 kDa band corresponding to N-cadherin was observed in the tissue tested.

Supportive validation
- Submitted by
- Invitrogen Antibodies (provider)
- Main image

- Experimental details
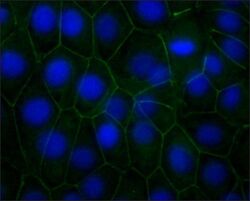
- Immunofluorescence analysis of N-cadherin was performed using 90% confluent log phase SH-SY5Y cells. The cells were fixed with 4% paraformaldehyde for 10 minutes, permeabilized with 0.1% Triton™ X-100 for 15 minutes, and blocked with 1% BSA for 1 hour at room temperature. The cells were labeled with N-cadherin Monoclonal Antibody (CH-19) (Product # MA1-91128) at 1:250 dilution in 0.1% BSA, incubated at 4 degree Celsius overnight and then labeled with Goat anti-Mouse IgG (H+L) Superclonal™ Secondary Antibody, Alexa Fluor® 488 conjugate (Product # A28175) at a dilution of 1:2000 for 45 minutes at room temperature (Panel a: green). Nuclei (Panel b: blue) were stained with SlowFade® Gold Antifade Mountant with DAPI (Product # S36938). F-actin (Panel c: red) was stained with Rhodamine Phalloidin (Product # R415, 1:300). Panel d represents the merged image showing membranous localization. Panel e represents control cells with no primary antibody to assess background. The images were captured at 60X magnification.

- Submitted by
- Invitrogen Antibodies (provider)
- Main image
- Experimental details
- Immunocytochemistry-Immunofluorescence analysis of N-cadherin in MDBK cells using N-cadherin Monoclonal Antibody (CH-19) (Product # MA1-91128) at 1:500(green) with DAPI(blue). Cells were fixed and permeabilized with cold methanol followed by acetone.

Supportive validation
- Submitted by
- Invitrogen Antibodies (provider)
- Main image

- Experimental details
- Immunohistochemistry (Paraffin) analysis of N-cadherin in chicken heart tissue using N-cadherin Monoclonal Antibody (CH-19) (Product # MA1-91128) at a dilution of 1:500.

Supportive validation
- Submitted by
- Invitrogen Antibodies (provider)
- Main image

- Experimental details
- Figure 1 Myelin protein levels in the cortex in wildtype and St8sia2 -/- mice. Representative Western blots and densitometric analyses of MBP, CNP, MOG, PLP1, and MOBP levels in the cortex in St8sia2 +/+ and St8sia2 -/- mice on P15, P30, and P90. The band intensity was normalized to pan-Cadherin (CDH). Each dot represents one animal. The mean for the control is set as 1. The data are expressed as mean +- SD. * P

- Submitted by
- Invitrogen Antibodies (provider)
- Main image

- Experimental details
- Figure 4 The levels of Neurofilament and the axonal degeneration marker pMAPT in the cortex in wildtype and St8sia2 -/- mice. A : Immunohistochemical staining for NEF on coronal brain sections on P30. n = 4. B : Representative Western blots and ( C ) densitometric analyses of NEF isoforms and pMAPT (pTAU) in the cortex in St8sia2 +/+ and St8sia2 -/- mice on P15, P30, and P90. The band intensity was normalized to pan-Cadherin (CDH). Each dot represents one animal. The mean for the control is set as 1. The data are expressed as mean +- SD. I, molecular layer of cortex; II, external granular layer of cortex. ** P

- Submitted by
- Invitrogen Antibodies (provider)
- Main image

- Experimental details
- Figure 6 Expression of the pan-oligodendroglia marker OLIG2 in the cortex and corpus callosum in wildtype and St8sia2 -/- mice. A : Representative Western blots and densitometric analyses of OLIG2 levels in the cortex in St8sia2 +/+ and St8sia2 -/- mice on P15, P30, and P90. The band intensity was normalized to pan-Cadherin (CDH). Each dot represents one animal. The mean for the control is set as 1. The data are expressed as mean +- SD. B : Immunohistochemical staining for OLIG2 on coronal brain sections and ( C, D ) analysis of the number of OLIG2+ cells in the cortex and corpus callosum on P30 St8sia2 +/+ and St8sia2 -/- mice. Scale bar = 100 mum. n = 5. The data are expressed as mean +- SD. * P

- Submitted by
- Invitrogen Antibodies (provider)
- Main image

- Experimental details
- Figure 9 Expression of differentiation markers in wildtype and St8sia2 -/- oligodendroglia in vitro during spontaneous and induced differentiation. A : The spontaneous differentiation of St8sia2 +/+ and St8sia2 -/- OPCs under maintenance conditions (PDGF-AA/bFGF) was analyzed using immunofluorescence. The cells were labeled with anti-MBP antibody (green), and the nuclei were counterstained with DAPI. Representative photographs of St8sia2 +/+ and St8sia2 -/- OPCs from one of three experiments are shown. Scale bar = 50 mum. B : The number of MBP+ cells from 51 fields of view for each genotype were calculated for three independent OPC cultures. The quantification data are expressed as mean +- SD. n = 6. ( C ) Real-time PCR analysis of Mbp , Plp1 , Mag , and Olig2 expression in St8sia2 +/+ and St8sia2 -/- OPC cultures grown in medium supplemented with 3,3',5-triiodo-L-thyronine (T3; differentiation conditions). The results are expressed relative to the level of Gapdh expression. The mean for the control is set as 1 for each transcript. The data are expressed as mean +- SD. n = 7. D : Immunofluorescence analysis of PDGFRalpha and OLIG1 in OPCs under maintenance conditions in medium supplemented with PDGF-AA/bFGF. The cells were labeled with anti-OLIG1 antibody (red) and anti-PDGFRalpha antibody (green). Nuclei were counterstained with DAPI (blue). Representative photographs of St8sia2 +/+ and St8sia2 -/- OPCs from one of six experiments are shown. Scale bar = 50 mum. E : Quan

- Submitted by
- Invitrogen Antibodies (provider)
- Main image

- Experimental details
- 4 FIGURE Ubiquitin-specific peptidase 10 (USP10) knockdown reduces growth and invasiveness of pancreatic adenocarcinoma (PAAD) cells in vitro . (A) viability of Panc-1 and BxPC-1 cells examined using a CTG kit; (B) proliferation rate of the Panc-1 and BxPC-1 cells using the EdU labeling kit; (C) apoptosis of Panc-1 and BxPC-1 cells examined using flow cytometry; (D and E) levels of EMT-related biomarkers ZO-1, E-cadherin, Vimentin, and N-cadherin in Panc-1 and BxPC-1 cells determined by RT-qPCR (D), western blot analysis (E), and immunofluorescence staining (F), respectively; (G and H) migration (G) and invasion (H) ability of Panc-1 and BxPC-1 cells determined by Transwell assays. Differences were analyzed by two-way ANOVA (A-E), ** P < 0.01; *** P < 0.001

- Submitted by
- Invitrogen Antibodies (provider)
- Main image

- Experimental details
- 7 FIGURE Overexpression of Cyr61 restores pancreatic adenocarcinoma (PAAD) cell proliferation in vitro. (A) Viability of Panc-1 and BxPC-1 cells examined using a CellTiter Glo (CTG) kit; (B) proliferation rate of the Panc-1 and BxPC-1 cells using the EdU labeling kit; (C) apoptosis of Panc-1 and BxPC-1 cells examined using flow cytometry; (D-F) levels of EMT-related biomarkers ZO-1, E-cadherin, Vimentin, and N-cadherin in Panc-1 and BxPC-1 cells determined by RT-qPCR (D), western blot analysis (E), and immunofluorescence staining (F), respectively; and (G and H) migration (G) and invasion (H) ability of Panc-1 and BxPC-1 cells determined by Transwell assays. Differences were analyzed by two-way ANOVA (A-G), ** P < 0.01
