 Explore
 Validate
 Learn
Learn Western blot
 Immunoprecipitation
Antibody data
- Antibody Data
- Antigen structure
- References [6]
- Comments [0]
- Validations
- Western blot [4]
- Immunocytochemistry [1]
- Immunohistochemistry [2]
- Other assay [2]
Submit
Validation data
Reference
Comment
Report error
- Product number
- MA1-2002 - Provider product page

- Provider
- Invitrogen Antibodies
- Product name
- N-cadherin Monoclonal Antibody (8C11)
- Antibody type
- Monoclonal
- Antigen
- Other
- Description
- MA1-2002 detects N-Cadherin from human neuronal samples, including SHSY5Y cells. MA1-2002 also detects N-Cadherin in rabbit and hamster brain lysates. MA1-2002 does not detect N-Cadherin in lysates from mouse, rat, pig and cow brain. This antibody is not suitable for mouse C2C12 cell lysates in Western blot analysis. MA1-2002 has been successfully used in Western blot, Immunoprecipitation, IHC (P) and Immunofluorescence applications. By Western blot, this antibody detects N-Cadherin at 130 kDa. This antibody is not suitable for frozen tissues in immunohistochemistry applications. The MA1-2002 immunogen is a bacterial fusion protein to the extracellular domain of N-cadherin (a domain between EC3 and EC4, amino acid residues 92-593 from human N-cadherin).
- Reactivity
- Human, Mouse, Hamster, Rabbit
- Host
- Mouse
- Isotype
- IgG
- Antibody clone number
- 8C11
- Vial size
- 100 µg
- Concentration
- 1 mg/mL
- Storage
- -20° C, Avoid Freeze/Thaw Cycles
Submitted references Exosome-mediated mRNA delivery in vivo is safe and can be used to induce SARS-CoV-2 immunity.
The Motility and Mesenchymal Features of Breast Cancer Cells Correlate with the Levels and Intracellular Localization of Transglutaminase Type 2.
A mechanically active heterotypic E-cadherin/N-cadherin adhesion enables fibroblasts to drive cancer cell invasion.
Control of cell-cell forces and collective cell dynamics by the intercellular adhesome.
Distinct PTPmu-associated signaling molecules differentially regulate neurite outgrowth on E-, N-, and R-cadherin.
N-cadherin-catenin complexes form prior to cleavage of the proregion and transport to the plasma membrane.
Tsai SJ, Atai NA, Cacciottolo M, Nice J, Salehi A, Guo C, Sedgwick A, Kanagavelu S, Gould SJ
The Journal of biological chemistry 2021 Nov;297(5):101266
The Journal of biological chemistry 2021 Nov;297(5):101266
The Motility and Mesenchymal Features of Breast Cancer Cells Correlate with the Levels and Intracellular Localization of Transglutaminase Type 2.
Bianchi N, Brugnoli F, Grassilli S, Bourgeois K, Keillor JW, Bergamini CM, Aguiari G, Volinia S, Bertagnolo V
Cells 2021 Nov 6;10(11)
Cells 2021 Nov 6;10(11)
A mechanically active heterotypic E-cadherin/N-cadherin adhesion enables fibroblasts to drive cancer cell invasion.
Labernadie A, Kato T, Brugués A, Serra-Picamal X, Derzsi S, Arwert E, Weston A, González-Tarragó V, Elosegui-Artola A, Albertazzi L, Alcaraz J, Roca-Cusachs P, Sahai E, Trepat X
Nature cell biology 2017 Mar;19(3):224-237
Nature cell biology 2017 Mar;19(3):224-237
Control of cell-cell forces and collective cell dynamics by the intercellular adhesome.
Bazellières E, Conte V, Elosegui-Artola A, Serra-Picamal X, Bintanel-Morcillo M, Roca-Cusachs P, Muñoz JJ, Sales-Pardo M, Guimerà R, Trepat X
Nature cell biology 2015 Apr;17(4):409-20
Nature cell biology 2015 Apr;17(4):409-20
Distinct PTPmu-associated signaling molecules differentially regulate neurite outgrowth on E-, N-, and R-cadherin.
Oblander SA, Brady-Kalnay SM
Molecular and cellular neurosciences 2010 May;44(1):78-93
Molecular and cellular neurosciences 2010 May;44(1):78-93
N-cadherin-catenin complexes form prior to cleavage of the proregion and transport to the plasma membrane.
Wahl JK 3rd, Kim YJ, Cullen JM, Johnson KR, Wheelock MJ
The Journal of biological chemistry 2003 May 9;278(19):17269-76
The Journal of biological chemistry 2003 May 9;278(19):17269-76
No comments: Submit comment
Supportive validation
- Submitted by
- Invitrogen Antibodies (provider)
- Main image

- Experimental details
- Western blot analysis of Cadherin N was performed by loading 25 µg of Hela (Lane 1), HUVEC (Lane 2), and C2C12 cell lysates (Lane 3) and a molecular weight protein ladder onto an SDS polyacrylamide gel. Proteins were transferred to a PVDF membrane and blocked with a blocking buffer at 4ºC overnight. The membrane was probed with a Cadherin N monoclonal antibody (Product # MA1-2002) at a dilution of 1:1000 (Hela) and 1:500 (HUVEC and C2C12) overnight at 4°C, washed in TBST, and probed with an HRP-conjugated secondary antibody for 1 hr at room temperature in the dark. Chemiluminescent detection was performed using Pierce ECL Plus Western Blotting Substrate (Product # 32132). Results show a band at 140 kDa in Hela and Huvec cell lines.

- Submitted by
- Invitrogen Antibodies (provider)
- Main image

- Experimental details
- Knockout of N-cadherin was achieved by CRISPR-Cas9 genome editing using LentiArray™ Lentiviral sgRNA (Product # A32042, Assay ID CRISPR914282_LV) and LentiArray Cas9 Lentivirus (Product # A32064). Western blot analysis of N-cadherin was performed by loading 30 µg of SHSY5Y Wild Type (Lane 1), SHSY5Y Cas9 (Lane 2) andSHSY5Y N-Cadherin KO (Lane 3) membrane enriched extracts. The samples were electrophoresed using NuPAGE™ Novex™ 4-12% Bis-Tris Protein Gel (Product # NP0322BOX). Resolved proteins were then transferred onto a nitrocellulose membrane (Product # IB23001) by iBlot® 2 Dry Blotting System (Product # IB21001). The blot was probed with Anti-N-cadherin Monoclonal Antibody (8C11) (Product # MA1-2002, 1:1000 dilution) and Goat anti-Mouse IgG (H+L) Superclonal™ Recombinant Secondary Antibody, HRP (Product # A28177, 1:5000 dilution) using the iBright FL 1000 (Product # A32752). Chemiluminescent detection was performed using Novex® ECL Chemiluminescent Substrate Reagent Kit (Product # WP20005). Loss of signal upon CRISPR mediated knockout (KO) using the LentiArray™ CRISPR product line confirms that antibody is specific to N-cadherin.

- Submitted by
- Invitrogen Antibodies (provider)
- Main image

- Experimental details
- Western Blot was performed using Anti-N-cadherin Monoclonal Antibody (8C11) (Product # MA1-2002) and a 130 kDa band corresponding to Cadherin-2 was observed across positive cell lines (HeLa, IMR-32 and Hep G2) and not in negative cell lines (MCF7 and BeWo). Membrane enriched scraped extracts (30 µg lysate) of HeLa (Lane 1), IMR-32 (Lane 2), MCF7 (Lane 3), Hep G2 (Lane 4) and BeWo (Lane 5) were electrophoresed using NuPAGE™ 4-12% Bis-Tris Protein Gel (Product # NP0321BOX). Resolved proteins were then transferred onto a Nitrocellulose membrane (Product # IB23001) by iBlot® 2 Dry Blotting System (Product # IB21001). The Blot was probed with the primary antibody (1:1000 dilution) and detected by chemiluminescence with Goat anti-Mouse IgG (H+L) Superclonal™ Recombinant Secondary Antibody, HRP (Product # A28177, 1:4000 dilution) using the iBright FL 1000 (Product # A32752). Chemiluminescent detection was performed using Novex® ECL Chemiluminescent Substrate Reagent Kit (Product # WP20005).

- Submitted by
- Invitrogen Antibodies (provider)
- Main image
- Experimental details
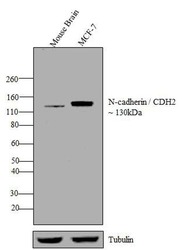
- Western blot analysis was performed on tissue lysate and whole cell extract (30 µg) of Mouse Brain (Lane 1) and MCF-7 (Lane 2). The blots were probed with N-cadherin/CDH2 Mouse monoclonal Antibody (Product # MA1-2002, 1 in 1000 dilution) and detected by chemiluminescence using Goat anti-Mouse IgG (H+L) Superclonal™ Secondary Antibody, HRP conjugate (Product # A28177, 0.4 µg/mL, 1:2500 dilution). A ~ 130 kDa band corresponding to N-cadherin/CDH2 was observed across all tissues and cell lines tested. Known quantity of protein samples were electrophoresed using Novex® NuPAGE® 4-12 % Bis-Tris gel (Product # NP0321BOX), XCell SureLock™ Electrophoresis System (Product # EI0002) and Novex® Sharp Pre-Stained Protein Standard (Product # LC5800). Resolved proteins were then transferred onto a nitrocellulose membrane by overnight transfer method. The membrane was probed with the relevant primary and secondary Antibody following blocking with 5 % skimmed milk. Chemiluminescent detection was performed using Pierce™ ECL Western Blotting Substrate (Product # 32106).

Supportive validation
- Submitted by
- Invitrogen Antibodies (provider)
- Main image

- Experimental details
- Immunofluorescent analysis of N-Cadherin in SHSY5Y cells (human neuroblast). Formalin fixed cells were permeabilized with 0.1% Triton X-100 in TBS for 10 minutes at room temperature. Cells were blocked with 1% Blocker BSA (Product # 37525) for 15 minutes at room temperature. Cells were probed without (left panel) or with (right panel) an N-Cadherin monoclonal antibody (Product # MA1-2002) at a dilution of 1:100 for at least 1 hour at room temperature, washed with PBS, and incubated with a DyLight 488-conjugated goat anti-mouse IgG secondary antibody (Product # 35502). F-Actin (red) was stained with DyLight-554 Phalloidin (Product # 21834) and nuclei (blue) were stained with Hoechst 33342 dye (Product # 62249). Images were taken on a Thermo Scientific ToxInsight at 20X magnification.

Supportive validation
- Submitted by
- Invitrogen Antibodies (provider)
- Main image
- Experimental details
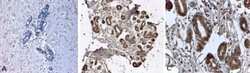
- Immunohistochemistry analysis of N Cadherin showing staining in the cytoplasm of formalin-fixed, paraffin-embedded human breast tissue (B) and magnified section (C) compared with an isotype control (A). To expose target proteins, antigen retrieval was performed using HEIR with a buffer (pH 6.2). Tissues were probed with a CD325/N Cadherin/CDH2 monoclonal antibody (Product # MA1-2002) for 60 minutes at a dilution of 2 µg/mL and detection was performed using an HRP-conjugated detection system for 30 minutes followed by DAB staining.

- Submitted by
- Invitrogen Antibodies (provider)
- Main image
- Experimental details
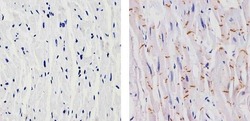
- Immunohistochemistry analysis of N-cadherin showing staining in the membrane of paraffin-embedded human heart tissue (right) compared to a negative control without primary antibody (left). To expose target proteins, antigen retrieval was performed using 10mM sodium citrate (pH 6.0), microwaved for 8-15 min. Following antigen retrieval, tissues were blocked in 3% H2O2-methanol for 15 min at room temperature, washed with ddH2O and PBS, and then probed with a N-cadherin Mouse Monoclonal Antibody (Product # MA1-2002) diluted in 3% BSA-PBS at a dilution of 1:20 for 1 hour at 37ºC in a humidified chamber. Tissues were washed extensively in PBST and detection was performed using an HRP-conjugated secondary antibody followed by colorimetric detection using a DAB kit. Tissues were counterstained with hematoxylin and dehydrated with ethanol and xylene to prep for mounting.

Supportive validation
- Submitted by
- Invitrogen Antibodies (provider)
- Main image

- Experimental details
- Immunoprecipitation of N-Cadherin was performed using SHSY5Y whole cell lysate. Antigen-antibody complexes were formed by incubating 300 µg of lysate with 5 µg of an N-Cadherin monoclonal antibody (Product # MA1-2002) overnight on a rocking platform at 4øC. The immune complexes were captured on 50 µL Protein A/G Agarose (Product # 20421), washed extensively, and eluted with 5X Lane Marker Reducing Sample Buffer (Product # 39000). The sample was resolved on a 4-20% Tris-HCl polyacrylamide gel, transferred to a PVDF membrane, and blocked with 5% BSA/TBS-0.1%Tween for at least 1 hour. The membrane was probed with an N-cadherin monoclonal antibody (Product # MA1-2002) at a dilution of 1:1000 overnight rotating at 4øC, washed in TBST, and probed with Clean-blot IP Detection Reagent (Product # 21230) at a dilution of 1:1000 for at least 1 hour. Chemiluminescent detection was performed using SuperSignal West Pico (Product # 34080).

- Submitted by
- Invitrogen Antibodies (provider)
- Main image

- Experimental details
- Figure 1 Exosome purification and characterization. (A) Schematic describing exosome purification procedure. (B) Size distribution plot of purified exosomes, as determined by NTA. (C) Immunofluorescence image of purified exosomes, labeled with an Alexa Fluor 647-conjugated anti-CD63 monoclonal antibody, captured using the Particle Metrix PMX-220 ZetaView camera. (D) Electron micrograph of negative-stained, purified exosomes. Bar, 100 nm. (E) Immunoblot analysis of equal proportions of 293F cell and exosome lysates using antibodies specific for the exosomal markers CD81, CD9, CD63, E-cadherin (E-cad), N-cadherin (N-cad), GRP78/BiP, calreticulin (CALR), ERGIC-3, GM130, HSP60, and HSP90. The amount and ratio of cell and exosome lysates was selected empirically to show the different enrichment of the CD81, CD9, and CD63 proteins, was kept constant in all immunoblots, by proportion equaled a 10-fold overloading of exosomes relative to cells, and by amount of protein equaled 15 mug cell lysate protein/lane and 0.15 mug exosome lysate protein/lane.
