 Explore
 Validate
 Learn
Learn Western blot
 Immunoprecipitation
Antibody data
- Antibody Data
- Antigen structure
- References [21]
- Comments [0]
- Validations
- Western blot [2]
- Immunocytochemistry [4]
- Immunohistochemistry [1]
- Other assay [27]
Submit
Validation data
Reference
Comment
Report error
- Product number
- PA1-1110 - Provider product page

- Provider
- Invitrogen Antibodies
- Product name
- EGFR Polyclonal Antibody
- Antibody type
- Polyclonal
- Antigen
- Synthetic peptide
- Description
- PA1-1110 detects EGFR from human, non-human primate (monkey), mouse, and rat samples. PA1-1110 has been successfully used in Western blot, immunoprecipitation, immunohistochemistry, and immunofluorescence procedures. By Western blot, this antibody detects ~190 kDa protein representing EGFR from human HeLa cell extract. The PA1-1110 immunogen is a synthetic peptide corresponding to residues C L(1198) R V A P Q S S E F I G A(1210) of human EGFR.
- Reactivity
- Human, Mouse, Rat
- Host
- Rabbit
- Isotype
- IgG
- Vial size
- 100 µg
- Concentration
- 1 mg/mL
- Storage
- -20° C, Avoid Freeze/Thaw Cycles
Submitted references Gefitinib and fostamatinib target EGFR and SYK to attenuate silicosis: a multi-omics study with drug exploration.
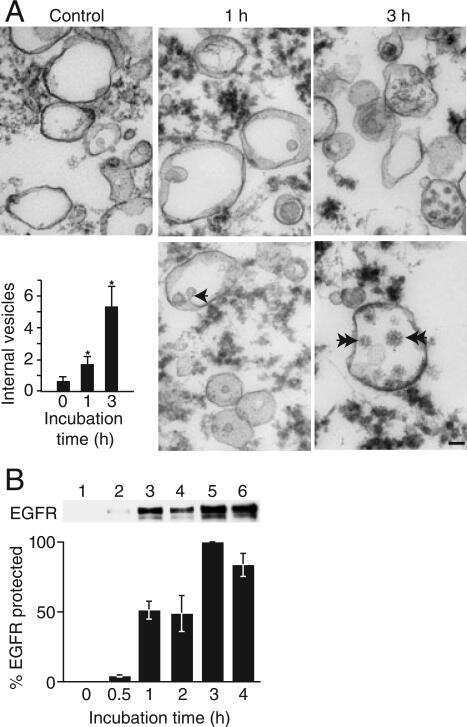
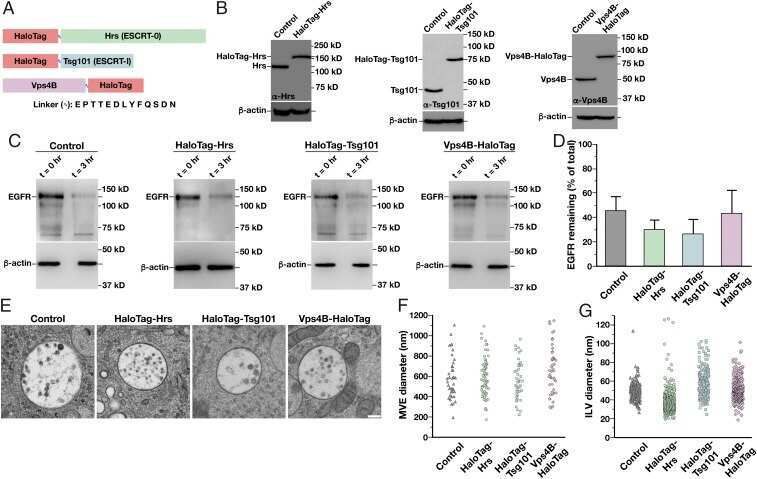
The ESCRT-0 subcomplex component Hrs/Hgs is a master regulator of myogenesis via modulation of signaling and degradation pathways.
The ubiquitin ligase UBE4B regulates amyloid precursor protein ubiquitination, endosomal trafficking, and amyloid β42 generation and secretion.
Chlamydia-induced curvature of the host-cell plasma membrane is required for infection.
Aspirin inhibits hepatocellular carcinoma cell proliferation in vitro and in vivo via inducing cell cycle arrest and apoptosis.
MicroRNA‑128‑b regulates epidermal growth factor receptor expression in non‑small cell lung cancer.
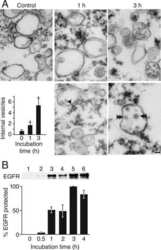
Growth factor stimulation promotes multivesicular endosome biogenesis by prolonging recruitment of the late-acting ESCRT machinery.
Loss of EMILIN-1 Enhances Arteriolar Myogenic Tone Through TGF-β (Transforming Growth Factor-β)-Dependent Transactivation of EGFR (Epidermal Growth Factor Receptor) and Is Relevant for Hypertension in Mice and Humans.
Distinct mechanisms enable inward or outward budding from late endosomes/multivesicular bodies.
Lysyl-tRNA synthetase-expressing colon spheroids induce M2 macrophage polarization to promote metastasis.
Inhibitor of apoptosis proteins are required for effective fusion of autophagosomes with lysosomes.
Production of amphiregulin and recovery from influenza is greater in males than females.
Diamond, graphite, and graphene oxide nanoparticles decrease migration and invasiveness in glioblastoma cell lines by impairing extracellular adhesion.
Acquisition of Rab11 and Rab11-Fip2-A novel strategy for Chlamydia pneumoniae early survival.
Establishment and characterization of rat portal myofibroblast cell lines.
A genetically encoded alkyne directs palladium-mediated protein labeling on live mammalian cell surface.
NT5E mutations that cause human disease are associated with intracellular mistrafficking of NT5E protein.
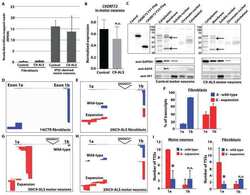
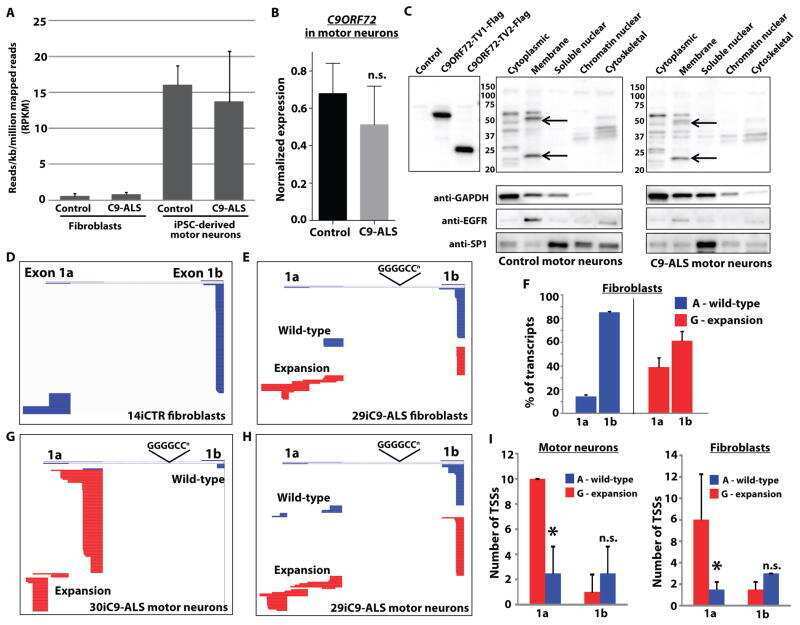
Targeting RNA foci in iPSC-derived motor neurons from ALS patients with a C9ORF72 repeat expansion.
Mitochondrially localized EGFR is independent of its endocytosis and associates with cell viability.
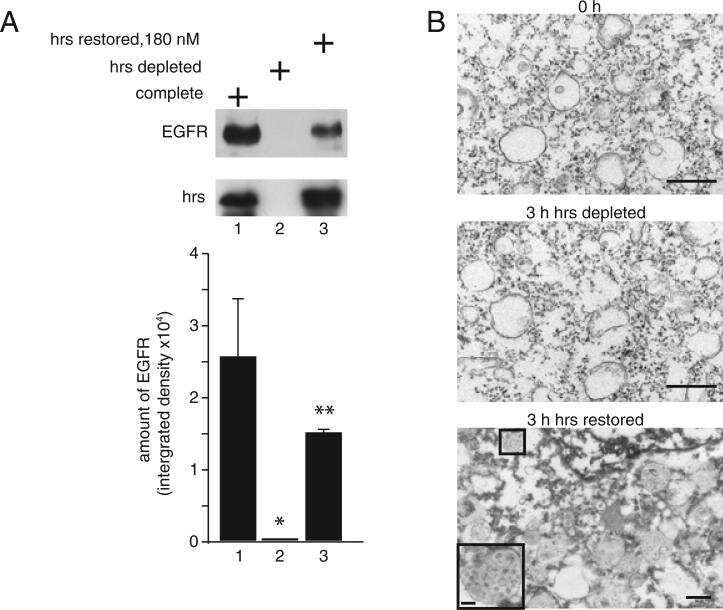
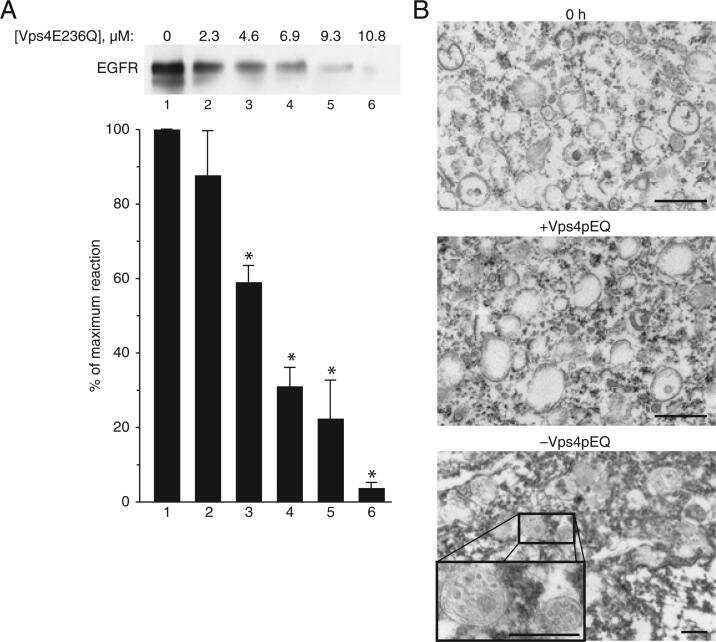
Cell-free reconstitution of multivesicular body formation and receptor sorting.
The UIM domain of Hrs couples receptor sorting to vesicle formation.
Wang M, Zhang Z, Liu J, Song M, Zhang T, Chen Y, Hu H, Yang P, Li B, Song X, Pang J, Xing Y, Cao Z, Guo W, Yang H, Wang J, Yang J, Wang C
Signal transduction and targeted therapy 2022 May 13;7(1):157
Signal transduction and targeted therapy 2022 May 13;7(1):157
The ESCRT-0 subcomplex component Hrs/Hgs is a master regulator of myogenesis via modulation of signaling and degradation pathways.
Coudert L, Osseni A, Gangloff YG, Schaeffer L, Leblanc P
BMC biology 2021 Jul 30;19(1):153
BMC biology 2021 Jul 30;19(1):153
The ubiquitin ligase UBE4B regulates amyloid precursor protein ubiquitination, endosomal trafficking, and amyloid β42 generation and secretion.
Gireud-Goss M, Reyes S, Tewari R, Patrizz A, Howe MD, Kofler J, Waxham MN, McCullough LD, Bean AJ
Molecular and cellular neurosciences 2020 Oct;108:103542
Molecular and cellular neurosciences 2020 Oct;108:103542
Chlamydia-induced curvature of the host-cell plasma membrane is required for infection.
Hänsch S, Spona D, Murra G, Köhrer K, Subtil A, Furtado AR, Lichtenthaler SF, Dislich B, Mölleken K, Hegemann JH
Proceedings of the National Academy of Sciences of the United States of America 2020 Feb 4;117(5):2634-2644
Proceedings of the National Academy of Sciences of the United States of America 2020 Feb 4;117(5):2634-2644
Aspirin inhibits hepatocellular carcinoma cell proliferation in vitro and in vivo via inducing cell cycle arrest and apoptosis.
Shi T, Fujita K, Gong J, Nakahara M, Iwama H, Liu S, Yoneyama H, Morishita A, Nomura T, Tani J, Takuma K, Tadokoro T, Himoto T, Oura K, Tsutsui K, Kobara H, Masaki T
Oncology reports 2020 Aug;44(2):457-468
Oncology reports 2020 Aug;44(2):457-468
MicroRNA‑128‑b regulates epidermal growth factor receptor expression in non‑small cell lung cancer.
Li L, Wang D
Molecular medicine reports 2019 Dec;20(6):4803-4810
Molecular medicine reports 2019 Dec;20(6):4803-4810
Growth factor stimulation promotes multivesicular endosome biogenesis by prolonging recruitment of the late-acting ESCRT machinery.
Quinney KB, Frankel EB, Shankar R, Kasberg W, Luong P, Audhya A
Proceedings of the National Academy of Sciences of the United States of America 2019 Apr 2;116(14):6858-6867
Proceedings of the National Academy of Sciences of the United States of America 2019 Apr 2;116(14):6858-6867
Loss of EMILIN-1 Enhances Arteriolar Myogenic Tone Through TGF-β (Transforming Growth Factor-β)-Dependent Transactivation of EGFR (Epidermal Growth Factor Receptor) and Is Relevant for Hypertension in Mice and Humans.
Carnevale D, Facchinello N, Iodice D, Bizzotto D, Perrotta M, De Stefani D, Pallante F, Carnevale L, Ricciardi F, Cifelli G, Da Ros F, Casaburo M, Fardella S, Bonaldo P, Innocenzi G, Rizzuto R, Braghetta P, Lembo G, Bressan GM
Arteriosclerosis, thrombosis, and vascular biology 2018 Oct;38(10):2484-2497
Arteriosclerosis, thrombosis, and vascular biology 2018 Oct;38(10):2484-2497
Distinct mechanisms enable inward or outward budding from late endosomes/multivesicular bodies.
Gireud-Goss M, Reyes S, Wilson M, Farley M, Memarzadeh K, Srinivasan S, Sirisaengtaksin N, Yamashita S, Tsunoda S, Lang FF, Waxham MN, Bean AJ
Experimental cell research 2018 Nov 1;372(1):1-15
Experimental cell research 2018 Nov 1;372(1):1-15
Lysyl-tRNA synthetase-expressing colon spheroids induce M2 macrophage polarization to promote metastasis.
Nam SH, Kim D, Lee D, Lee HM, Song DG, Jung JW, Kim JE, Kim HJ, Kwon NH, Jo EK, Kim S, Lee JW
The Journal of clinical investigation 2018 Nov 1;128(11):5034-5055
The Journal of clinical investigation 2018 Nov 1;128(11):5034-5055
Inhibitor of apoptosis proteins are required for effective fusion of autophagosomes with lysosomes.
Gradzka S, Thomas OS, Kretz O, Haimovici A, Vasilikos L, Wong WW, Häcker G, Gentle IE
Cell death & disease 2018 May 1;9(5):529
Cell death & disease 2018 May 1;9(5):529
Production of amphiregulin and recovery from influenza is greater in males than females.
Vermillion MS, Ursin RL, Kuok DIT, Vom Steeg LG, Wohlgemuth N, Hall OJ, Fink AL, Sasse E, Nelson A, Ndeh R, McGrath-Morrow S, Mitzner W, Chan MCW, Pekosz A, Klein SL
Biology of sex differences 2018 Jul 17;9(1):24
Biology of sex differences 2018 Jul 17;9(1):24
Diamond, graphite, and graphene oxide nanoparticles decrease migration and invasiveness in glioblastoma cell lines by impairing extracellular adhesion.
Wierzbicki M, Jaworski S, Kutwin M, Grodzik M, Strojny B, Kurantowicz N, Zdunek K, Chodun R, Chwalibog A, Sawosz E
International journal of nanomedicine 2017;12:7241-7254
International journal of nanomedicine 2017;12:7241-7254
Acquisition of Rab11 and Rab11-Fip2-A novel strategy for Chlamydia pneumoniae early survival.
Mölleken K, Hegemann JH
PLoS pathogens 2017 Aug;13(8):e1006556
PLoS pathogens 2017 Aug;13(8):e1006556
Establishment and characterization of rat portal myofibroblast cell lines.
Fausther M, Goree JR, Lavoie ÉG, Graham AL, Sévigny J, Dranoff JA
PloS one 2015;10(3):e0121161
PloS one 2015;10(3):e0121161
A genetically encoded alkyne directs palladium-mediated protein labeling on live mammalian cell surface.
Li N, Ramil CP, Lim RK, Lin Q
ACS chemical biology 2015 Feb 20;10(2):379-84
ACS chemical biology 2015 Feb 20;10(2):379-84
NT5E mutations that cause human disease are associated with intracellular mistrafficking of NT5E protein.
Fausther M, Lavoie EG, Goree JR, Baldini G, Dranoff JA
PloS one 2014;9(6):e98568
PloS one 2014;9(6):e98568
Targeting RNA foci in iPSC-derived motor neurons from ALS patients with a C9ORF72 repeat expansion.
Sareen D, O'Rourke JG, Meera P, Muhammad AK, Grant S, Simpkinson M, Bell S, Carmona S, Ornelas L, Sahabian A, Gendron T, Petrucelli L, Baughn M, Ravits J, Harms MB, Rigo F, Bennett CF, Otis TS, Svendsen CN, Baloh RH
Science translational medicine 2013 Oct 23;5(208):208ra149
Science translational medicine 2013 Oct 23;5(208):208ra149
Mitochondrially localized EGFR is independent of its endocytosis and associates with cell viability.
Yao Y, Wang G, Li Z, Yan B, Guo Y, Jiang X, Xi Z
Acta biochimica et biophysica Sinica 2010 Nov;42(11):763-70
Acta biochimica et biophysica Sinica 2010 Nov;42(11):763-70
Cell-free reconstitution of multivesicular body formation and receptor sorting.
Sun W, Vida TA, Sirisaengtaksin N, Merrill SA, Hanson PI, Bean AJ
Traffic (Copenhagen, Denmark) 2010 Jun;11(6):867-76
Traffic (Copenhagen, Denmark) 2010 Jun;11(6):867-76
The UIM domain of Hrs couples receptor sorting to vesicle formation.
Urbé S, Sachse M, Row PE, Preisinger C, Barr FA, Strous G, Klumperman J, Clague MJ
Journal of cell science 2003 Oct 15;116(Pt 20):4169-79
Journal of cell science 2003 Oct 15;116(Pt 20):4169-79
No comments: Submit comment
Supportive validation
- Submitted by
- Invitrogen Antibodies (provider)
- Main image

- Experimental details
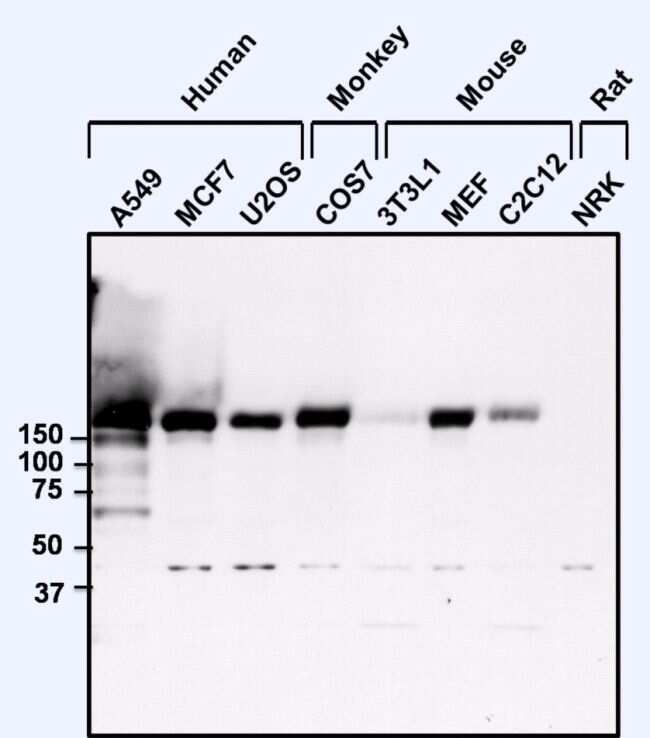
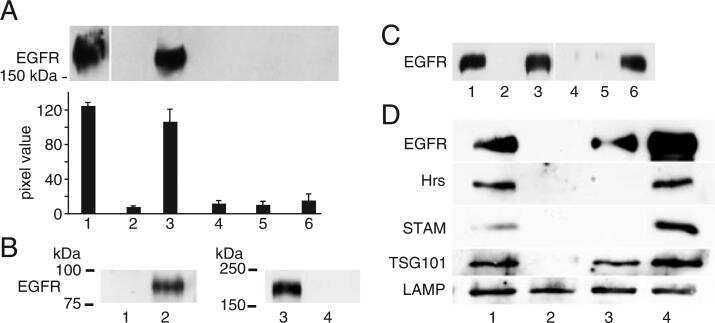
- Western blot analysis of EGFR was performed by loading 25 µg of various whole cell lysates onto a 4-20% Tris-HCl polyacrylamide gel. Proteins were transferred to a PVDF membrane and blocked with 5% Milk/TBST for at least 1 hour. Membranes were probed with a rabbit polyclonal antibody recognizing EGFR (Product # PA1-1110) at a dilution of 1:500 overnight at 4°C on a rocking platform. Membranes were washed in TBS-0.1%Tween 20 and probed with a goat anti-rabbit-HRP secondary antibody (Product # 31460) at a dilution of 1:20,000 for at least one hour. Membranes were washed and chemiluminescent detection performed using Pierce Super Signal West Pico (Product # 34077).
- Submitted by
- Invitrogen Antibodies (provider)
- Main image

- Experimental details
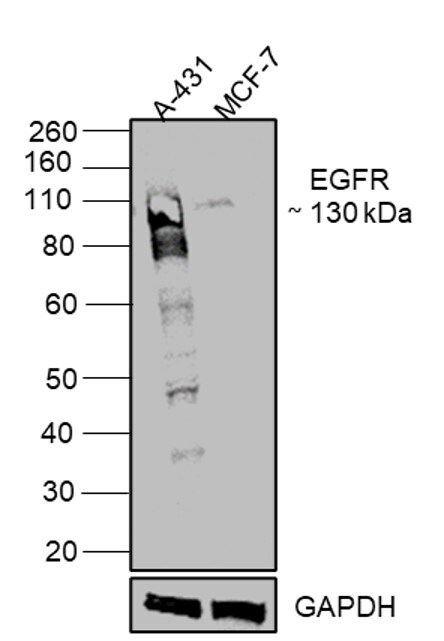
- Western blot was performed using Anti-EGFR Polyclonal Antibody (Product # PA1-1110) and a 130 kDa band corresponding to EGFR was observed across cell lines tested. Membrane enriched extracts (30 µg lysate) of A-431 (Lane 1) and MCF-7 (Lane 2) were electrophoresed using NuPAGE™ 4-12% Bis-Tris Protein Gel (Product # NP0321BOX). Resolved proteins were then transferred onto a nitrocellulose membrane (Product # IB23001) by iBlot® 2 Dry Blotting System (Product # IB21001). The blot was probed with the primary antibody (1:500 dilution) and detected by chemiluminescence with Goat anti-Rabbit IgG (H+L) Superclonal™ Recombinant Secondary Antibody, HRP (Product # A27036,1:4000 dilution) using the iBright™ FL1500 Imaging System (Product # A44115). Chemiluminescentdetection was performed using Novex® ECL Chemiluminescent Substrate Reagent Kit (Product # WP20005).
Supportive validation
- Submitted by
- Invitrogen Antibodies (provider)
- Main image
- Experimental details
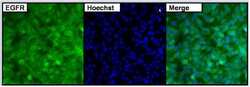
- Immunofluorescent analysis of EGFR (green) in untreated HeLa cells. Formalin fixed cells were permeabilized with 0.1% Triton X-100 in TBS for 15 minutes at room temperature. Cells were then blocked with 5% normal goat serum (Product # 31873) for 15 minutes at room temperature. Cells were probed with a rabbit polyclonal antibody recognizing EGFR (Product # PA1-1110), at a dilution of 1:500 for at least 1 hour at room temperature. Cells were washed with PBS and incubated with DyLight 488 goat-anti-rabbit secondary antibody at a dilution of 1:400 for 30 minutes at room temperature. Nuclei were stained with Hoechst 33342 dye (Product # 62249). Images were taken on a Thermo Scientific ArrayScan at 20X magnification.
- Submitted by
- Invitrogen Antibodies (provider)
- Main image
- Experimental details
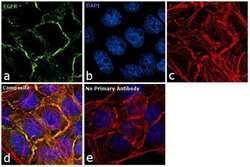
- Immunofluorescence analysis of EGFR was performed using 90% confluent log phase A431 cells. The cells were fixed with 4% paraformaldehyde for 10 minutes, permeabilized with 0.1% Triton™ X-100 for 10 minutes, and blocked with 1% BSA for 1 hour at room temperature. The cells were labeled with EGFR Rabbit Polyclonal antibody (Product # PA1-1110) at 1 µg/mL dilution in 0.1% BSA and incubated for 3 hours at room temperature and then labeled with Goat anti-Rabbit IgG (H+L) Superclonal™ Secondary Antibody, Alexa Fluor® 488 conjugate (Product # A27034) at a dilution of 1:2000 for 45 minutes at room temperature (Panel a: green). Nuclei (Panel b: blue) were stained with SlowFade® Gold Antifade Mountant with DAPI (Product # S36938). F-actin (Panel c: red) was stained with Rhodamine Phalloidin (Product # R415, 1:300). Panel d represents the merged image showing membrane localization. Panel e shows the no primary antibody control. The images were captured at 60X magnification.
- Submitted by
- Invitrogen Antibodies (provider)
- Main image

- Experimental details
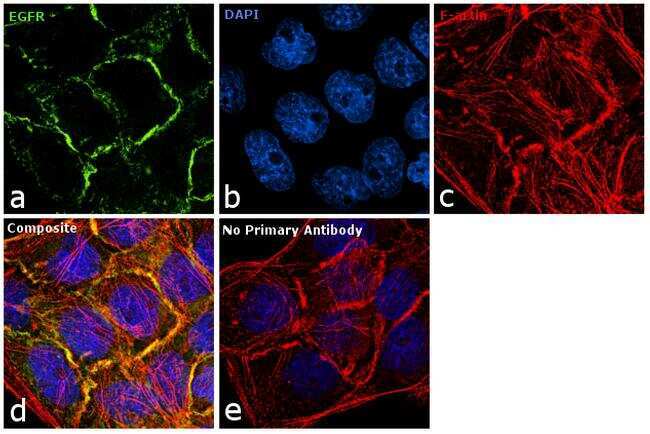
- Knockdown of EGFR was achieved by transfecting A431 cells with EGFR specific siRNA (Silencer® select Product # s563, s564 and s565). Immunofluorescence analysis was performed on A431 cells (untransfected, panel a,d), transfected with non-specific scrambled siRNA (panels b,e) and transfected with EGFR specific siRNA (panel c,f) Cells were fixed, permeabilized, and labelled with EGFR Rabbit polyclonal Antibody (Product # PA1-1110, 5 µg/mL), followed by Goat anti-Rabbit IgG (H+L) Superclonal™ Secondary Antibody, Alexa Fluor® 488 conjugate (Product # A27034, 1:2000). Nuclei (blue) were stained using SlowFade® Gold Antifade Mountant with DAPI (Product # S36938), and Rhodamine Phalloidin (Product # R415, 1:300) was used for cytoskeletal F-actin (red) staining. Loss of signal was observed upon siRNA mediated knockdown (panel c,f) confirming specificity of the antibody to EGFR (green). The images were captured at 60X magnification.
- Submitted by
- Invitrogen Antibodies (provider)
- Main image
- Experimental details
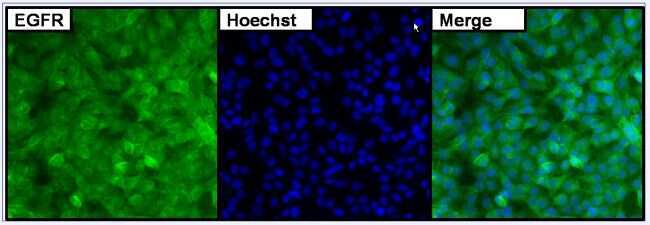
- Immunofluorescence staining of EGFR in HeLa cells using Product # PA1-1110.

Supportive validation
- Submitted by
- Invitrogen Antibodies (provider)
- Main image
- Experimental details
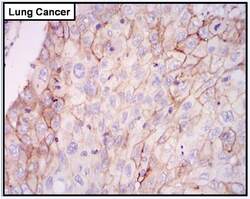
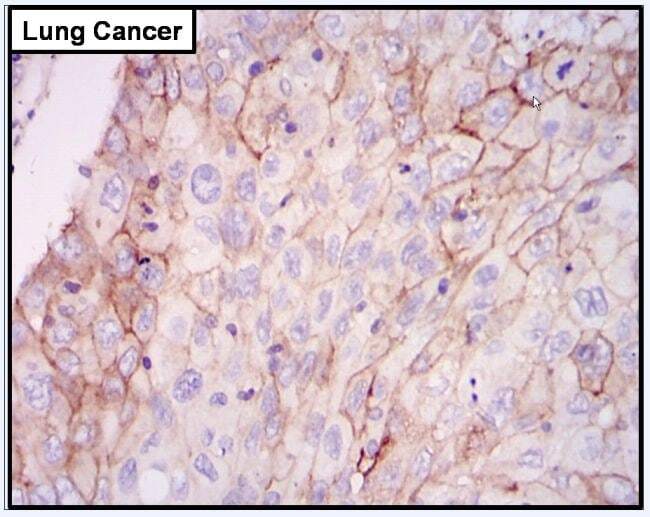
- Immunohistochemistry was performed on cancer biopsies of deparaffinized human Lung cancer tissue. To expose target proteins high pressure heat induced antigen retrieval was performed using 10mM sodium citrate (pH6.0) buffer for 20 minutes. Following antigen retrieval endogenous peroxidase activity was quenched with 3% hydrogen peroxide for 10 minutes at room-temp. Tissues were then washed in PBS and blocked in 10% normal goat serum for 20 minutes at room temperature. Tissues were probed at a dilution of 1:200 with a rabbit polyclonal antibody recognizing EGFR (Product # PA1-1110) overnight at 4°C in a humidified chamber. Tissues were washed extensively with PBS. Colorimetric detection was performed using metal enhanced DAB. Image is displayed at 40X magnification. Results demonstrate strong membranous localization of EGFR.
Supportive validation
- Submitted by
- Invitrogen Antibodies (provider)
- Main image
- Experimental details
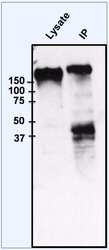
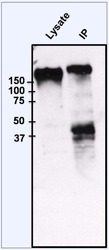
- Immunoprecipitation of EGFR was performed on HeLa cells. The antigen:antibody complex was formed by incubating 750 µg whole cell lysate with 2 µg of rabbit polyclonal antibody recognizing EGFR (Product # PA1-1110) overnight on a rocking platform at 4°C. The immune-complex was then captured on 50 µL Protein A/G Plus Agarose (Product # 20423). Captured immune-complexes were then washed extensively and proteins eluted with 5X Reducing Sample Loading Dye (Product # 39000). Samples were then resolved on a 4-20% Tris-HCl polyacrylamide gel. Proteins were transferred to PVDF membrane and blocked with 5% Milk/TBS-0.1%Tween for at least 1 hour. Membranes were then probed with a rabbit polyclonal antibody recognizing EGFR (Product # PA1-1110) at a dilution of 1:1000 overnight rotating at 4°C. Membranes were washed in TBST and probed with Clean Blot IP Detection reagent (Product # 21230) at a dilution of 1:2000 for at least one hour. Membranes were washed and chemiluminescent detection performed using Pierce Super Signal West Dura (Product # 34075).
- Submitted by
- Invitrogen Antibodies (provider)
- Main image
- Experimental details
- NULL

- Submitted by
- Invitrogen Antibodies (provider)
- Main image
- Experimental details
- NULL
- Submitted by
- Invitrogen Antibodies (provider)
- Main image

- Experimental details
- NULL
- Submitted by
- Invitrogen Antibodies (provider)
- Main image
- Experimental details
- NULL
- Submitted by
- Invitrogen Antibodies (provider)
- Main image

- Experimental details
- NULL
- Submitted by
- Invitrogen Antibodies (provider)
- Main image

- Experimental details
- NULL
- Submitted by
- Invitrogen Antibodies (provider)
- Main image

- Experimental details
- NULL
- Submitted by
- Invitrogen Antibodies (provider)
- Main image
- Experimental details
- NULL
- Submitted by
- Invitrogen Antibodies (provider)
- Main image
- Experimental details
- NULL
- Submitted by
- Invitrogen Antibodies (provider)
- Main image
- Experimental details
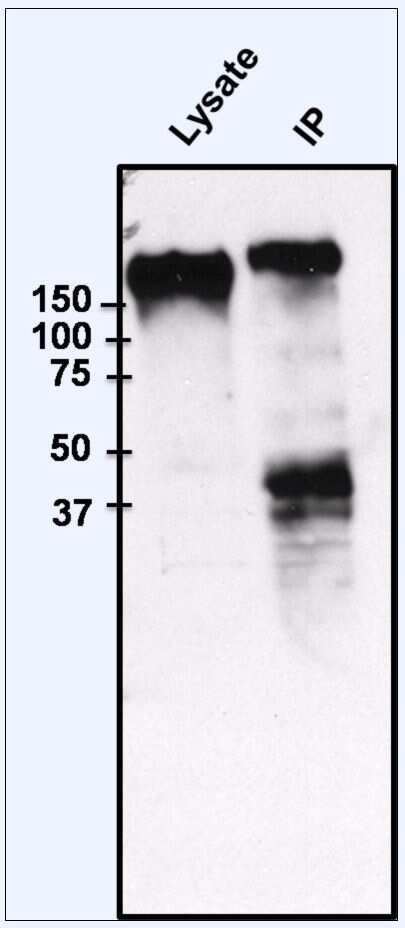
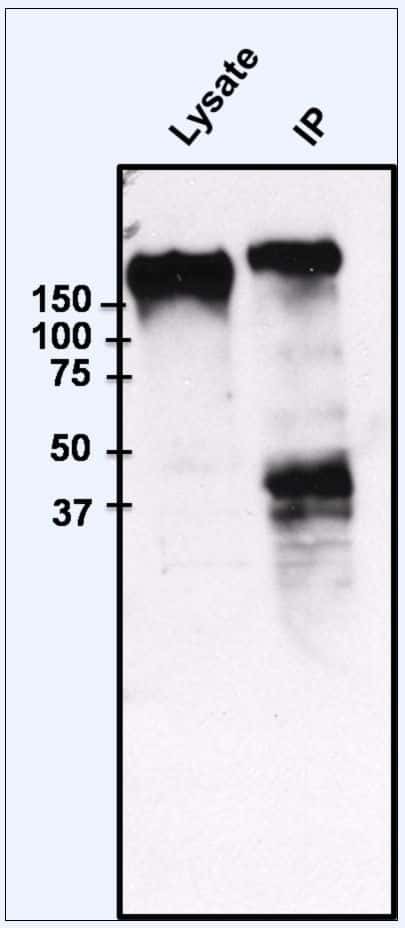
- Immunoprecipitation of EGFR was performed on HeLa cells. The antigen:antibody complex was formed by incubating 750 µg whole cell lysate with 2 µg of rabbit polyclonal antibody recognizing EGFR (Product # PA1-1110) overnight on a rocking platform at 4øC. The immune-complex was then captured on 50 µL Protein A/G Plus Agarose (Product # 20423). Captured immune-complexes were then washed extensively and proteins eluted with 5X Reducing Sample Loading Dye (Product # 39000). Samples were then resolved on a 4-20% Tris-HCl polyacrylamide gel. Proteins were transferred to PVDF membrane and blocked with 5% Milk/TBS-0.1%Tween for at least 1 hour. Membranes were then probed with a rabbit polyclonal antibody recognizing EGFR (Product # PA1-1110) at a dilution of 1:1000 overnight rotating at 4øC. Membranes were washed in TBST and probed with Clean Blot IP Detection reagent (Product # 21230) at a dilution of 1:2000 for at least one hour. Membranes were washed and chemiluminescent detection performed using Pierce Super Signal West Dura (Product # 34075).
- Submitted by
- Invitrogen Antibodies (provider)
- Main image
- Experimental details
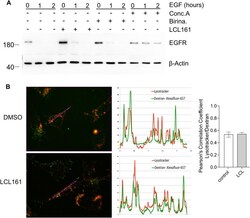
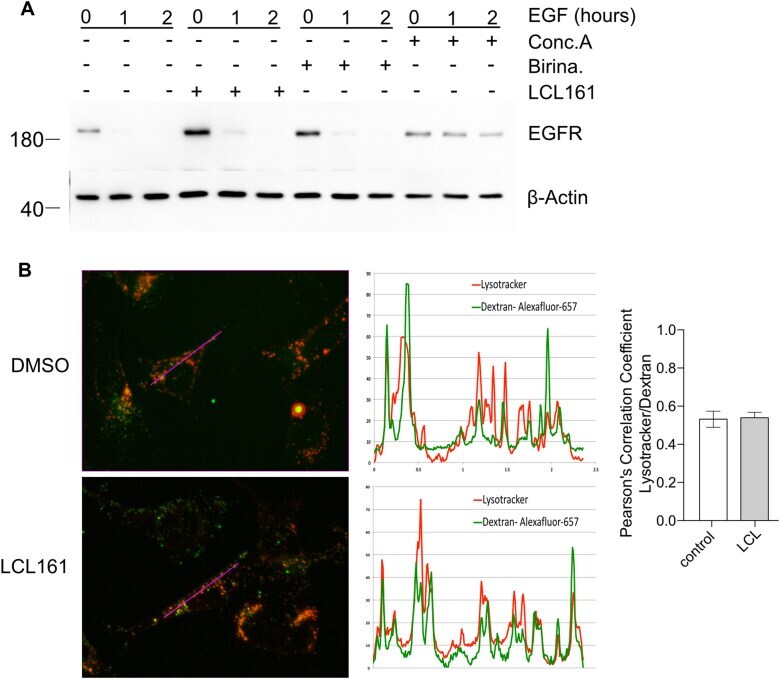
- Fig. 7 IAP antagonism does not block endocytosis. a Wild type MEFs were grown overnight in 0.5% serum. Cells were either left untreated as a control or treated with LCL161 (0.5 muM), birinapant (0.5 muM) for 4 h, or concanamycin A (2 nM) for 1 h before treatment with 100 ng/ml EGF in the presence of 10 mug/ml cycloheximide for 0, 1 or 2 h. Cells were lysed and levels of EGFR were analysed by western blot. b Wild type MEFs were treated with LCL161 (0.5 muM) or not for 4 h. Alexafluor 647-dextran (100 mug/mL) was added for 30 mins and then cells were washed and grown in normal media for a further 2 h. The final 30 min cells were stained with lysotracker (100 nM). Cells were fixed and analysed on the fluorescence microscope. Shown are representative images and line profile of lysotracker and dextran Alexafluor 647. Experiments were performed at least 3 times. Pearsons correlation coefficients are shown in the right panel. Error bars represent the SEM from at least three experiments
- Submitted by
- Invitrogen Antibodies (provider)
- Main image
- Experimental details
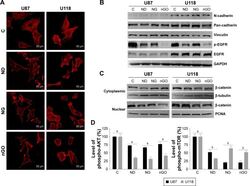
- Figure 5 EGFR/AKT/mTOR and beta-catenin signaling in glioblastoma cells after treated with nanoparticles. Notes: ( A ) Confocal microscope images of U87 and U118 cells actin cytoskeleton. Cells were grown on extracellular matrix for 24 h and treated with diamond nanoparticles, graphite nanoparticles, or graphene oxide nanoparticles at a concentration of 20 mug/mL and incubated for 24 h. F-Actin was stained with phalloidin conjugated with Atto 633. ( B ) Western blot analysis of N-cadherin, pan-cadherin, vinculin, p-EGFR, and EGFR. GAPDH was used as a loading control. ( C ) Western blot analysis of nuclear and cytoplasmic protein fractions used for determination of beta-catenin protein level. PCNA and beta-tubulin were used as loading controls for nuclear and cytoplasmic fractions, respectively. ( D ) ELISA analysis of AKT and mTOR phosphorylation in comparison to control. Treatment with nanoparticles significantly reduced phospho-AKT ( P
- Submitted by
- Invitrogen Antibodies (provider)
- Main image

- Experimental details
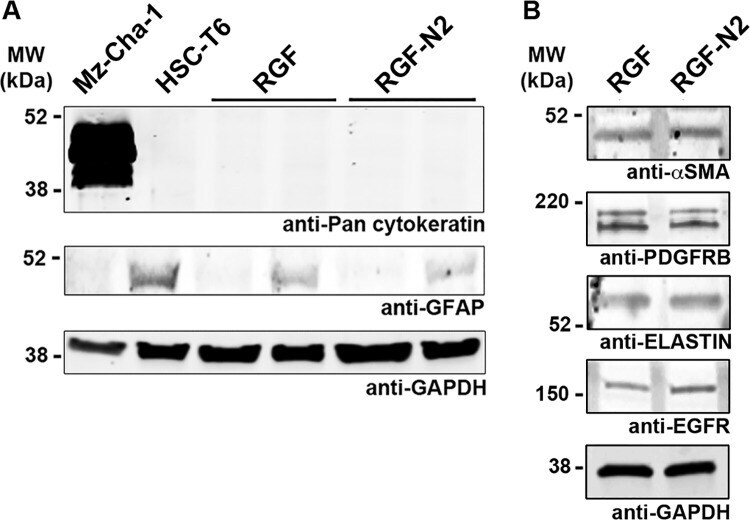
- Fig 2 Phenotypic characterization of immortalized rat portal fibroblastic RGF and RGF-N2 cell lines by immunoblot. (A) Immortalized rat PF RGF and RGF-N2 protein samples were analyzed for expression of Gfap and cytokeratins. Housekeeping Gapdh protein was used as loading control, Mz-Cha-1 cell lysate as positive control for cytokeratin expression, and HSC-T6 cell lysate as positive control for Gfap expression. RGF (passage #59, 1 st lane and passage #34, 2 nd lane) and RGF-N2 (passage #52, 1 st lane and passage #25, 2 nd lane) cells do express neither cytokeratin proteins nor Gfap protein (after 45 passages for the latter). (B) Immortalized rat PF RGF and RGF-N2 protein samples were analyzed for expression of alphaSMA, Elastin, Pdgfrbeta and Egfr. RGF and RGF-N2 express all proteins tested. Housekeeping Gapdh protein was used as loading control. kDa , kiloDaltons .
- Submitted by
- Invitrogen Antibodies (provider)
- Main image

- Experimental details
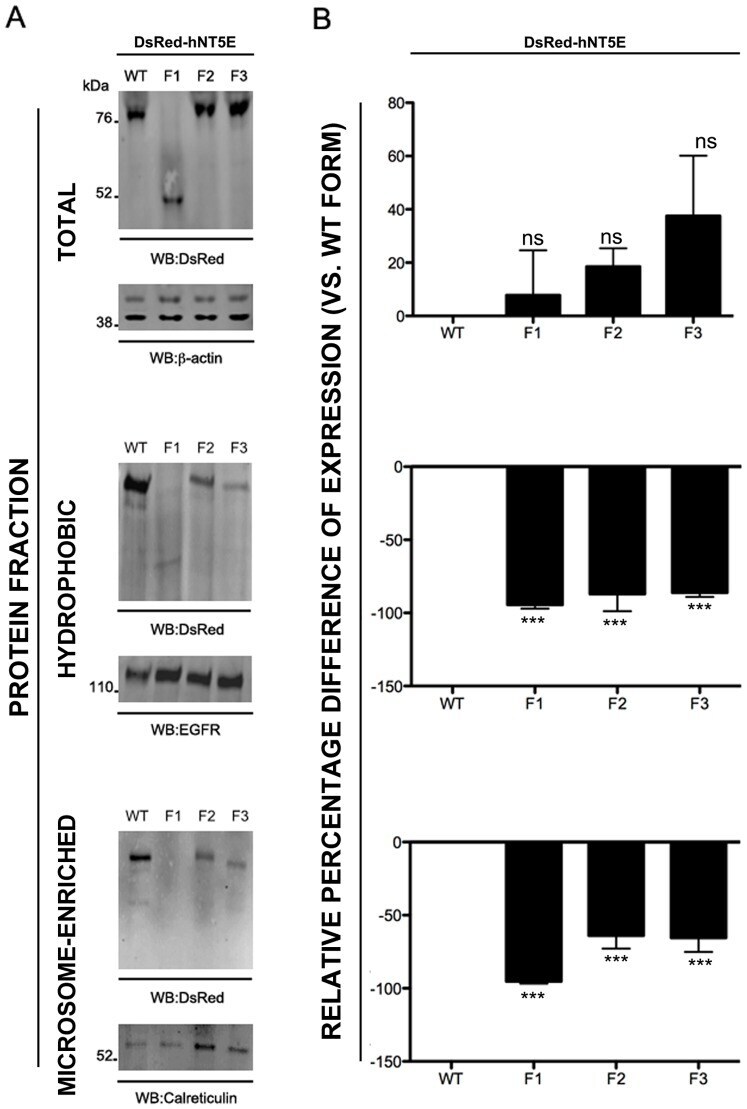
- Figure 3 Subcellular compartment expression of DsRed-NT5E fusion proteins. COS-7 cells were transiently transfected with expression vectors for DsRed-hNT5E wild type (WT) and mutant (F1-3) proteins and proteins were fractionated and immunoblot analysis performed as described in "" Materials and Methods "" section. A. Representative immunoblot analyses of total, hydrophobic and microsome-enriched proteins fractions are depicted (n = 3). For each protein fraction, immunoblot using anti-DsRed (top) and appropriate loading control (bottom) are shown. B. Densitometry analysis of band signal intensity is presented as percentage difference of expression for each DsRed-hNT5E fusion protein, using DsRed-hNT5E wild type fusion protein as baseline. All DsRed-hNT5E fusion proteins are relatively expressed to same extent in transfected cells (DsRed-hNT5E F1, -F2 and F3 vs. DsRed-hNT5E WT, p value = 0.1698, not significant, ns, n = 3). Only DsRed-hNT5E wild type fusion protein is abundantly present in hydrophobic protein fraction (DsRed-hNT5E F1, -F2 and F3 vs. DsRed-hNT5E WT; p value
- Submitted by
- Invitrogen Antibodies (provider)
- Main image
- Experimental details
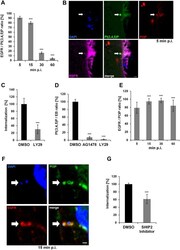
- Fig 1 Entry of C . pneumoniae EBs is PI3K dependent. (A) Quantification of colocalization of PI(3,4,5)P and EGFR in cells transiently transfected with Btk-PH-GFP. Cells were infected at MOI 5, fixed with PFA at the indicated time points (5-60 min), and stained for endogenous EGFR using anti-EGFR, anti-rabbit Alexa594 and DAPI. Confocal images of 30 individual cells were used to analyze colocalization (n = 3). (B) The arrow marks a bacterial entry site at 5 min p.i. visualized by confocal imaging. The bacterial DNA stained with DAPI colocalizes with the ""ring-like"" signal of PI(3,4,5)P detected with Btk-PH-GFP. Furthermore, the entry site is marked by PI3P detected with mCherry-2xFYVE and the endogenous EGFR surrounding the internalized EB. (C) Quantification of C . pneumoniae internalization in cells pretreated with LY29 (50 mumol) for 2 h prior to infection. At 2 hpi internalization was measured by comparison numbers of internal and external EBs in 30 imaged cells (n = 4). (D) Quantification of EBs (stained with DAPI) colocalizing with PI(3,4,5)P (labeled by Btk-PH-GFP) at 5 min p.i. in cells pretreated with AG1478 (2 mumol) or LY29 (50 mumol) for 2 h (n = 3). (E) Quantification of colocalization of PI3P and EGFR in infected cells expressing GFP-2xFYVE. EGFR was stained as before (n = 3). (F) Colocalization of PI3P, EGFR and internalized EBs at 15 min p.i. by expression of GFP-2xFYVE and detection of EGFR. (G) Quantification of internalization in cells pretreated for 2 h w
- Submitted by
- Invitrogen Antibodies (provider)
- Main image
- Experimental details
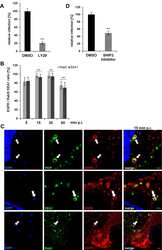
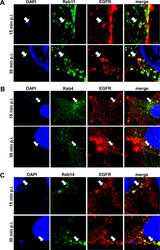
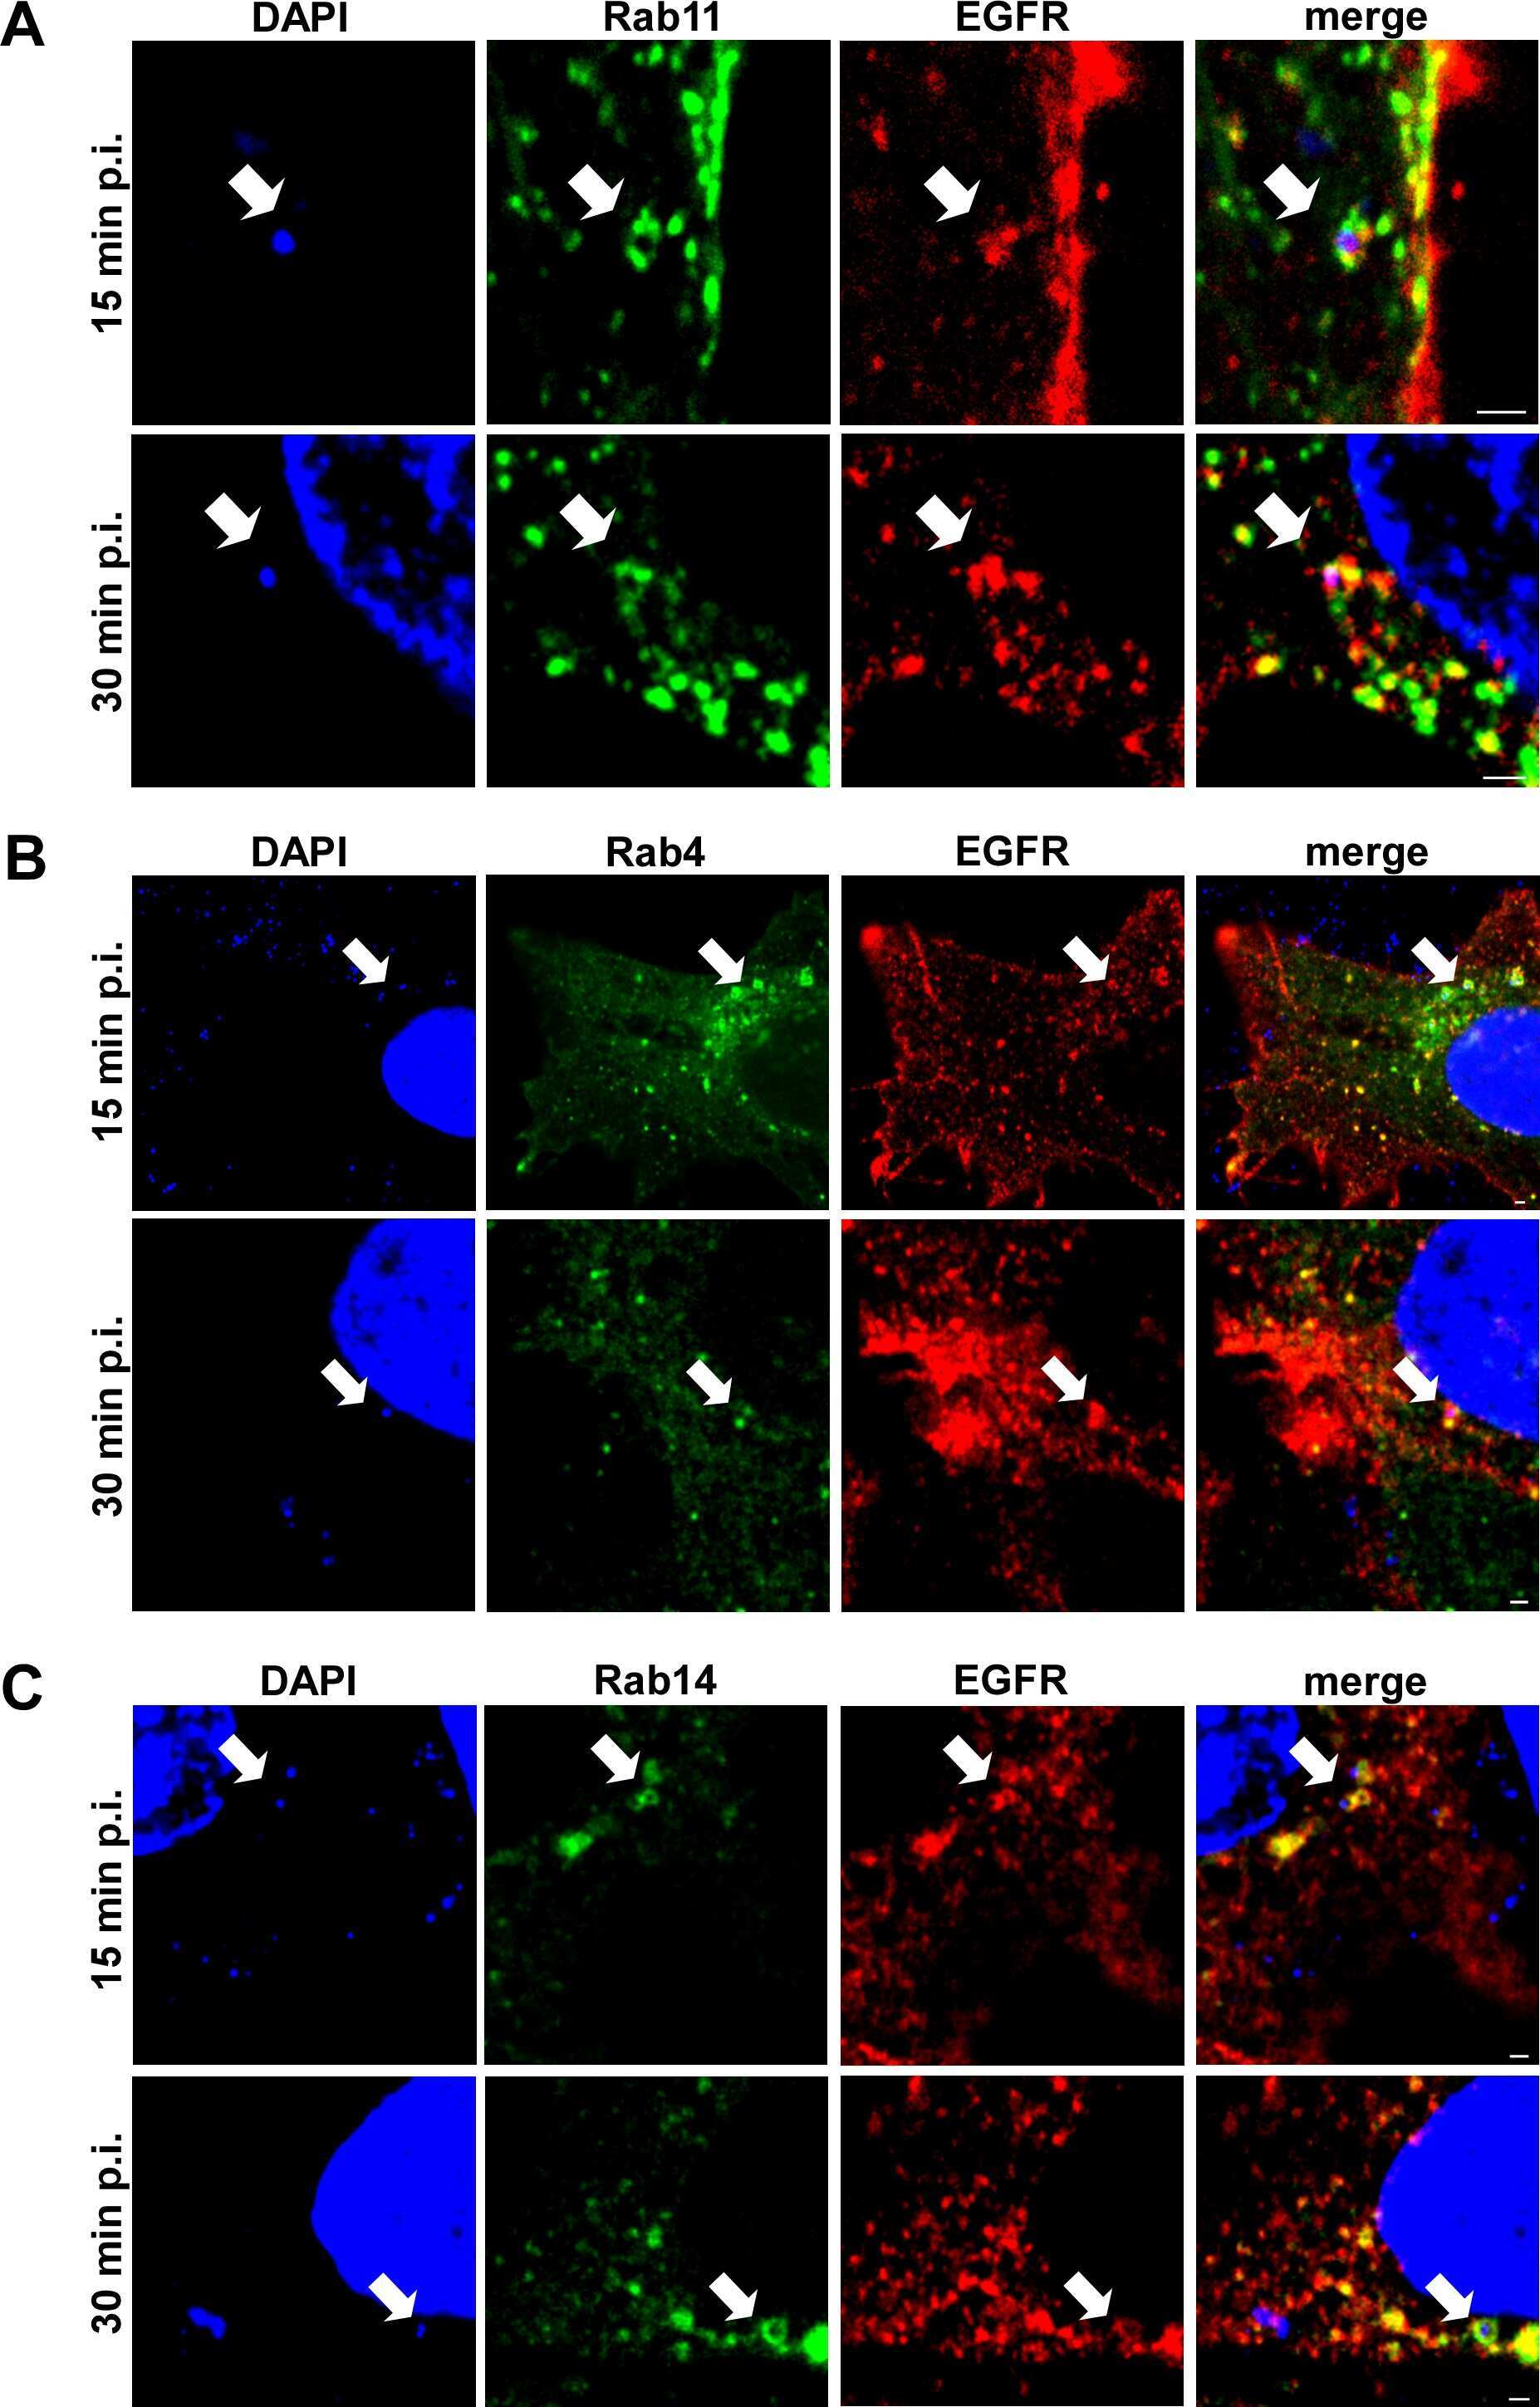
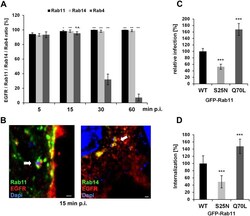
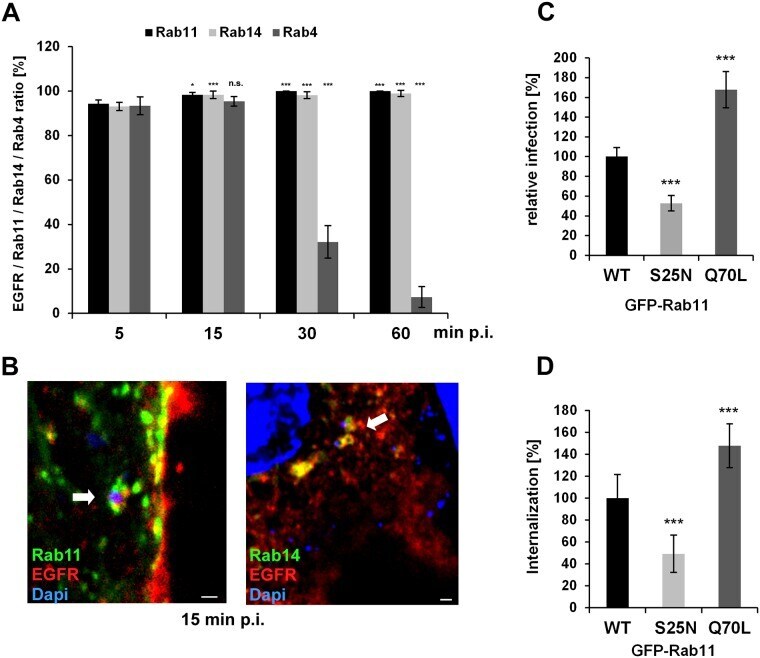
- Fig 3 The early C . pneumoniae inclusion is a recycling endosome. (A) Quantification of colocalization of EGFR-positive C . pneumoniae EBs with GFP-Rab11, GFP-Rab14, GFP-Rab4 at 5-60 min p.i. in transiently transfected cells over the course of (n = 3). (B) Confocal images of colocalization of EBs (visualized with DAPI) with GFP-Rab11 and EGFR (left), or with GFP-Rab14 and EGFR (right) at 15 min p.i. White arrows indicate colocalization. Bar 1mum. (C, D) HEp-2 cells stably expressing wild-type GFP-Rab11 or the dominant-negative (S25N) or constitutively active (Q70L) GFP-Rab11 variant. (C) Quantification of EB internalization at 2 hpi in 30 individual cells (n = 4). (D) Quantification of infection at 48 hpi in 40 visual fields (n = 4). P values: *
- Submitted by
- Invitrogen Antibodies (provider)
- Main image
- Experimental details
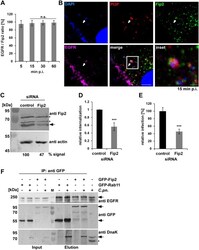
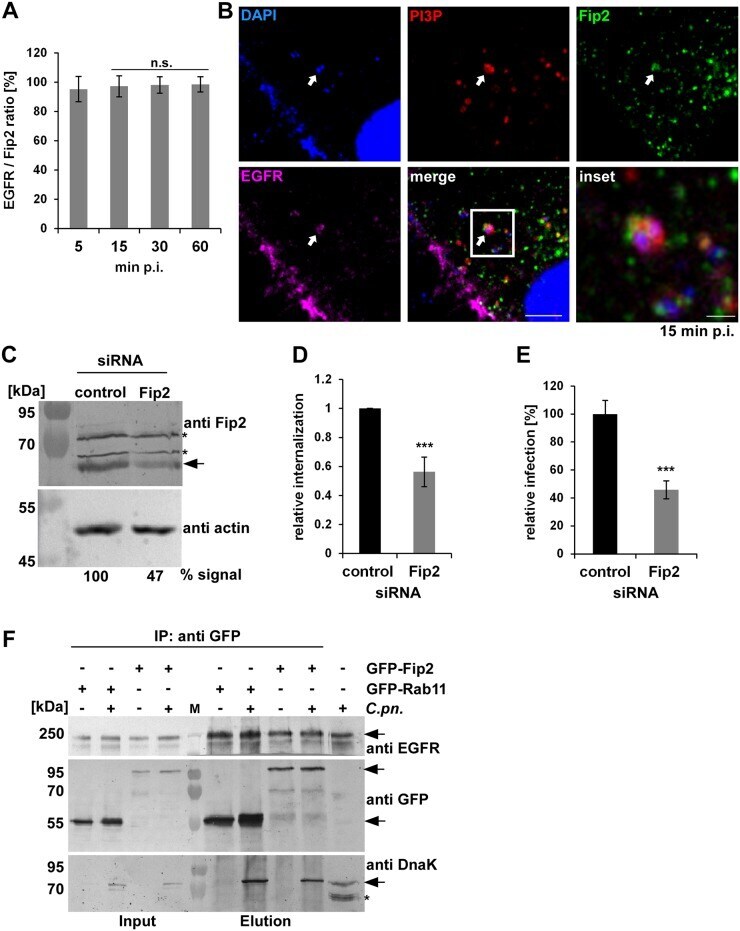
- Fig 4 The Rab11/Rab14 adaptor Fip2 is recruited to early C . pneumoniae inclusions. (A) Quantification of colocalization of Fip2 and EGFR with chlamydial EBs at 5-60 min p.i. in cells transiently transfected with GFP-Fip2 (n = 3). (B) Confocal images of colocalization of EBs (stained by DAPI) with GFP-Fip2, PI3P and EGFR (visualized by mCherry-FYVE and anti EGFR and anti-rabbit Alexa647, respectively) at 15 min p.i. White arrows indicate colocalization, the white box marks the area enlarged in the inset. Bar 10 mum. Bar in inset 1 mum. (C) Immunoblot analysis of cells transiently transfected for 72 h with control or Fip2 siRNA. Samples were lysed in phospho-Lysis buffer, subjected to SDS/PAGE and probed with antibodies against Fip2 to monitor knockdown; beta-actin served as the loading control. The pixel intensity of bands was analyzed with ImageJ. The arrow marks the Fip2 protein band, unspecific bands detected by the Fip2 antibody are indicated by asterisks. (D, E) Quantification of EB internalization or infection after transfection for 72 h with control or Fip2 siRNA. (D) Relative internalization levels were measured by q-PCR of isolated DNA using primers specific for human GAPDH and chlamydial 16S rRNA at 2 hpi (n = 6). (E) Quantification of infection analyzed microscopically as described before (n = 4). (F) Co-IP of HEp-2 cells stably expressing GFP-Rab11 or GFP-Fip2 after infection for 15 min. Chlamydia-containing endosomes were isolated and subjected to immunoprecipita
- Submitted by
- Invitrogen Antibodies (provider)
- Main image

- Experimental details
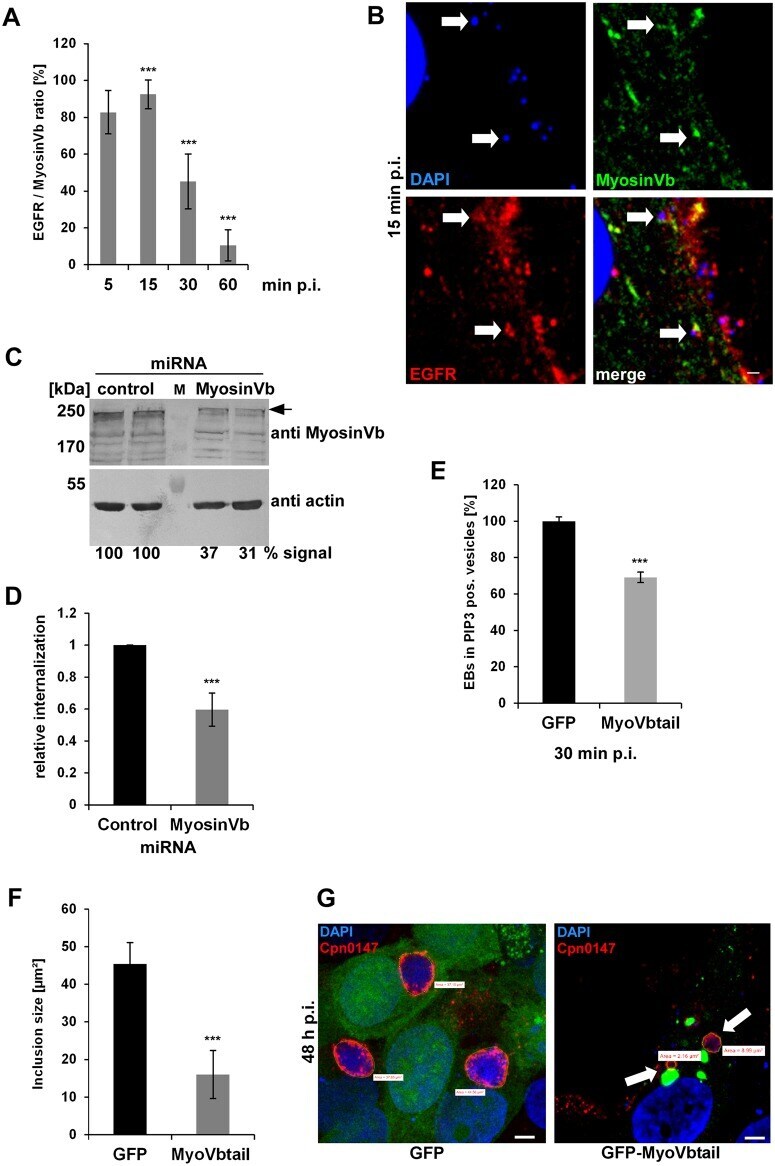
- Fig 6 The acquisition of myosin Vb by the Rab11-Fip2 adaptor protein is essential for the C . pneumoniae infection. (A) Quantification of colocalization of EGFR-positive EBs with GFP-MyosinVb from 5 min to 60 min p.i. (n = 3). (B) Confocal images of colocalization of GFP-MyosinVb and EGFR with C . pneumoniae EBs at 15 min p.i. White arrows indicate colocalization. Bar 1 mum. (C) Immunoblot analysis of cells transiently transfected for 72 h with control or myosin Vb miRNA plasmids and lysed in phospho-Lysis buffer. Samples were fractionated by SDS/PAGE and probed with antibodies against myosin Vb to monitor knockdown; beta-actin served as loading control. The pixel intensity of bands was analyzed with ImageJ. The arrow marks the specific myosin Vb band. (D) Relative internalization of EBs into cells transfected for 72 h with control or MyosinVb miRNA plasmids was measured by q-PCR at 2 hpi as described in the legend to Fig 4 (n = 6). (E) Quantification of internalization of EBs into PI3P endosomes at 30 min p.i. Confocal images of 30 individual cells transiently expressing mCherry-2xFYVE and GFP or GFP-MyoVbtail were analyzed (n = 3). (F) Quantification of the inclusion diameter in cells expressing in GFP or GFP-MyoVbtail cells at 48 hpi. Inclusions were stained with anti-Cpn0147 and anti-rabbit Alexa594 and their diameters were measured in 30 individual cells (n = 3). *** P value
- Submitted by
- Invitrogen Antibodies (provider)
- Main image

- Experimental details
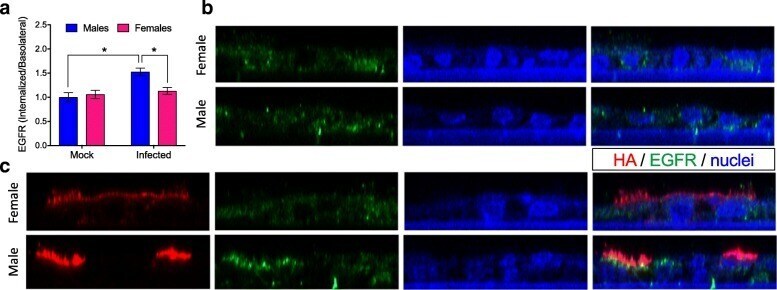
- Fig. 3 Influenza A virus infection of mouse respiratory epithelial cells results in greater internalization of the epidermal growth factor receptor (EGFR) in cells derived from males. Mouse tracheal epithelial cell (mTEC) cultures were isolated from male and female mice and either mock-infected or infected with 2009 H1N1 at a high multiplicity of infection (MOI = 10). At 24 hpi, the cultures were fixed and immunostained for the 2009 H1N1 hemagglutinin protein (HA; red). The cultures were then permeabilized and immunostained for the EGFR (green) with a nuclear counterstain (DAPI; blue). a Quantitation of the ratio of internalized to basolateral EGFR fluorescence signal present in panels b and c . Reconstructed Z sections from 0.5 mum optical sections obtained via confocal microscopy showing the localization of HA and EGFR in mock ( b ) or IAV-infected ( c ) mTEC cultures derived from male or female mice. The images were obtained on an LSM 700 using a x 63 objective and processed using Volocity and FIJI software. Data represent means +- SEM from two independent experiments, with significant differences represented by asterisks (*). At least eight fields were counted per condition, per experiment
- Submitted by
- Invitrogen Antibodies (provider)
- Main image
- Experimental details
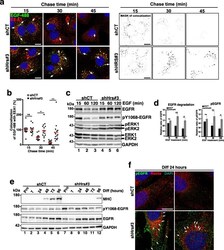
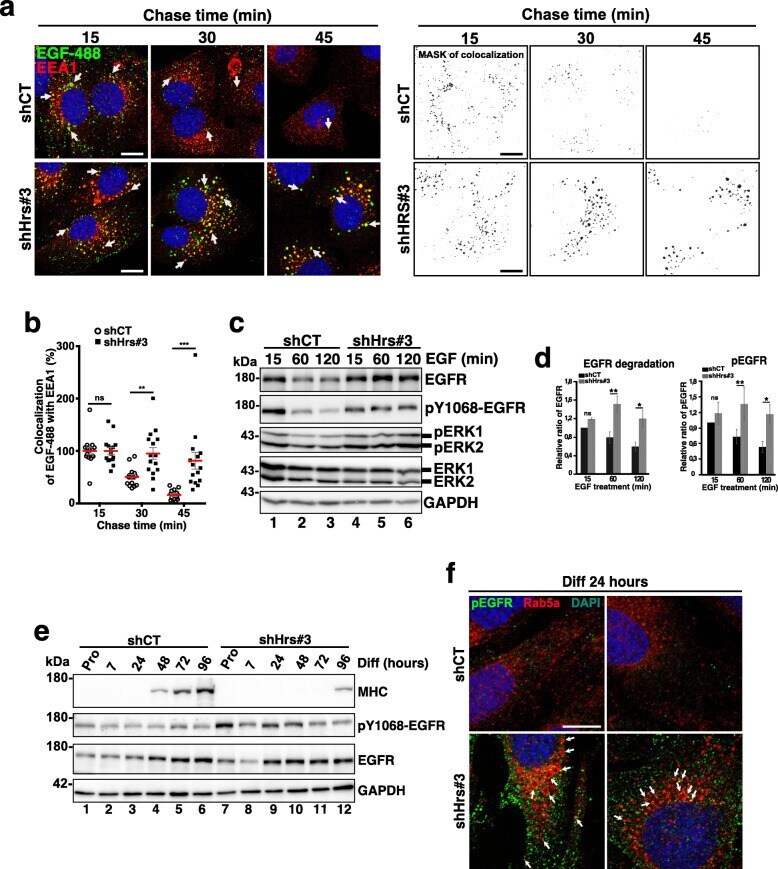
- Fig. 6 EGFR is accumulated in Hrs-depleted cells and its activation partially correlates with induction of the MEK1/2/ERK1/2-pathway. a Left panel: representative immunofluorescence images of pulse-chase experiments: shCT and shHrs#3 C2C12 were stimulated for 5 min with 50 ng/mL of EGF-488 (green) and after removing unbound ligand-chased for the indicated amount of time. Cells were probed with the anti-EEA1 to visualize EE and trafficking of EGF-488/EGFR was followed through the EE pathway. White arrows indicate colocalization of EGF-488 (in green) with the EEA1 EE marker (red) and DAPI (blue). Note the accumulation of EGF-488 in EEA1-positive compartments (yellow merge) in shHrs#3-depleted cells. Right panel: mask of colocalization between EGF-488- and EEA1-positive compartments. Scale bars, 20 mum. b Quantifications of colocalization of EGF-488 in EEA1 compartments. Analysis shows the percentage of EGF-488 overlapping with EEA1 and establishes the endocytic trafficking of EGF ligand through the EE pathway (EEA1 compartment). Open circles correspond to shCT and black squares to shHrs#3 conditions. The data represent mean +/- SEM. Analyses were done on 5 fields per condition on n = 3 experiments. Significance was assessed using a Mann-Whitney U test; *** p < 0.001; ** p < 0.005. ns not significant. c Degradation of EGFR. shCT and shHrs#3 cells were stimulated with 50 ng/mL of EGF and with 10 mug/mL of cycloheximide to inhibit de novo synthesis of EGFR. Cells were recovered 15
- Submitted by
- Invitrogen Antibodies (provider)
- Main image
- Experimental details
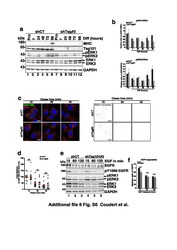
- Additional file 6. Fig. S6: Tsg101 silencing in C2C12 doesn't impact EGFR trafficking. (a) Representative Western blotting of protein extracts from shCT and shTsg101#3 C2C12 cells collected in Pro (lanes 1 and 7) and at 7, 24, 48, 72 and 96 h of differentiation (lanes 2-6 and 8-12) and probed with antibodies directed against MHC, TSG101, total-ERK1/2, p T202/Y204-ERK1/2. GAPDH was used as a loading control. (b) Quantification of the phosphorylated-ERK1/2 from similar experiments presented in (a). The data are presented as a ratio of pERK1/ERK1 (upper panel) and pERK2/ERK2 (lower panel) and normalized to the Pro starting point condition. Data represent mean +/- SEM, n = 2 experiments. (c) Left panel: pulse-chase experiments in Tsg101 depletion context: shCT and shTsg101#3 C2C12 myoblasts were stimulated for 5 min with 50 ng/mL of EGF-488 (green) and after removing unbound ligand-chased for the indicated amount of time. Cells were probed with the anti-EEA1 to visualize EE and trafficking of EGF-488/EGFR was followed through the EE pathway. Right panel: Mask of colocalization between EGF-488 and the EE marker EEA1. Scale bar, 20 mum. (d) Quantifications of colocalization of EGF-488 in EEA1 positive compartments: analysis shows the percentage of EGF-488 overlapping with EEA1 and establishes the endocytic trafficking of EGF ligand through the EE pathway (EEA1 compartment). Open circles correspond to shCT and black squares to shTsg101#3 conditions. The data represent mean +/- SEM.

- Submitted by
- Invitrogen Antibodies (provider)
- Main image
- Experimental details
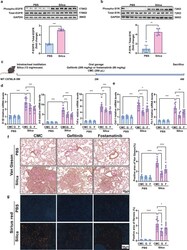
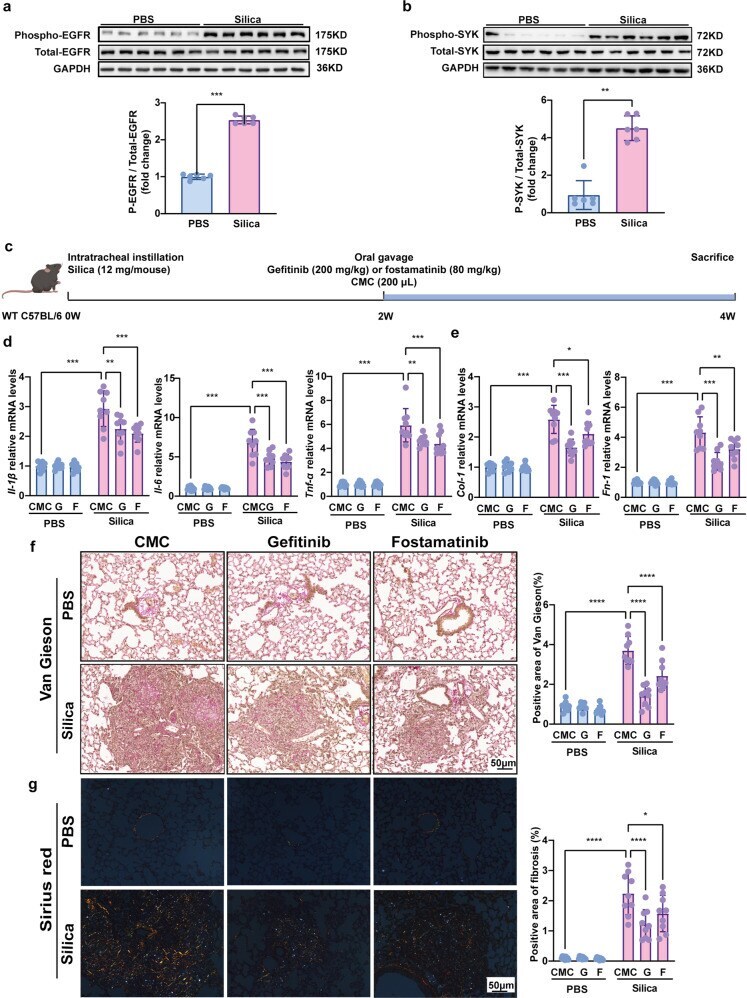
- Gefitinib and fostamatinib treatment suppressed pulmonary inflammation and fibrosis in silicosis mice. Western blot analysis of a EGFR and b SYK expression and phosphorylation with silicosis and control mouse lung tissues. c Schematic diagram of gefitinib and fostamatinib treatment in silicosis mice. The relative mRNA levels of d Il-1beta , Il-6 , Tnf-alpha , e Col-1 and Fn-1 in lung tissues. Representative images of f Van Gieson, and the scale bar indicates 50 mum. Quantification of pulmonary inflammation and fibrosis in ( f ). All quantitative results were presented as mean +- SD. All the experimental groups in panel d-g were compared by a two-way ANOVA followed by Bonferroni' s multiple comparisons test, ns: no significance, PBS group: n = 9 each group; Silica-exposed group: n = 9 each group. * p < 0.05, ** p < 0.01, *** p < 0.001, **** p < 0.0001. PBS phosphate-buffered saline, G gefitinib, F fostamatinib. 2W, 2 weeks; 4W, 4 weeks
- Submitted by
- Invitrogen Antibodies (provider)
- Main image

- Experimental details
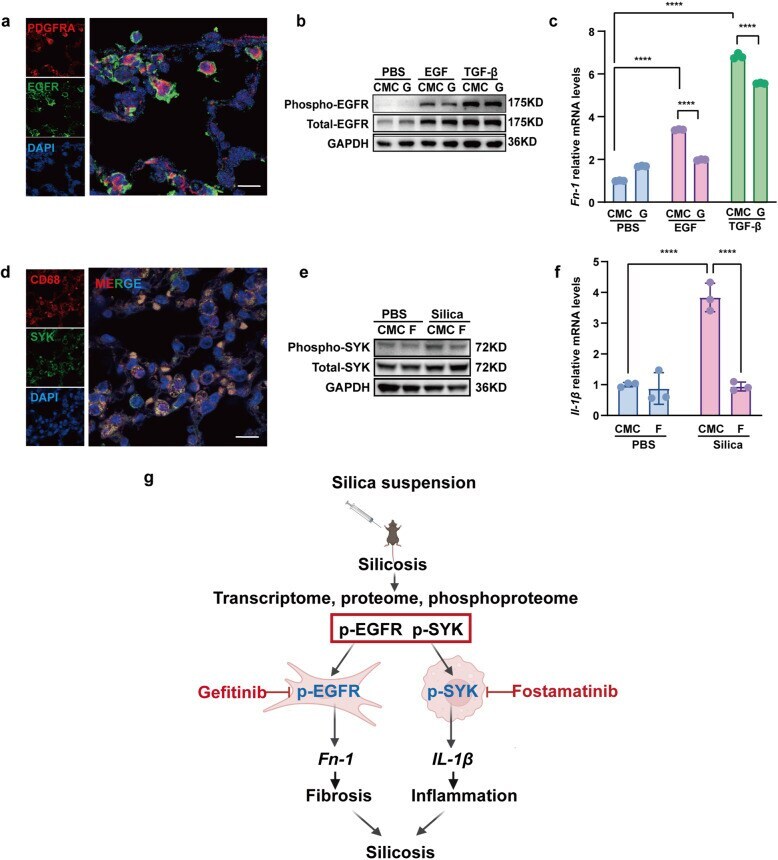
- Gefitinib inhibited the profibrotic activity of lung fibroblasts while fostamatinib inhibited the pro-inflammatory activity of lung macrophages in silicosis. a EGFR and fibroblast marker expression in mouse lung tissue, fibroblasts were immunolabeled with anti-EGFR (green), anti-PDGFRA (red), and nuclei were immunolabeled with DAPI (blue). b Western blot analysis of EGFR expression and phosphorylation with control or EGF or TGF-beta-treated ibroblasts cell line Mlg2908 lysates. c The relative mRNA levels of Fn-1 in control and treated fibroblasts. d SYK and macrophage marker expression in mouse lung tissue, macrophages were immunolabeled with anti-CD68 (red), nuclei were immunolabeled with DAPI (blue) and SYK was immunolabeled with anti-SYK (green). e Western blot analysis of SYK expression and phosphorylation with treated and control cell lysates. f The relative mRNA levels of Il-1beta in control and treated macrophages. g Graphical abstract of treatment process in cell experiments. All quantitative results were presented as mean +- SD. All experiment groups in panels c and f were compared by a two-way ANOVA followed by Bonferroni's multiple comparisons test, n = 3 each group. ns: no significance; * p < 0.05, ** p < 0.01, *** p < 0.001, **** p < 0.0001. PBS phosphate-buffered saline, G gefitinib, F fostamatinib
- Submitted by
- Invitrogen Antibodies (provider)
- Main image

- Experimental details
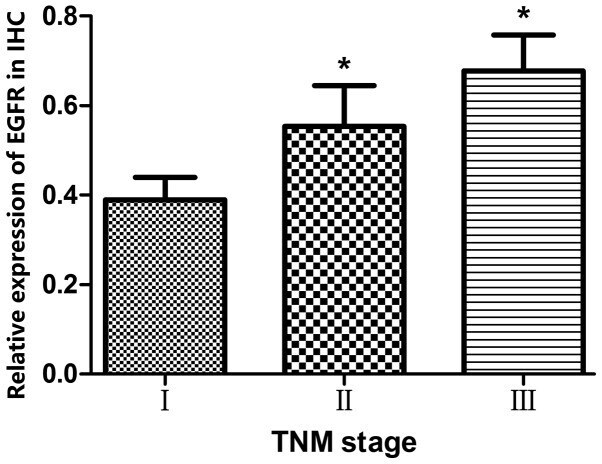
- Figure 4. Quantitative analysis of IHC staining results revealed that EGFR protein expression was revealed to increase in a TNM stage-dependent manner. *P
- Submitted by
- Invitrogen Antibodies (provider)
- Main image

- Experimental details
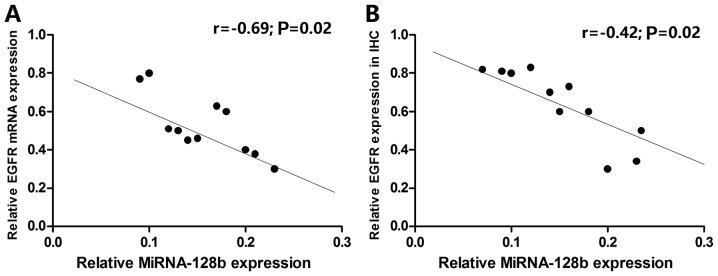
- Figure 5. Association between the expression levels of miRNA-128-b and the expression of EGFR in lung cancer tissues. Pearson correlation analysis demonstrated that there were a significant negative correlations between the relative expression levels of miRNA-128-b and (A) EGFR mRNA relative expression (r=-0.69; P=0.02) and (B) EGFR protein expression (r=-0.43; P=0.02). EGFR, epidermal growth factor receptor; miRNA, microRNA; IHC, immunohistochemistry.
- Submitted by
- Invitrogen Antibodies (provider)
- Main image
- Experimental details
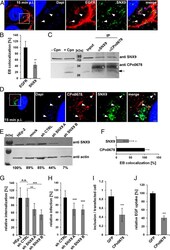
- Fig. 5. Interaction of SNX9 with CPn0678 is essential for infection by C. pneumonia . ( A ) Colocalization of SNX9 (stained with anti-SNX9 and anti-mouse Alexa488) and EGFR (stained with anti-EGFR and anti-rabbit Alexa594) at bacterial entry sites at 15 min postinfection. C. pneumoniae EBs were stained with DAPI. Insets show regions in white squares. White arrowheads indicate instances of colocalization. (Scale bars 10 um; 1 um in Insets .) ( B ) A . Confocal images of 200 individual EBs were analyzed. Data are presented as means +- SD ( n = 3). ** P
