 Explore
 Validate
 Learn
Learn Immunocytochemistry
Antibody data
- Antibody Data
- Antigen structure
- References [7]
- Comments [0]
- Validations
- Immunocytochemistry [3]
- Immunohistochemistry [1]
- Flow cytometry [1]
- Other assay [8]
Submit
Validation data
Reference
Comment
Report error
- Product number
- 700013 - Provider product page

- Provider
- Invitrogen Antibodies
- Product name
- Phospho-FAK (Tyr576) Recombinant Rabbit Monoclonal Antibody (2H74L24)
- Antibody type
- Monoclonal
- Antigen
- Synthetic peptide
- Reactivity
- Human
- Host
- Rabbit
- Isotype
- IgG
- Antibody clone number
- 2H74L24
- Vial size
- 100 µg
- Concentration
- 0.5 mg/mL
- Storage
- Store at 4°C short term. For long term storage, store at -20°C, avoiding freeze/thaw cycles.
Submitted references MARCKS Is Necessary for Netrin-DCC Signaling and Corpus Callosum Formation.
A ligand-independent integrin β1 mechanosensory complex guides spindle orientation.
Targeting the insulin-like growth factor receptor and Src signaling network for the treatment of non-small cell lung cancer.
Understanding the roles of FAK in cancer: inhibitors, genetic models, and new insights.
Post-ovulatory aging of oocytes disrupts kinase signaling pathways and lysosome biogenesis.
FAK transduces extracellular forces that orient the mitotic spindle and control tissue morphogenesis.
Activation of endogenous FAK via expression of its amino terminal domain in Xenopus embryos.
Brudvig JJ, Cain JT, Schmidt-Grimminger GG, Stumpo DJ, Roux KJ, Blackshear PJ, Weimer JM
Molecular neurobiology 2018 Nov;55(11):8388-8402
Molecular neurobiology 2018 Nov;55(11):8388-8402
A ligand-independent integrin β1 mechanosensory complex guides spindle orientation.
Petridou NI, Skourides PA
Nature communications 2016 Mar 8;7:10899
Nature communications 2016 Mar 8;7:10899
Targeting the insulin-like growth factor receptor and Src signaling network for the treatment of non-small cell lung cancer.
Min HY, Yun HJ, Lee JS, Lee HJ, Cho J, Jang HJ, Park SH, Liu D, Oh SH, Lee JJ, Wistuba II, Lee HY
Molecular cancer 2015 Jun 4;14:113
Molecular cancer 2015 Jun 4;14:113
Understanding the roles of FAK in cancer: inhibitors, genetic models, and new insights.
Yoon H, Dehart JP, Murphy JM, Lim ST
The journal of histochemistry and cytochemistry : official journal of the Histochemistry Society 2015 Feb;63(2):114-28
The journal of histochemistry and cytochemistry : official journal of the Histochemistry Society 2015 Feb;63(2):114-28
Post-ovulatory aging of oocytes disrupts kinase signaling pathways and lysosome biogenesis.
McGinnis LK, Pelech S, Kinsey WH
Molecular reproduction and development 2014 Oct;81(10):928-45
Molecular reproduction and development 2014 Oct;81(10):928-45
FAK transduces extracellular forces that orient the mitotic spindle and control tissue morphogenesis.
Petridou NI, Skourides PA
Nature communications 2014 Oct 24;5:5240
Nature communications 2014 Oct 24;5:5240
Activation of endogenous FAK via expression of its amino terminal domain in Xenopus embryos.
Petridou NI, Stylianou P, Christodoulou N, Rhoads D, Guan JL, Skourides PA
PloS one 2012;7(8):e42577
PloS one 2012;7(8):e42577
No comments: Submit comment
Supportive validation
- Submitted by
- Invitrogen Antibodies (provider)
- Main image

- Experimental details
- Immunofluorescence analysis of Phospho-FAK (Tyr576) Antibody was performed using 90% confluent log phase A-431 cells treated with 200 ng/mL of EGF for 10 minutes. The cells were fixed with 4% paraformaldehyde for 10 minutes, permeabilized with 0.1% Triton™ X-100 for 10 minutes, and blocked with 1% BSA for 1 hour at room temperature. The cells were labeled with Phospho-FAK (Tyr576) Recombinant Rabbit Monoclonal Antibody (Product # 700013) at 1:100 dilution in 0.1% BSA and incubated overnight at 4 degree and then labeled with Goat anti-Rabbit IgG (H+L) Recombinant Superclonal™ Secondary Antibody, Alexa Fluor® 488 conjugate (Product # A27034) at a dilution of 1:2000 for 45 minutes at room temperature (Panel a: green). Nuclei (Panel b: blue) were stained with SlowFade® Gold Antifade Mountant with DAPI (Product # S36938). F-actin (Panel c: red) was stained with Rhodamine Phalloidin (Product # R415, 1:300). Panel d represents the merged image showing membrane localization. Panel e shows untreated cells with no signal. Panel f represents control cells with no primary antibody to assess background. The images were captured at 60X magnification.

- Submitted by
- Invitrogen Antibodies (provider)
- Main image
- Experimental details
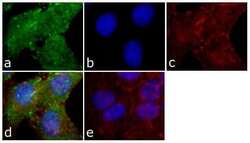
- Immunofluorescent analysis of FAK (pY576) was done on 70% confluent log phase HeLa cells. The cells were fixed with 4% paraformaldehyde for 15 minutes; permeabilized with 0.25% Triton X-100 for 10 minutes followed by blocking with 5% BSA for 1 hour at room temperature. The cells were incubated with FAK (pY576) Recombinant Rabbit Monoclonal Antibody (Product # 700013) at 1 µg/mL in 1% BSA and incubated for 3 hours at room temperature and then labeled with Alexa Fluor 488 Goat anti-Rabbit IgG Secondary Antibody (Product # A-11008) at a dilution of 1:400 for 30 minutes at room temperature (Panel a: green). Nuclei (Panel b: blue) were stained with SlowFade Gold Antifade Mountant with DAPI (Product # S36938). F-actin (Panel c: red) was stained with Alexa Fluor 594 Phalloidin (Product # A12381). Panel d is a merged image showing punctate and cytoplasmic localization of FAK (pY576). and panel e is a no primary antibody control. The images were captured at 20X magnification.

- Submitted by
- Invitrogen Antibodies (provider)
- Main image
- Experimental details
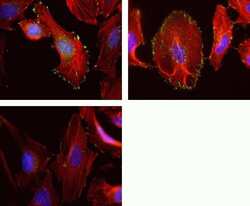
- Immunofluorescent analysis of Phospho-FAK pTyr576 in HeLa cells using a Phospho-FAK pTyr576 recombinant rabbit monoclonal antibody (Product # 700013) at a dilution of 60 ng/mL preincubated with phosphopeptide used as an immunogen (bottom left) or with non-phosphopeptide (top right) followed by detection using an Alexa Fluor 488-conjugated goat anti-rabbit secondary antibody at a dilution of 1:1000. Nuclei are stained with Hoescht (blue) and actin is stained with Alexa Fluor 568 Phalloidin (red).

Supportive validation
- Submitted by
- Invitrogen Antibodies (provider)
- Main image

- Experimental details
- Immunohistochemistry analysis of FAK showing staining in the cytoplasm of paraffin-embedded human cervices carcinoma (right) compared to a negative control without primary antibody (left). To expose target proteins, antigen retrieval was performed using 10mM sodium citrate (pH 6.0), microwaved for 8-15 min. Following antigen retrieval, tissues were blocked in 3% H2O2-methanol for 15 min at room temperature, washed with ddH2O and PBS, and then probed with a FAK monoclonal antibody (Product # 700013) diluted in 3% BSA-PBS at a dilution of 1:20 overnight at 4°C in a humidified chamber. Tissues were washed extensively in PBST and detection was performed using an HRP-conjugated secondary antibody followed by colorimetric detection using a DAB kit. Tissues were counterstained with hematoxylin and dehydrated with ethanol and xylene to prep for mounting.

Supportive validation
- Submitted by
- Invitrogen Antibodies (provider)
- Main image
- Experimental details
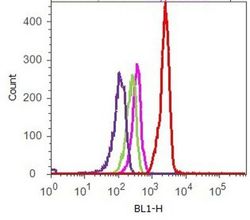
- Flow cytometry analysis of FAK [pY576] was done on A549 cells. Cells were fixed with 70% ethanol for 10 minutes, permeabilized with 0.25% Tritonª X-100 for 20 minutes, and blocked with 5% BSA for 1 hour at room temperature. Cells were labeled with ABfinityª FAK [pY576] Recombinant Rabbit Monoclonal Antibody (700013, red histogram) or with rabbit isotype control (pink histogram) at 1-3 µg/million cells in 2.5% BSA. After incubation at room temperature for 2-3 hours, the cells were labeled with Alexa Fluor¨ 488 Goat Anti-Rabbit Secondary Antibody (A11008) at a dilution of 1:400 for 30 minutes at room temperature. The representative 10,000 cells were acquired and analyzed for each sample using an Attune¨ Acoustic Focusing Cytometer. The purple histogram represents unstained control cells and the green histogram represents no-primary-antibody control.

Supportive validation
- Submitted by
- Invitrogen Antibodies (provider)
- Main image

- Experimental details
- NULL

- Submitted by
- Invitrogen Antibodies (provider)
- Main image

- Experimental details
- NULL

- Submitted by
- Invitrogen Antibodies (provider)
- Main image

- Experimental details
- Figure 2 FAK is heavily phosphorylated in mesodermal tissues and integrin-free regions of cells. (A) Intensity color coded confocal section of the dorsal lip region from a whole mount immunostained gastrula stage embryo using a P-Y576 FAK antibody. Mesodermal cells (white arrow) display much higher levels of phospho-FAK than endodermal cells lining the forming archenteron (white arrowheads) and the endodermal cells of the blastopore (red arrow). (B) Same as A but showing the anterior mesendoderm and the animal cap from a whole mount immunostained gastrula stage embryo. The superficial cells of the animal cap (white arrowhead) show lower levels of phospho-FAK signal compared to deep cells (white arrow) and mesendodermal cells (red arrow). (C) High magnification color coded narrow optical section of superficial cells of the animal cap reveals that the apical surface of these cells display similar levels of phospho-FAK compared to the basolateral region while (D) the apical region of the deep cells of the animal cap facing the fibronectin ECM display significantly elevated levels of phospho-FAK compared to the basolateral region. In addition, in the deep cells of the ectoderm labeling of phospho-FAK in the basolateral region is relatively uniform but the apical region displays distinct foci of higher signal intensity (E-G) Confocal optical sections from whole mount immunostained embryos using integrin-beta1 (green) and P-Y397 FAK antibodies (red). Integrin-beta1 and P-Y397 FAK c

- Submitted by
- Invitrogen Antibodies (provider)
- Main image

- Experimental details
- Figure 4 The FERM domain is necessary and sufficient for membrane localization of FAK at integrin-free regions. Confocal images and intensity profiles of the indicated constructs after whole mount immunostaining. The first column are top views of superficial cells of the animal cap in intact embryos and the second column are views from sagittally sectioned embryos that reveal the localization of each construct on the apical surface of superficial cells. Apical region of superficial blastomeres is to the right. (A) The FERM domain shows strong plasma membrane localization in the top view and is strongly localized to the apical surface. (B) Endogenous phosphorylated FAK shows very strong plasma membrane localization in the top view and is localized on the basolateral and apical surface of the cell. (C) Full length FAK with the point mutation K38A exhibits strong membrane localization. (D) Deletion of the FERM domain (HA-Delta375 FAK construct) abolishes the plasma membrane localization of FAK. Scale bars: 25 um.

- Submitted by
- Invitrogen Antibodies (provider)
- Main image

- Experimental details
- Figure 1 FAK expression and phosphorylation during development. (A) Western Blots from extracts of equal numbers of embryos probed with a monoclonal antibody against the C-terminus of FAK or polyclonal antibodies against the phosphorylated tyrosine residues indicated. FAK is phosphorylated on all three residues both before and after gastrulation. The intensity values from the densitometry analysis of the western blots were normalized against total FAK amount. (B) Blastula (1 st column), early gastrula (2 nd column) and late gastrula embryos (3 rd column) stained with P-Y397, P-Y576, P-Y861 and P-Y31paxillin antibodies as indicated. Phosphorylated FAK and paxillin can be detected on the plasma membrane from early blastula stages including the apical region of superficial blastomeres. During gastrulation elevated levels of phosphorylation are detected in the highly morphogenetic mesodermal tissues (white arrowheads). Scale bar: 400 um.

- Submitted by
- Invitrogen Antibodies (provider)
- Main image

- Experimental details
- Figure 7 An integrin beta1-based cortical mechanosensory complex is formed at the lateral cortex of mitotic cells. ( a ) Optical sections, colour intensity-coded images and side views of representative metaphase HeLa cells co-stained for active beta1 and phosphorylated active forms of FAK, Cas or Src. The white arrowheads indicate the polarized cortical crescent of the phosphorylated forms of the above proteins. The white line represents the metaphase plate and the dashed line shows the basal surface. ( b ) Optical sections at the spindle plane of metaphase control HeLa cells or cells treated with the P4C10 antibody. All cells were imaged under the same conditions. Cells were co-stained for beta-tubulin, active beta1 (9EG7) and phosphorylated Cas or Src. The plots show the average cortical intensity of P-Cas and P-Src in control and P4C10-treated cells. mean+-s.e.m.: P-Cas control 9.106+-0.7618, n =33; P-Cas P4C10 3.691+-0.3323, n =34; P-Src control 10.30+-1.155, n =35; P-Src P4C10 3.916+-0.3537, n =30. Analysed by Mann-Whitney test; n, number of metaphase cells, two independent experiments (Kruskal-Wallis: for P-Cas Control P =0.0715, ns, P4C10 P =0.2177, ns; for P-Src Control P =0.0657, ns, P4C10 P =0.2510, ns). Scale bar, 10 mum ( a ), 5 mum ( b ).

- Submitted by
- Invitrogen Antibodies (provider)
- Main image

- Experimental details
- Figure 3 FRNK does not act as a dominant negative in early Xenopus embryos. (A-D) Optical sections of whole mount immunostained embryos injected with 1 ng GFP-FRNK at the two dorsal blastomeres at the four-cell stage. Embryos were stained with anti-GFP (A) and anti-P-Y397 (B). C is the merged image and D an intensity color coded image of the anti-P-Y397 signal. FRNK injected cells are indicated with red stars and control cells with white stars. FRNK expression fails to reduce the phosphorylation levels of endogenous FAK on tyrosine 397. (E-H) Same as A-D, but the embryos were stained with anti-GFP (E) and anti-P-Y576 (F). FRNK expressing cells display similar levels of phosphorylation on tyrosine 576 as neighboring control cells. (I-L) Confocal images of A6 Xenopus cells transfected with GFP-FRNK. Cells were stained with anti-GFP (I) and anti-P-Y397 (J). K is the merged image and L an intensity color coded image of the anti-P-Y397 signal. FRNK expression leads to reduction of the phosphorylation levels of FAK on tyrosine 397 at the focal adhesions. (M-P) Same as I-L but the cells were stained with anti-GFP (M) and anti-P-Y576 (N) antibodies. FRNK expression leads to downregulation of the endogenous phosphorylation levels of FAK on tyrosine 576 at the focal adhesions. (Q) Western blot analysis of control and injected gastrula stage embryos with 1 ng FRNK at the animal pole of both blastomeres of two cell stage embryos. FRNK expression fails to reduce endogenous FAK phosphoryla

- Submitted by
- Invitrogen Antibodies (provider)
- Main image

- Experimental details
- Figure 5 The FERM domain leads to activation of endogenous FAK in a tyrosine 397 dependent manner. HA-FERM and HA-FERM Y397F injected embryos in one blastomere at the animal pole of two cell stage embryos were processed for whole mount immunostaining using an HA antibody (green) to reveal expressing cells and the respective phospho-specific antibodies (red) as indicated. In each case individual signals for each secondary are shown in addition to a merged image and finally an intensity color coded image of the respective phospho-specific antibody signal. HA-FERM and HA-FERM Y397F injected cells are indicated with red stars and un-injected cells with white stars. (A-D) Levels of phosphorylated tyrosine 576 are elevated in HA-FERM overexpressing cells compared to controls. (E-H) Overexpression of HA-FERM Y397F has no effect on the endogenous levels of phosphorylated tyrosine 576. HA-FERM Y397F expressing cells have the same levels of phosphorylated endogenous FAK on tyrosine 576 with neighboring control cells. (I-L) Levels of phosphorylated tyrosine 861 are elevated in HA-FERM expressing cells compared to controls. (M-P) Overexpression of HA-FERM Y397F has no effect on the endogenous levels of phosphorylated tyrosine 861. HA-FERM Y397F expressing cells have the same levels of phosphorylated endogenous FAK on tyrosine 861 with neighboring control cells. (Q) Total lysates from HA-FERM injected gastrula stage embryos contain comparable levels of endogenous FAK as un-injected contro
