Explore
 Validate
 Learn
LearnPA1-957
antibody from Invitrogen Antibodies
Targeting: TNFRSF10B
CD262, DR5, KILLER, TRAIL-R2, TRAILR2, TRICK2A, TRICKB
 Western blot
Antibody data
- Antibody Data
- Antigen structure
- References [5]
- Comments [0]
- Validations
- Western blot [4]
- Immunocytochemistry [2]
- Flow cytometry [1]
- Other assay [1]
Submit
Validation data
Reference
Comment
Report error
- Product number
- PA1-957 - Provider product page

- Provider
- Invitrogen Antibodies
- Product name
- TRAIL-R2 (DR5) Polyclonal Antibody
- Antibody type
- Polyclonal
- Antigen
- Synthetic peptide
- Description
- PA1-957 detects death receptor 5 (DR5) from human and rat tissues and cells.
- Concentration
- 1 mg/mL
Submitted references Oxaliplatin resistance in colorectal cancer enhances TRAIL sensitivity via death receptor 4 upregulation and lipid raft localization.
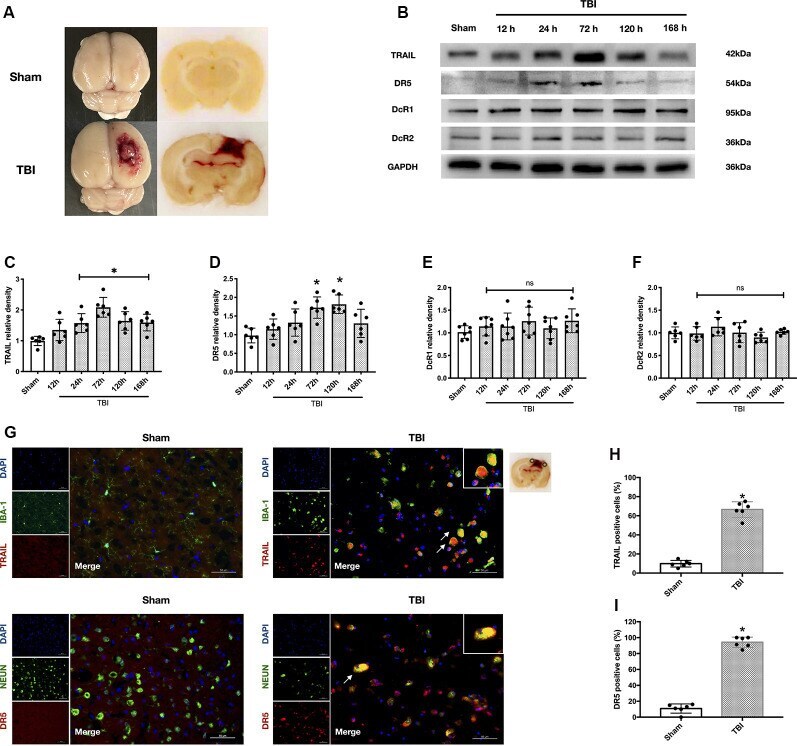
HIF-1α Mediates TRAIL-Induced Neuronal Apoptosis via Regulating DcR1 Expression Following Traumatic Brain Injury.
BCL2L10 protein regulates apoptosis/proliferation through differential pathways in gastric cancer cells.
Control of TRAIL-induced apoptosis by a family of signaling and decoy receptors.
Control of TRAIL-induced apoptosis by a family of signaling and decoy receptors.
Greenlee JD, Lopez-Cavestany M, Ortiz-Otero N, Liu K, Subramanian T, Cagir B, King MR
eLife 2021 Aug 3;10
eLife 2021 Aug 3;10
HIF-1α Mediates TRAIL-Induced Neuronal Apoptosis via Regulating DcR1 Expression Following Traumatic Brain Injury.
Fang Y, Lu J, Wang X, Wu H, Mei S, Zheng J, Xu S, Lenahan C, Chen S, Zhang J, Hong Y
Frontiers in cellular neuroscience 2020;14:192
Frontiers in cellular neuroscience 2020;14:192
BCL2L10 protein regulates apoptosis/proliferation through differential pathways in gastric cancer cells.
Xu JD, Cao XX, Long ZW, Liu XP, Furuya T, Xu JW, Liu XL, De Xu Z, Sasaki K, Li QQ
The Journal of pathology 2011 Feb;223(3):400-9
The Journal of pathology 2011 Feb;223(3):400-9
Control of TRAIL-induced apoptosis by a family of signaling and decoy receptors.
Sheridan JP, Marsters SA, Pitti RM, Gurney A, Skubatch M, Baldwin D, Ramakrishnan L, Gray CL, Baker K, Wood WI, Goddard AD, Godowski P, Ashkenazi A
Science (New York, N.Y.) 1997 Aug 8;277(5327):818-21
Science (New York, N.Y.) 1997 Aug 8;277(5327):818-21
No comments: Submit comment
Supportive validation
- Submitted by
- Invitrogen Antibodies (provider)
- Main image

- Experimental details
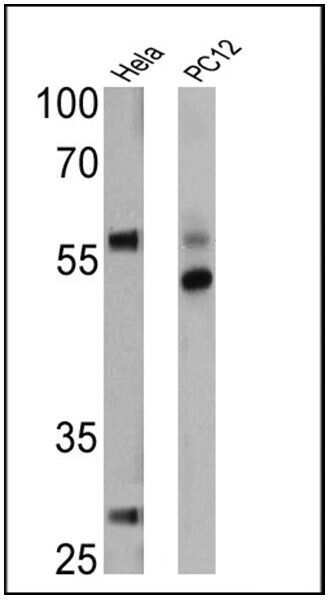
- Western blot analysis of TRAIL Receptor 2 was performed by loading 25 µg of Hela (lane 1) and PC12 (lane 2) cell lysates onto an SDS polyacrylamide gel. Proteins were transferred to a PVDF membrane and blocked at 4ºC overnight. The membrane was probed with a TRAIL Receptor 2 polyclonal antibody (Product # PA1-957) at a dilution of 1:1000 overnight at 4°C, washed in TBST, and probed with an HRP-conjugated secondary antibody for 1 hr at room temperature in the dark. Chemiluminescent detection was performed using Pierce ECL Plus Western Blotting Substrate (Product # 32132). Results show a band at ~58 kDa in Hela cells.
- Submitted by
- Invitrogen Antibodies (provider)
- Main image
- Experimental details
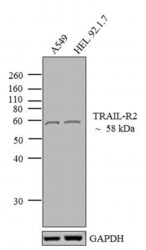
- Western blot analysis was performed on whole cell extracts (20 µg lysate) of A549 (Lane 1) and HEL 92.1.7 (Lane 2). The blots were probed with Anti-TRAIL-R2 Rabbit Polyclonal Antibody (Product # PA1-957, 0.5-2 µg/mL) and detected by chemiluminescence using Goat anti-Rabbit IgG (H+L) Superclonal™ Secondary Antibody, HRP conjugate (Product # A27036, 0.4 µg/mL, 1:2500 dilution). A 58 kDa band corresponding to TRAIL-R2 was observed across cell lines tested. Known quantity of protein samples were electrophoresed using Novex® NuPAGE® 4-12 % Bis-Tris gel (Product # NP0321BOX), XCell SureLock™ Electrophoresis System (Product # EI0002) and Novex® Sharp Pre-Stained Protein Standard (Product # LC5800). Resolved proteins were then transferred onto a nitrocellulose membrane with iBlot® 2 Dry Blotting System (Product # IB21001). The membrane was probed with the relevant primary and secondary Antibody following blocking with 5 % skimmed milk. Chemiluminescent detection was performed using Pierce™ ECL Western Blotting Substrate (Product # 32106).

- Submitted by
- Invitrogen Antibodies (provider)
- Main image

- Experimental details
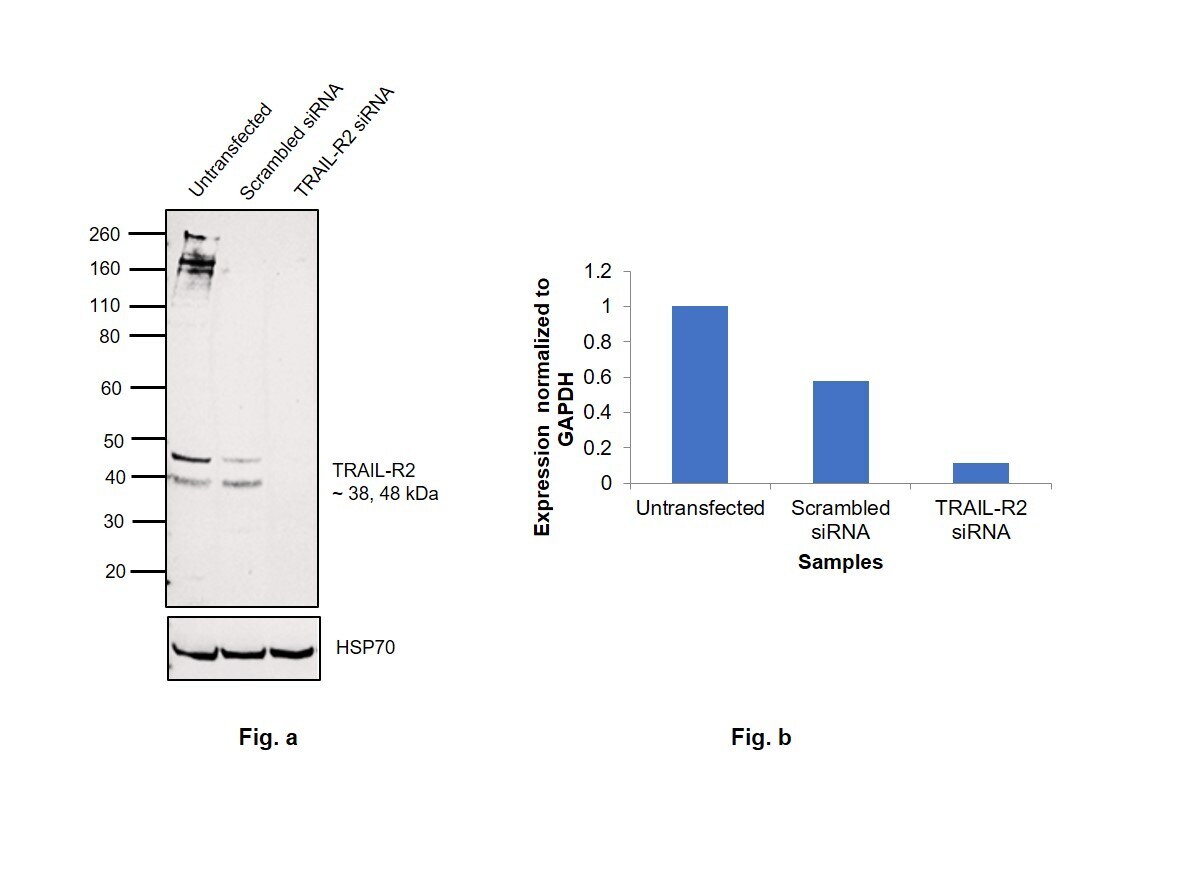
- Knockdown of TRAIL-R2 was achieved by transfecting HCT 116 cells with TRAIL-R2 specific siRNAs (Silencer® select Product # s16756 and s16757). Western blot analysis (Fig. a) was performed using membrane enriched extracts from the HCT 116 knockdown cells (lane 3), non-specific scrambled siRNA transfected cells (lane 2) and untransfected cells (lane 1). The blots were probed with TRAIL-R2 Rabbit Monoclonal Antibody (Product # PA1-957, 1 µg/ml) and Goat anti-Rabbit IgG (H+L) Superclonal™ Secondary Antibody, HRP (Product # A27036, 1:4000 dilution). Densitometric analysis of this western blot is shown in histogram (Fig. b). Decrease in signal upon siRNA mediated knock down confirms that antibody is specific to TRAIL-R2. Uncharacterized bands (*) were observed around 160-260 kDa.
- Submitted by
- Invitrogen Antibodies (provider)
- Main image
- Experimental details
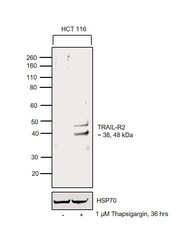
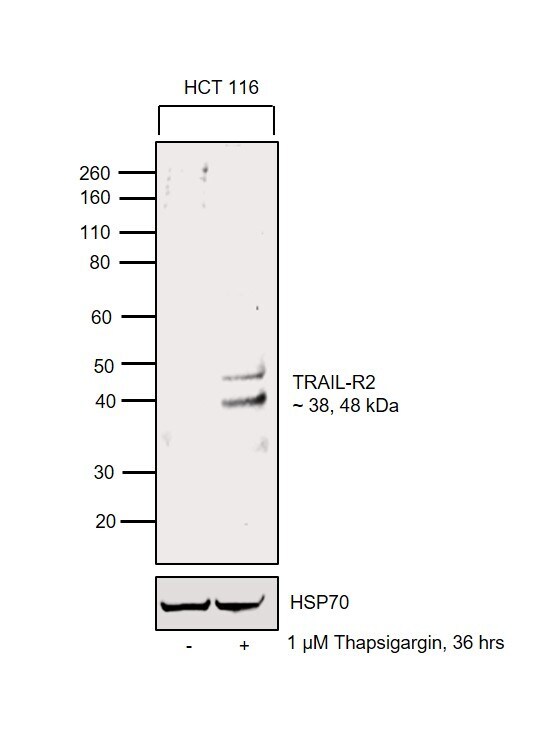
- Western blot was performed using Anti-TRAIL-R2 Rabbit Polyclonal Antibody (Product # PA1-957) and 38 kDa and 48 kDa bands corresponding to TRAIL-R2 were observed in HCT 116 cell line tested. Membrane enriched extracts (60 µg lysate) of HCT 116 (Lane 1) and HCT 116 treated with 1 µM Thapsigargin for 36 hours (Lane 2) were electrophoresed using Novex® NuPAGE® 4-12% Bis-Tris Protein Gel (Product # NP0322BOX). Resolved proteins were then transferred onto a nitrocellulose membrane (Product # IB23001) by iBlot® 2 Dry Blotting System (Product # IB21001). The blot was probed with the primary antibody (1 µg/mL) and detected by Goat anti-Rabbit IgG (H+L) Superclonal™ Secondary Antibody, HRP (Product # A27036, 1:4000 dilution) using the iBright FL 1000 (Product # A32752). Chemiluminescent detection was performed using Novex® ECL Chemiluminescent Substrate Reagent Kit (Product # WP20005).
Supportive validation
- Submitted by
- Invitrogen Antibodies (provider)
- Main image
- Experimental details
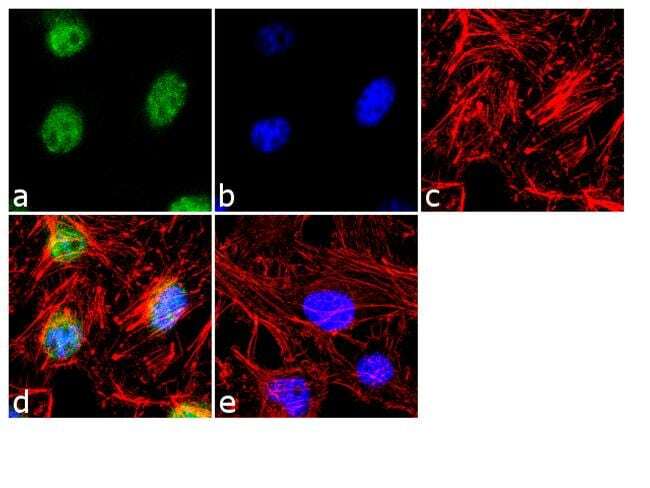
- Immunofluorescence analysis of TRAIL-R2/DR5 was done on 70% confluent log phase HeLa cell. The cells were fixed with 4% paraformaldehyde for 10 minutes, permeabilized with 0.1% Triton™ X-100 for 10 minutes, and blocked with 1% BSA for 1 hour at room temperature. The cells were labeled with TRAIL-R2/Rabbit Polyclonal Antibody (Product # PA1-957) at 2 µg/mL in 0.1% BSA and incubated for 3 hours at room temperature and then labeled with Goat anti-Rabbit IgG (H+L) Superclonal™ Secondary Antibody, Alexa Fluor® 488 conjugate (Product # A27034) at a dilution of 1:2000 for 45 minutes at room temperature (Panel a: green). Nuclei (Panel b: blue) were stained with SlowFade® Gold Antifade Mountant with DAPI (Product # S36938). F-actin (Panel c: red) was stained with Alexa Fluor® 555 Rhodamine Phalloidin (Product # R415, 1:300). Panel d is a merged image showing nuclear localization. Panel e is a no primary antibody control. The images were captured at 60X magnification.
- Submitted by
- Invitrogen Antibodies (provider)
- Main image
- Experimental details
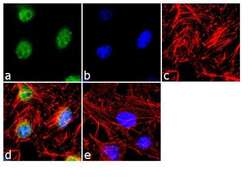
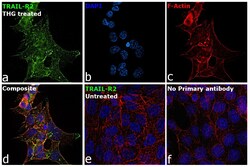
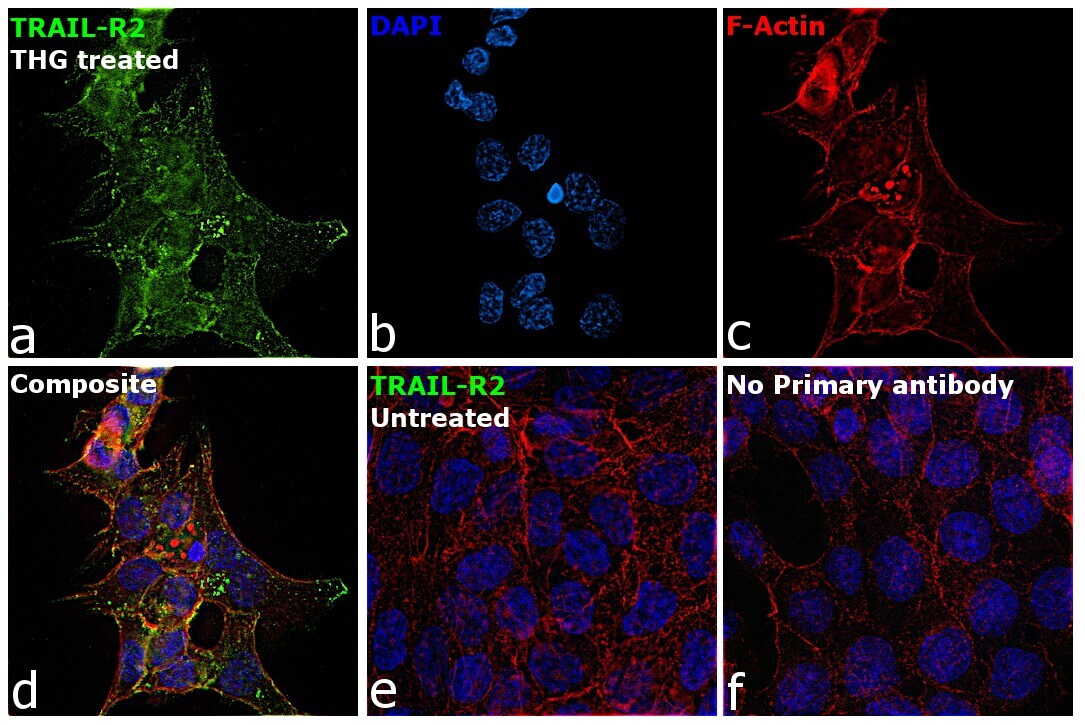
- Immunofluorescence analysis of TRAIL-R2 was performed using HCT 116 cells and HCT 116 treated with Thapsigargin (1 µM, 36 hours). The cells were fixed with 4% paraformaldehyde for 10 minutes, and blocked with 2% BSA for 1 hour at room temperature. The cells were labeled with TRAIL-R2 Rabbit Polyclonal Antibody (Product # PA1-957) at 2 µg/mL in 0.1% BSA and incubated overnight at 4 degree and then labeled with Donkey anti-Rabbit IgG (H+L) Highly Cross-Adsorbed Secondary Antibody, Alexa Fluor Plus 488 (Product # A32790) at a dilution of 1:2000 for 45 minutes at room temperature (Panel a: green) in HCT 116 treated cells. Nuclei (Panel b: blue) were stained with ProLong™ Diamond Antifade Mountant with DAPI (Product # P36962). F-actin (Panel c: red) was stained with Rhodamine Phalloidin (Product # R415, 1:300). Panel d represents the merged image of HCT116 treated cells, which shows higher expression for TRAIL-R2 protein showing localization in nucleus, cytoplasm and membrane. Panel e represents the merged image of untreated HCT 116 cells, that shows lower or no expression for TRAIL-R2 protein. Panel f represents control cells with no primary antibody to assess background. The images were captured at 60X magnification.
Supportive validation
- Submitted by
- Invitrogen Antibodies (provider)
- Main image

- Experimental details
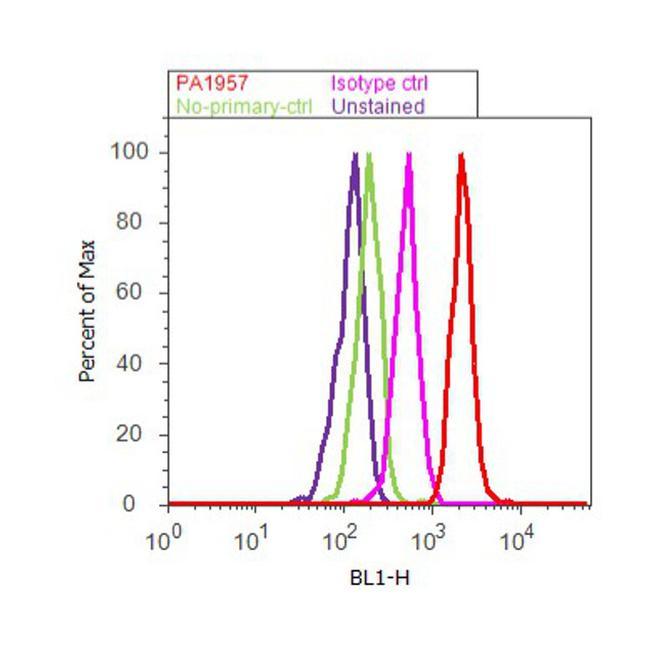
- Flow cytometry analysis of TRAIL-R2 / DR5 was done on A549 cells. Cells were fixed with 70% ethanol for 10 minutes, permeabilized with 0.25% Triton™ X-100 for 20 minutes, and blocked with 5% BSA for 30 minutes at room temperature. Cells were labeled with TRAIL-R2 / DR5 Rabbit Polyclonal Antibody (PA1957, red histogram) or with rabbit isotype control (pink histogram) at 3-5 ug/million cells in 2.5% BSA. After incubation at room temperature for 2 hours, the cells were labeled with Alexa Fluor® 488 Goat Anti-Rabbit Secondary Antibody (A11008) at a dilution of 1:400 for 30 minutes at room temperature. The representative 10,000 cells were acquired and analyzed for each sample using an Attune® Acoustic Focusing Cytometer. The purple histogram represents unstained control cells and the green histogram represents no-primary-antibody control.
Supportive validation
- Submitted by
- Invitrogen Antibodies (provider)
- Main image
- Experimental details
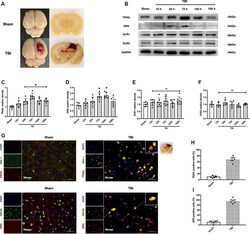
- Figure 2 Protein expression level and cellular localization of tumor necrosis factor-related apoptosis-inducing ligand (TRAIL) and death receptor 5 (DR5). (A) Representative picture of the traumatic brain injury (TBI) model. (B) Representative Western blot bands of each protein. (C) Densitometric quantification of TRAIL. (D) Densitometric quantification of DR5. (E) Densitometric quantification of decoy receptor 1 (DcR1). (F) Densitometric quantification of DcR2. (G) Representative microphotographs of immunofluorescence staining showing localization of TRAIL and DR5 (red), Iba-1 and NeuN (green) in injured cerebral cortex after TBI. Scale bar = 50 mum. (H) Quantification of TRAIL-positive cells in sham group and TBI group. (I) Quantification of DR5-positive cells in sham group and TBI group. Scale bar = 50 mum; N = 6 per group. Data are represented as mean +- SD. * p < 0.05 vs. sham; ns, no significance vs. sham. One-way ANOVA, Tukey's post hoc test .