Explore
 Validate
 Learn
Learn Western blot
 Immunocytochemistry
Antibody data
- Antibody Data
- Antigen structure
- References [1]
- Comments [0]
- Validations
- Immunocytochemistry [2]
- Immunohistochemistry [2]
- Other assay [3]
Submit
Validation data
Reference
Comment
Report error
- Product number
- PA5-27210 - Provider product page

- Provider
- Invitrogen Antibodies
- Product name
- MMP1 Polyclonal Antibody
- Antibody type
- Polyclonal
- Antigen
- Recombinant full-length protein
- Description
- Recommended positive controls: Raji, HUVEC, dermal fibroblast cells. Predicted reactivity: Pig (90%), Rabbit (86%), Bovine (83%). Store product as a concentrated solution. Centrifuge briefly prior to opening the vial.
- Reactivity
- Human, Mouse
- Host
- Rabbit
- Isotype
- IgG
- Vial size
- 100 μL
- Concentration
- 1.0 mg/mL
- Storage
- Store at 4°C short term. For long term storage, store at -20°C, avoiding freeze/thaw cycles.
Submitted references ITLN1 modulates invasive potential and metabolic reprogramming of ovarian cancer cells in omental microenvironment.
Au-Yeung CL, Yeung TL, Achreja A, Zhao H, Yip KP, Kwan SY, Onstad M, Sheng J, Zhu Y, Baluya DL, Co NN, Rynne-Vidal A, Schmandt R, Anderson ML, Lu KH, Wong STC, Nagrath D, Mok SC
Nature communications 2020 Jul 15;11(1):3546
Nature communications 2020 Jul 15;11(1):3546
No comments: Submit comment
Supportive validation
- Submitted by
- Invitrogen Antibodies (provider)
- Main image
- Experimental details
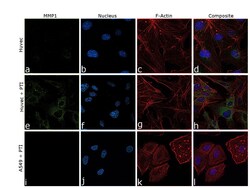
- Immunofluorescence analysis of MMP1 was performed using 70% confluent log phase HUVEC and A549 untreated and Protein Transport Inhibitor (PTI) treated cells. The cells were fixed with 4% Paraformaldehyde for 10 minutes, permeabilized with 0.1% Triton™ X-100 for 10 minutes, and blocked with 2% BSA for 10 minutes at room temperature. The cells were labeled with MMP1 Polyclonal Antibody (Product # PA5-27210) at 5 µg/mL in 0.1% BSA, incubated at 4 degree celsius overnight and then labeled with Goat anti-Rabbit IgG (H+L), Superclonal™ Recombinant Secondary Antibody, Alexa Fluor 488 (Product # A27034) at 1:2000 dilution for 45 minutes at room temperature (Panel a, e, i: Green). Nuclei (Panel b, f, j: Blue) were stained with SlowFade® Gold Antifade Mountant with DAPI (Product # S36938). F-actin (Panel c, g, k: Red) was stained with Rhodamine Phalloidin (Product # R415, 1:300). Panel d, h, l represents the merged image showing increased cytoplasmic localization of MMP1 in Huvec upon PTI treatment in comparison to untreated Huvec and also A549 treated with PTI which is reported as a low expressing model for A549 (Untreated A549 data not shown). The images were captured at 60X magnification.

- Submitted by
- Invitrogen Antibodies (provider)
- Main image

- Experimental details
- Immunofluorescence analysis of MMP1 was performed using 70% confluent log phase HUVEC and A549 untreated and Protein Transport Inhibitor (PTI) treated cells. The cells were fixed with 4% Paraformaldehyde for 10 minutes, permeabilized with 0.1% Triton™ X-100 for 10 minutes, and blocked with 2% BSA for 10 minutes at room temperature. The cells were labeled with MMP1 Polyclonal Antibody (Product # PA5-27210) at 5 µg/mL in 0.1% BSA, incubated at 4 degree celsius overnight and then labeled with Goat anti-Rabbit IgG (Heavy Chain), Superclonal™ Recombinant Secondary Antibody, Alexa Fluor 488 (Product # A27034) at 1:2000 dilution for 45 minutes at room temperature (Panel a, e, i: Green). Nuclei (Panel b, f, j: Blue) were stained with SlowFade® Gold Antifade Mountant with DAPI (Product # S36938). F-actin (Panel c, g, k: Red) was stained with Rhodamine Phalloidin (Product # R415, 1:300). Panel d, h, l represents the merged image showing increased cytoplasmic localization of MMP1 in Huvec upon PTI treatment in comparison to untreated Huvec and also A549 treated with PTI which is reported as a low expressing model for A549 (Untreated A549 data not shown). The images were captured at 60X magnification.

Supportive validation
- Submitted by
- Invitrogen Antibodies (provider)
- Main image

- Experimental details
- MMP1 Polyclonal Antibody detects MMP1 protein at cytoplasm by immunohistochemical analysis. Sample: Paraffin-embedded human endometrial carcinoma. MMP1 stained by MMP1 Polyclonal Antibody (Product # PA5-27210) diluted at 1:500. Antigen Retrieval: Citrate buffer, pH 6.0, 15 min.

Supportive validation
- Submitted by
- Invitrogen Antibodies (provider)
- Main image

- Experimental details
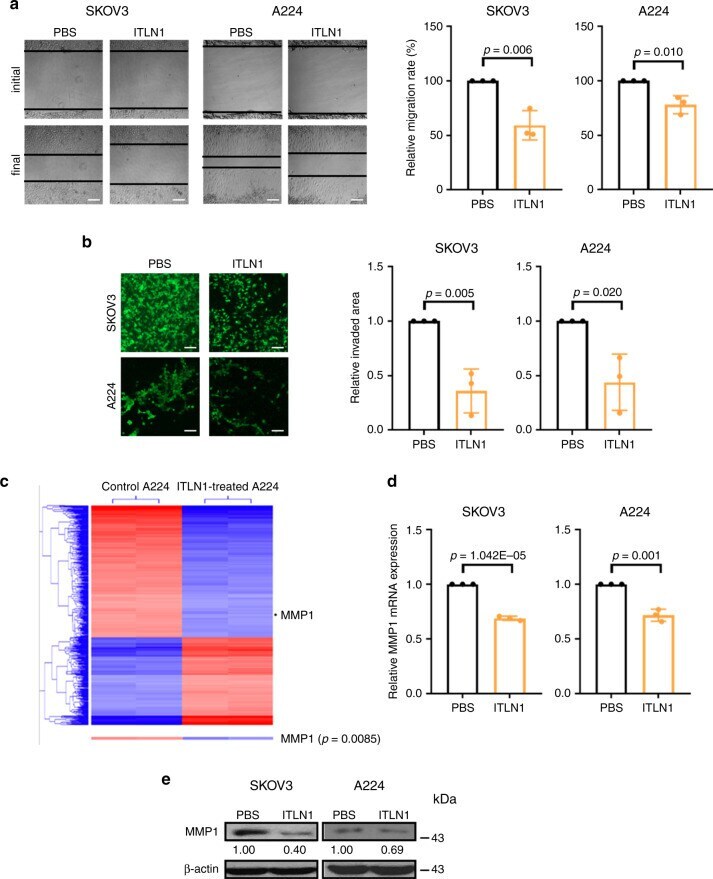
- Fig. 3 MMP1 mediates the effect of ITLN1 on suppressing ovarian cancers' motility. Representative microscopic images of ( a ) a wound-healing assay show that ITLN1 suppressed cell migration ability in SKOV3 and A224; b a cell invasion assay show that ITLN1 suppressed cell invasive potential in SKOV3 and A224. Bar = 50 mum. Results in the bar charts, presented as mean +- SD (two-tailed t -test), show the average from three independent experiments with duplicated samples. PBS phosphate-buffered saline. c Heat map from a transcriptome profiling analysis shows that MMP1 expression is significantly decreased in ITLN1-treated A224 ( n = 2) compared with control A224 without ITLN1 treatment ( n = 2). d QRT-PCR analysis shows a lower MMP1 mRNA level in ITLN1-treated SKOV3 and A224 compared with control cells treated with PBS. Results, as presented as mean +- SD (two-tailed t -test), show the average from three independent experiments. e Western blot analysis shows a lower MMP1 protein level in ITLN1-treated SKOV3 and A224 compared with control cells treated with PBS. beta-actin served as a loading control. Relative normalized protein levels with respect to the corresponding control are presented. Three independent experiments were performed.
- Submitted by
- Invitrogen Antibodies (provider)
- Main image
- Experimental details
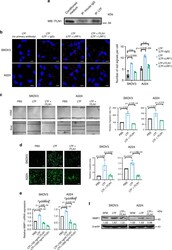
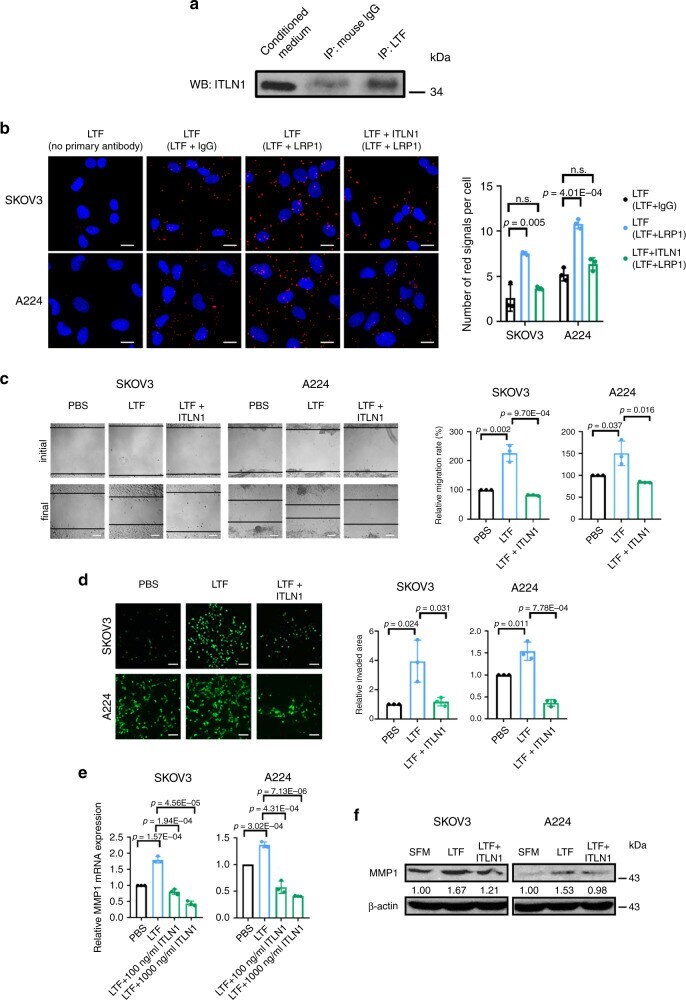
- Fig. 4 ITLN1 abrogates LTF's effects on ovarian cancer cells' motility. a Western blot analysis shows ITLN1 on proteins pulled down by an anti-LTF antibody. Normal mouse IgG served as a control. ITLN1 band size = 34 kDa. b Representative microscopic images from a Duolink proximity ligation assay (PLA) on SKOV3 and A224 shows the interaction between LTF and LRP1 while ITLN1 reduced the interaction. Red fluorescent signals indicate protein-protein interaction; nuclei were stained with 4,6-diamidino-2-phenylindole (DAPI) blue. Staining with no primary antibody and with anti-LTF antibody plus normal rabbit IgG served as controls. Bar = 5 mum. Representative microscopic images show that LTF induced c cell migration ability and d cell invasion potential in SKOV3 and A224 compared with control cells, while ITLN1 counteracted the effect. Bar = 50 mum. e Bar charts show that LTF upregulated the relative MMP1 mRNA expression in SKOV3 and A224, while ITLN1 counteracted the effect. f Western blot analysis shows that LTF upregulated MMP1 protein expression in SKOV3 and A224, while ITLN1 counteracted the effect. beta-actin served as a loading control. Relative normalized protein levels with respect to the corresponding control are presented. Three independent experiments were performed. b , e Results from three independent experiments were averaged and are shown as mean +- SD (two-tailed t -test). n. s. not significant ( p > 0.05).
- Submitted by
- Invitrogen Antibodies (provider)
- Main image
- Experimental details
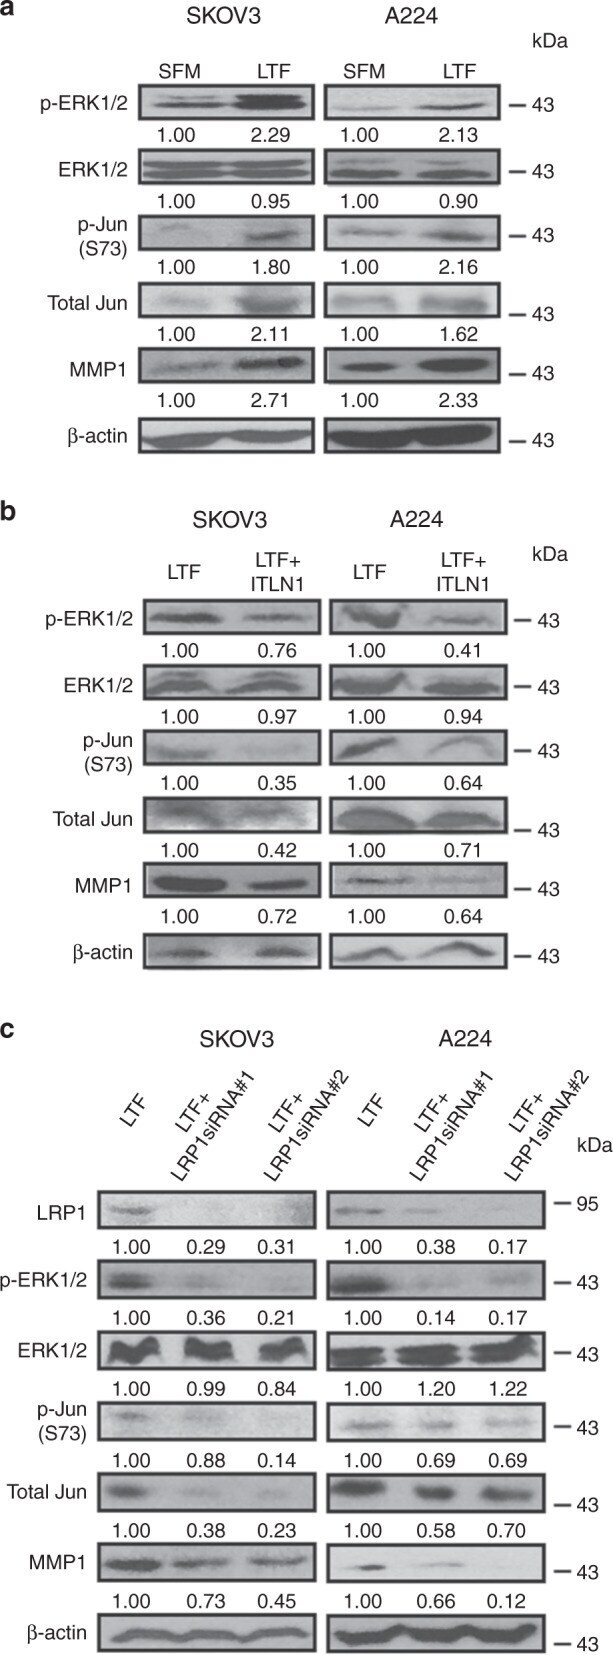
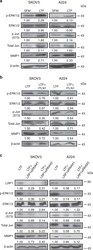
- Fig. 5 ITLN1 inhibits the LTF/LRP1/MMP1 signaling pathway. Western blot analyses show ( a ) higher protein levels of p-ERK1/2, p-Jun (S73), total Jun, and MMP1 in LTF-treated (100 mug mL -1 ) SKOV3 and A224 compared with control cells without treatment; b lower protein levels of p-ERK1/2, p-Jun (S73), total Jun, and MMP1 in LTF-treated SKOV3 and A224 with ITLN1 (500 ng mL -1 ) compared with control cells without ITLN1; and c lower protein levels of LRP1, p-ERK1/2, p-Jun (S73), total Jun, and MMP1 in LTF-treated SKOV3 and A224 with LRP1-specific siRNAs compared with control cells with negative siRNA. beta-actin served as a loading control. Relative normalized protein levels with respect to the corresponding control are presented. Three independent experiments were performed.