Explore
 Validate
 Learn
Learn Western blot
Antibody data
- Antibody Data
- Antigen structure
- References [1]
- Comments [0]
- Validations
- Western blot [1]
- Other assay [1]
Submit
Validation data
Reference
Comment
Report error
- Product number
- 40-1000 - Provider product page

- Provider
- Invitrogen Antibodies
- Product name
- NACA Polyclonal Antibody
- Antibody type
- Polyclonal
- Antigen
- Other
- Reactivity
- Human, Mouse, Rat
- Host
- Rabbit
- Isotype
- IgG
- Vial size
- 100 µg
- Concentration
- 0.25 mg/mL
- Storage
- -20°C
Submitted references Utility of Claudin-3 in extracellular vesicles from human bile as biomarkers of cholangiocarcinoma.
Ikeda C, Haga H, Makino N, Inuzuka T, Kurimoto A, Ueda T, Matsuda A, Kakizaki Y, Ishizawa T, Kobayashi T, Sugahara S, Tsunoda M, Suda K, Ueno Y
Scientific reports 2021 Jan 13;11(1):1195
Scientific reports 2021 Jan 13;11(1):1195
No comments: Submit comment
Supportive validation
- Submitted by
- Invitrogen Antibodies (provider)
- Main image

- Experimental details
- Western blot analysis was performed on whole cell extracts of SH-SY5Y (Lane 1), Caco-2 (Lane 2), A431 (Lane 3), and HEK-293 (Lane 4). The blot was probed with Anti-NACA (alpha-NAC) Rabbit Polyclonal Antibody (Product # 40-1000, 2 µg/mL) and detected by chemiluminescence using Goat anti-Rabbit IgG (H+L) Superclonal™ Secondary Antibody, HRP conjugate (Product # A27036, 0.4 µg/mL, 1:2500 dilution). A 23 kDa band corresponding to NACA (alpha-NAC) was observed across the cell lines tested. Known quantity of protein samples were electrophoresed using Novex® NuPAGE® ; 12% Bis-Tris gel (Product # NP0342BOX), XCell SureLock™ Electrophoresis System (Product # EI0002) and Novex® Sharp Pre-Stained Protein Standard (Product # LC5800). Resolved proteins were then transferred onto a nitrocellulose membrane with iBlot® 2 Dry Blotting System (Product # IB21001). The membrane was probed with the relevant primary and secondary Antibody. Chemiluminescent detection was performed using Pierce™ ECL Western Blotting Substrate (Product # 32106).

Supportive validation
- Submitted by
- Invitrogen Antibodies (provider)
- Main image
- Experimental details
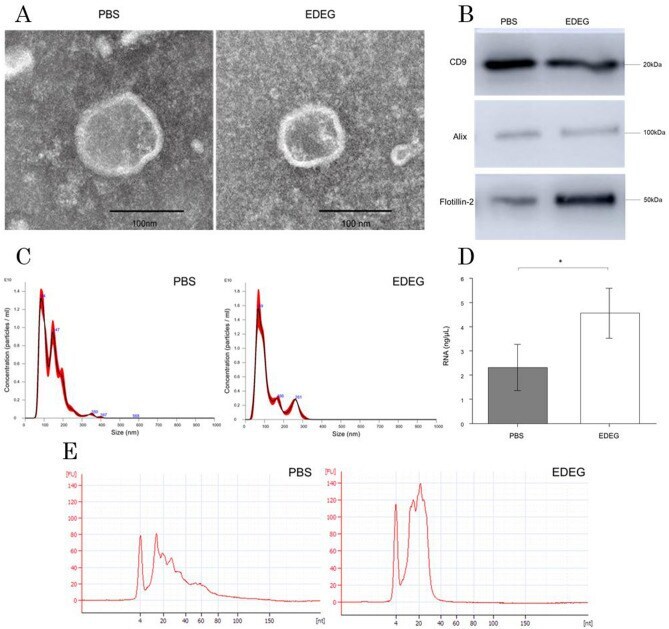
- Figure 1 Comparison of the PBS and EDEG groups in EVs. ( A ) TEM image of EVs derived from human bile samples. Both the PBS and EDEG groups contained circular and cup-shaped nanoparticles, which are representative of EVs. The scale bar represents 100 nm. ( B ) Western blot analysis of exosome marker proteins (CD9, ALIX, and Flollitin-2). Exosome marker proteins were detected in both EDEG and PBS groups. ( C ) Nanoparticle tracking analysis of human bile-derived EVs. Representative particle size distribution maps of the PBS and EDEG groups are shown. The particle concentration was 1.92 x 10 12 /mL in the PBS group and 1.93 x 10 12 /mL in the EDEG group. The particle mode was 82.4 nm in the PBS group and 78.9 nm in the EDEG group and was smaller in the EDEG group. ( D ) Comparison of the concentration of RNA extracted from EVs as measured using Qubit 3.0 Fluorometer. The RNA concentration was 2.32 +- 0.96 ng/uL in the PBS group and 4.56 +- 1.03 ng/uL in the EDEG group, which indicated that RNA concentration was significantly higher in the EDEG group. *p < 0.05. ( E ) Bioanalyzer electropherograms of the size distribution of miRNA from EVs. The percentage of microRNA (10-40 nt) out of the small RNA (6-150 nt) detected was 84% in the PBS group and 97% in the EDEG group. The miRNA concentration was 1.96 ng/uL in the PBS group and 3.08 ng/uL in the EDEG group. Lower marker peak was at 4 nt, FU fluorescence units.