 Explore
 Validate
 Learn
Learn Western blot
 Immunoprecipitation
 Other assay
Antibody data
- Antibody Data
- Antigen structure
- References [14]
- Comments [0]
- Validations
- Other assay [20]
Submit
Validation data
Reference
Comment
Report error
- Product number
- 37-0400 - Provider product page

- Provider
- Invitrogen Antibodies
- Product name
- TSC1 Monoclonal Antibody (5C8A12)
- Antibody type
- Monoclonal
- Antigen
- Recombinant full-length protein
- Reactivity
- Human
- Host
- Mouse
- Isotype
- IgG
- Antibody clone number
- 5C8A12
- Vial size
- 100 µg
- Concentration
- 0.5 mg/mL
- Storage
- -20°C
Submitted references G3BPs tether the TSC complex to lysosomes and suppress mTORC1 signaling.
miR-20b and miR-451a Are Involved in Gastric Carcinogenesis through the PI3K/AKT/mTOR Signaling Pathway: Data from Gastric Cancer Patients, Cell Lines and Ins-Gas Mouse Model.
MicroRNA-92b-3p is a prognostic oncomiR that targets TSC1 in clear cell renal cell carcinoma.
R2TP/Prefoldin-like component RUVBL1/RUVBL2 directly interacts with ZNHIT2 to regulate assembly of U5 small nuclear ribonucleoprotein.
Pharmacological inhibition of Polo-like kinase 1 (PLK1) by BI-2536 decreases the viability and survival of hamartin and tuberin deficient cells via induction of apoptosis and attenuation of autophagy.
Regulation of YAP by mTOR and autophagy reveals a therapeutic target of tuberous sclerosis complex.
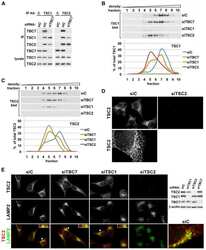
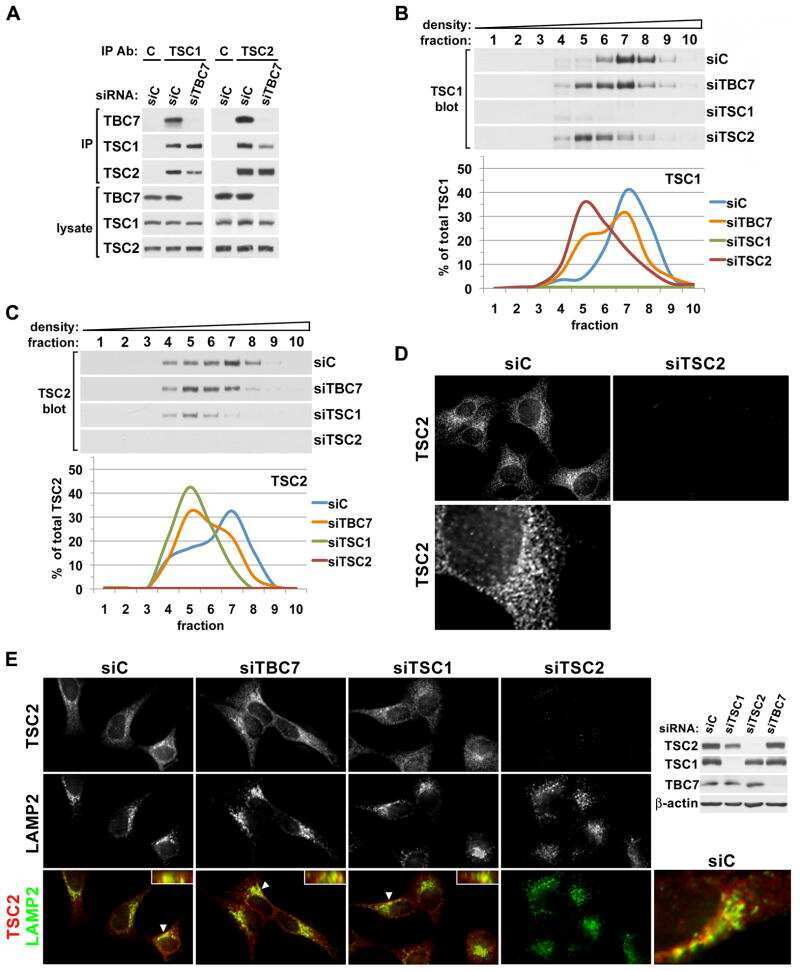
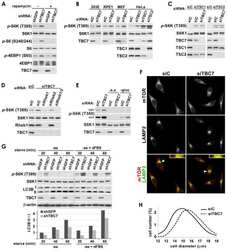
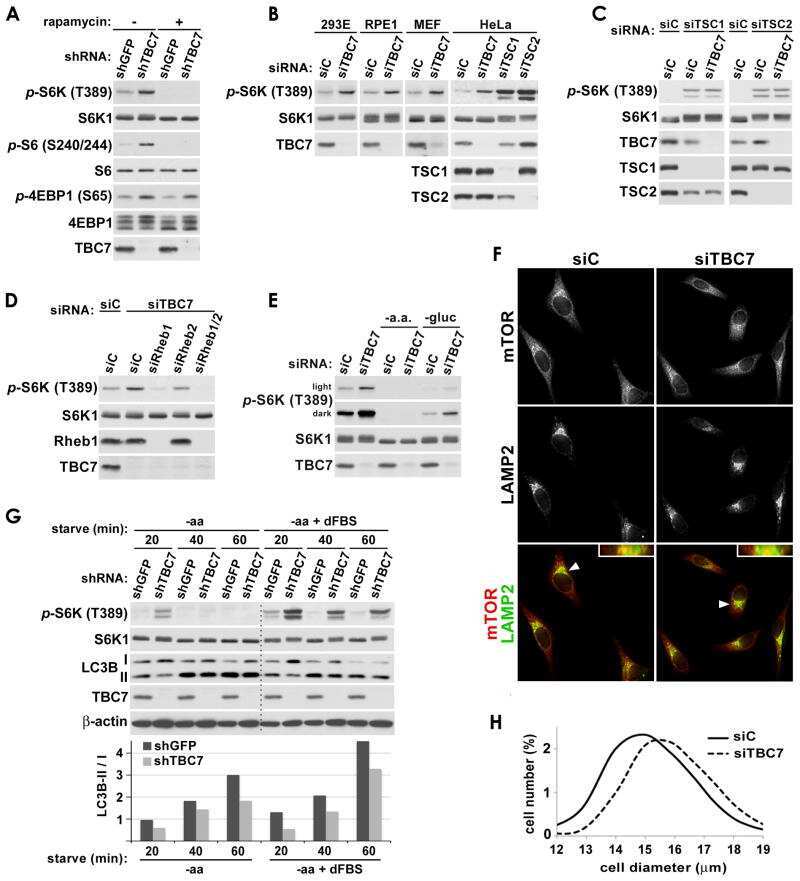
Spatial control of the TSC complex integrates insulin and nutrient regulation of mTORC1 at the lysosome.
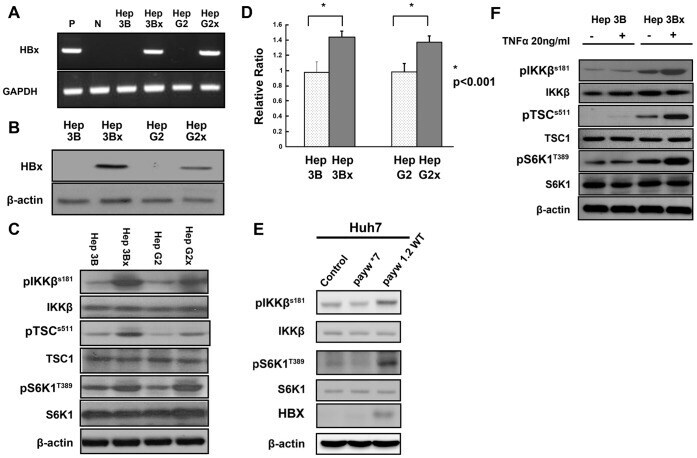
Hepatitis B virus X protein upregulates mTOR signaling through IKKβ to increase cell proliferation and VEGF production in hepatocellular carcinoma.
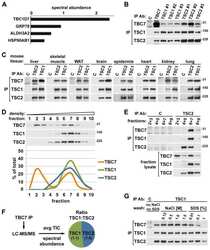
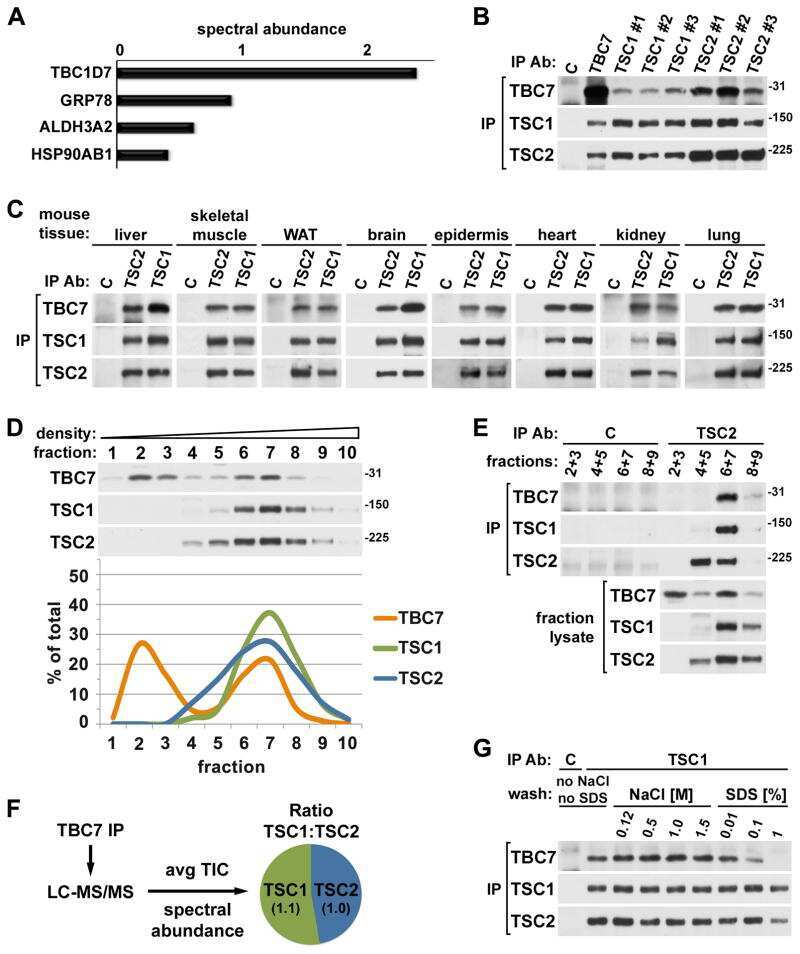
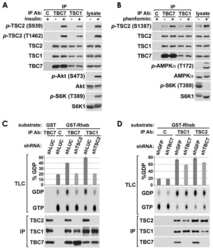
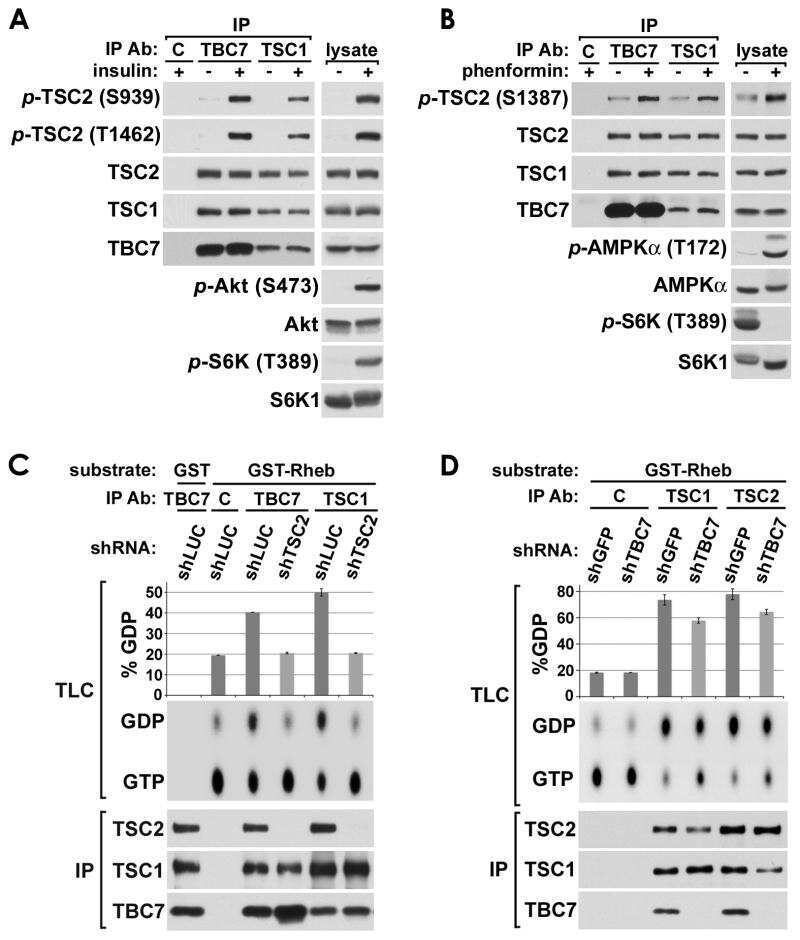
TBC1D7 is a third subunit of the TSC1-TSC2 complex upstream of mTORC1.
ARD1 stabilization of TSC2 suppresses tumorigenesis through the mTOR signaling pathway.
Role of N-end rule ubiquitin ligases UBR1 and UBR2 in regulating the leucine-mTOR signaling pathway.
The tuberous sclerosis proteins regulate formation of the primary cilium via a rapamycin-insensitive and polycystin 1-independent pathway.
Clinicopathological and immunohistochemical findings in an autopsy case of tuberous sclerosis complex.
IKK beta suppression of TSC1 links inflammation and tumor angiogenesis via the mTOR pathway.
Prentzell MT, Rehbein U, Cadena Sandoval M, De Meulemeester AS, Baumeister R, Brohée L, Berdel B, Bockwoldt M, Carroll B, Chowdhury SR, von Deimling A, Demetriades C, Figlia G, Genomics England Research Consortium, de Araujo MEG, Heberle AM, Heiland I, Holzwarth B, Huber LA, Jaworski J, Kedra M, Kern K, Kopach A, Korolchuk VI, van 't Land-Kuper I, Macias M, Nellist M, Palm W, Pusch S, Ramos Pittol JM, Reil M, Reintjes A, Reuter F, Sampson JR, Scheldeman C, Siekierska A, Stefan E, Teleman AA, Thomas LE, Torres-Quesada O, Trump S, West HD, de Witte P, Woltering S, Yordanov TE, Zmorzynska J, Opitz CA, Thedieck K
Cell 2021 Feb 4;184(3):655-674.e27
Cell 2021 Feb 4;184(3):655-674.e27
miR-20b and miR-451a Are Involved in Gastric Carcinogenesis through the PI3K/AKT/mTOR Signaling Pathway: Data from Gastric Cancer Patients, Cell Lines and Ins-Gas Mouse Model.
Streleckiene G, Inciuraite R, Juzenas S, Salteniene V, Steponaitiene R, Gyvyte U, Kiudelis G, Leja M, Ruzgys P, Satkauskas S, Kupcinskiene E, Franke S, Thon C, Link A, Kupcinskas J, Skieceviciene J
International journal of molecular sciences 2020 Jan 29;21(3)
International journal of molecular sciences 2020 Jan 29;21(3)
MicroRNA-92b-3p is a prognostic oncomiR that targets TSC1 in clear cell renal cell carcinoma.
Wang C, Uemura M, Tomiyama E, Matsushita M, Koh Y, Nakano K, Hayashi Y, Ishizuya Y, Jingushi K, Kato T, Hatano K, Kawashima A, Ujike T, Nagahara A, Fujita K, Imamura R, Tsujikawa K, Nonomura N
Cancer science 2020 Apr;111(4):1146-1155
Cancer science 2020 Apr;111(4):1146-1155
R2TP/Prefoldin-like component RUVBL1/RUVBL2 directly interacts with ZNHIT2 to regulate assembly of U5 small nuclear ribonucleoprotein.
Cloutier P, Poitras C, Durand M, Hekmat O, Fiola-Masson É, Bouchard A, Faubert D, Chabot B, Coulombe B
Nature communications 2017 May 31;8:15615
Nature communications 2017 May 31;8:15615
Pharmacological inhibition of Polo-like kinase 1 (PLK1) by BI-2536 decreases the viability and survival of hamartin and tuberin deficient cells via induction of apoptosis and attenuation of autophagy.
Valianou M, Cox AM, Pichette B, Hartley S, Paladhi UR, Astrinidis A
Cell cycle (Georgetown, Tex.) 2015;14(3):399-407
Cell cycle (Georgetown, Tex.) 2015;14(3):399-407
Regulation of YAP by mTOR and autophagy reveals a therapeutic target of tuberous sclerosis complex.
Liang N, Zhang C, Dill P, Panasyuk G, Pion D, Koka V, Gallazzini M, Olson EN, Lam H, Henske EP, Dong Z, Apte U, Pallet N, Johnson RL, Terzi F, Kwiatkowski DJ, Scoazec JY, Martignoni G, Pende M
The Journal of experimental medicine 2014 Oct 20;211(11):2249-63
The Journal of experimental medicine 2014 Oct 20;211(11):2249-63
Spatial control of the TSC complex integrates insulin and nutrient regulation of mTORC1 at the lysosome.
Menon S, Dibble CC, Talbott G, Hoxhaj G, Valvezan AJ, Takahashi H, Cantley LC, Manning BD
Cell 2014 Feb 13;156(4):771-85
Cell 2014 Feb 13;156(4):771-85
Hepatitis B virus X protein upregulates mTOR signaling through IKKβ to increase cell proliferation and VEGF production in hepatocellular carcinoma.
Yen CJ, Lin YJ, Yen CS, Tsai HW, Tsai TF, Chang KY, Huang WC, Lin PW, Chiang CW, Chang TT
PloS one 2012;7(7):e41931
PloS one 2012;7(7):e41931
TBC1D7 is a third subunit of the TSC1-TSC2 complex upstream of mTORC1.
Dibble CC, Elis W, Menon S, Qin W, Klekota J, Asara JM, Finan PM, Kwiatkowski DJ, Murphy LO, Manning BD
Molecular cell 2012 Aug 24;47(4):535-46
Molecular cell 2012 Aug 24;47(4):535-46
ARD1 stabilization of TSC2 suppresses tumorigenesis through the mTOR signaling pathway.
Kuo HP, Lee DF, Chen CT, Liu M, Chou CK, Lee HJ, Du Y, Xie X, Wei Y, Xia W, Weihua Z, Yang JY, Yen CJ, Huang TH, Tan M, Xing G, Zhao Y, Lin CH, Tsai SF, Fidler IJ, Hung MC
Science signaling 2010 Feb 9;3(108):ra9
Science signaling 2010 Feb 9;3(108):ra9
Role of N-end rule ubiquitin ligases UBR1 and UBR2 in regulating the leucine-mTOR signaling pathway.
Kume K, Iizumi Y, Shimada M, Ito Y, Kishi T, Yamaguchi Y, Handa H
Genes to cells : devoted to molecular & cellular mechanisms 2010 Apr 1;15(4):339-49
Genes to cells : devoted to molecular & cellular mechanisms 2010 Apr 1;15(4):339-49
The tuberous sclerosis proteins regulate formation of the primary cilium via a rapamycin-insensitive and polycystin 1-independent pathway.
Hartman TR, Liu D, Zilfou JT, Robb V, Morrison T, Watnick T, Henske EP
Human molecular genetics 2009 Jan 1;18(1):151-63
Human molecular genetics 2009 Jan 1;18(1):151-63
Clinicopathological and immunohistochemical findings in an autopsy case of tuberous sclerosis complex.
Boer K, Troost D, Jansen F, Nellist M, van den Ouweland AM, Geurts JJ, Spliet WG, Crino P, Aronica E
Neuropathology : official journal of the Japanese Society of Neuropathology 2008 Dec;28(6):577-90
Neuropathology : official journal of the Japanese Society of Neuropathology 2008 Dec;28(6):577-90
IKK beta suppression of TSC1 links inflammation and tumor angiogenesis via the mTOR pathway.
Lee DF, Kuo HP, Chen CT, Hsu JM, Chou CK, Wei Y, Sun HL, Li LY, Ping B, Huang WC, He X, Hung JY, Lai CC, Ding Q, Su JL, Yang JY, Sahin AA, Hortobagyi GN, Tsai FJ, Tsai CH, Hung MC
Cell 2007 Aug 10;130(3):440-55
Cell 2007 Aug 10;130(3):440-55
No comments: Submit comment
Supportive validation
- Submitted by
- Invitrogen Antibodies (provider)
- Main image
- Experimental details
- NULL
- Submitted by
- Invitrogen Antibodies (provider)
- Main image
- Experimental details
- NULL
- Submitted by
- Invitrogen Antibodies (provider)
- Main image
- Experimental details
- NULL
- Submitted by
- Invitrogen Antibodies (provider)
- Main image
- Experimental details
- NULL
- Submitted by
- Invitrogen Antibodies (provider)
- Main image
- Experimental details
- NULL
- Submitted by
- Invitrogen Antibodies (provider)
- Main image

- Experimental details
- NULL
- Submitted by
- Invitrogen Antibodies (provider)
- Main image

- Experimental details
- Figure 1. PLK1 protein levels are increased in hamartin and tuberin deficient cells and arerapamycin-sensitive. ( A ) Lysates from exponentially growing Tsc1 +/- , Tsc1 -/- , Tsc2 +/+ / Tp53 -/- and Tsc2 -/- / Tp53 -/- MEF were immunoblotted with the indicated antibodies. ( B ) Lysates from Tsc1 -/- MEF transduced with vector(208-P2) or TSC1 (208-T3), and from tuberin-deficient ELT3 cells transduced withvector (ELT3-V3) or TSC2 (ELT3-T3) were immunoblotted with the indicated antibodies.( C ) Lysates from Tsc1 +/- and Tsc1 -/- MEF treated for 24 hours with0, 50 or 100 nM rapamycin were immunoblotted with the indicated antibodies.PLK1 protein levels normalized to beta-actin and to vehicle-treated Tsc1 +/- MEF are indicated below the PLK1immunoblots.

- Submitted by
- Invitrogen Antibodies (provider)
- Main image

- Experimental details
- Figure 1. Hamartin localizes to the basal body of ciliated human RPE1 and HK-2 cells. RPE1 and HK-2 cells were serum starved for 48 h to induce cilia formation. ( A ) RPE1 cells were fixed and immunostained with anti-gamma-tubulin antibody (red) to identify centrosomes, and anti-hamartin antibody (TSC1, green). Arrowheads indicate hamartin localization at the centrosome. ( B ) RPE1 cells were fixed and immunostained with anti-alpha-acetylated tubulin antibody (red) to identify cilia, and anti-hamartin antibody (TSC1, green). Arrows indicate hamartin at the base of the primary cilia, and arrowheads indicate hamartin in the centrosome of cells lacking a primary cilium. ( C ) HK-2 cells were fixed and immunostained with anti-alpha-acetylated tubulin antibody (red) to identify cilia, and anti-hamartin antibody (TSC1, green). Arrow indicates hamartin at the base of the primary cilium. Nuclei were stained with DAPI. All images shown at x100 magnification.

- Submitted by
- Invitrogen Antibodies (provider)
- Main image

- Experimental details
- Figure 2. Loss of hamartin (Tsc1) enhances ciliary formation. ( A ) Western immunoblot of Tsc1 -/- and Tsc1 +/+ cells showing hamartin levels with beta-actin as a loading control. ( B and C ) MEFs were maintained at confluency for 48 h to induce cilia formation. Cells were fixed and immunostained with anti-alpha-acetylated tubulin antibody (cilia, green) and anti-gamma-tubulin antibody (centrosomes/basal body, red). Nuclei were stained with DAPI. Arrows indicate the primary cilia. x100 magnification. ( D ) Percentage of cells containing a primary cilium is shown, asterisk indicates P < 0.005. ( E ) Western immunoblot of Tsc1 re-introduction cell lines Tsc1 -/- /vector (stably expressing empty vector) and Tsc1 -/- /TSC1 (stably expressing TSC1) showing hamartin levels with beta-actin as a loading control. Phospho-S6 levels are decreased in cells expressing hamartin, as expected. ( F ) MEFs were maintained at confluency for 48 h to induce cilia formation. Percentage of cells containing a primary cilium is shown, asterisk indicates P < 0.005. ( G ) Cells were grown in full serum at subconfluent levels for 24 h. Percentage of cells containing a primary cilium is shown, asterisk indicates P < 0.005.

- Submitted by
- Invitrogen Antibodies (provider)
- Main image

- Experimental details
- Figure 1 The IKKbeta/TSC1/mTOR signaling pathway is activated by HBx. (A). Expression of HBx mRNA in Hep3Bx, HepG2x, and parental Hep3B and HepG2 cells was detected using semi-quantitative RT-PCR. Levels of GAPDH mRNA were used as an internal control. RNAs of a HBV-positive patient's serum (P) and RNAs of a control HBV-negative serum (N) were used as controls. (B). Levels of HBx protein were detected in lysates of Hep3Bx, HepG2x, and parental Hep3B and HepG2 cells using Western blotting by antibody specific against HBx protein and beta-actin. (C). Levels of pIKKbeta(S181), pTSC1 (S511), pS6K1 (T389), total IKKbeta, total TSC1, total S6K1, and beta-actin were assessed in lysates of Hep3Bx, HepG2x, and parental Hep3B and HepG2 cells using Western blotting by specific antibody as indicated. (D). Data shown are ratios of viable cells in Hep3Bx and HepG2x cells relative to that in Hep3B and HepG2 cells (set as 1), respectively, at 24 h after seeding using MTT assay. (E). Levels of pIKKbeta (S181), pS6K1 (T389), total IKKbeta, total S6K1, HBx, and beta-actin were assessed in lysates of Huh7 cells transfected with empty vector alone, payw1.2WT, or payw*7. (F). Levels of pIKKbeta (S181), pTSC1 (S511), pS6K1 (T389), total IKKbeta, total TSC1, total S6K1, and beta-actin were assessed in lysates of Hep3B and Hep3Bx with or without TNF-alpha treatment using Western blotting as described earlier.
- Submitted by
- Invitrogen Antibodies (provider)
- Main image

- Experimental details
- Figure 2 TNF-alpha-stimulated increases of pTSC1 (S511), pS6K1 (T389) and cell proliferation in Hep3Bx and HepG2x cells are blocked by the IKKbeta inhibitor Bay 11-7082, siRNA specific for IKKbeta, and the mTOR inhibitor rapamycin. (A). Lysates of Hep3Bx and HepG2x cells treated with or without TNF-alpha in the presence or absence of Bay 11-7082 were analyzed for levels of pIKKbeta (S181), pTSC1 (S511), pS6K1 (T389), total IKKbeta, total TSC1, total S6K1, and beta-actin using Western blotting as described earlier. (B). Lysates of Hep3Bx and HepG2x cells with transfection of IKKbetasiRNAs or control siRNAs were assessed for levels of pTSC1 (S511), pS6K1 (T389), total IKKbeta, total TSC1, total S6K1, and beta-actin. (C). Lysates of Hep3Bx and HepG2x cells treated with or without TNF-alpha in the presence or absence of rapamycin were analyzed for levels of pIKKbeta (S181), pS6K1 (T389), total IKKbeta, and total S6K1. (D). Data shown are ratios of viable cells in Hep3B, Hep3Bx, HepG2, and HepG2x cells treated with or without TNF-alpha in the presence or absence of Bay11-7082 or rapamycin relative to that in Hep3B and HepG2 cells without any treatment (set as 1), at 24 h after seeding using MTT assay. Data are shown as means +- S.D. of three experiments. Comparisons were made between different groups as indicated. *P

- Submitted by
- Invitrogen Antibodies (provider)
- Main image

- Experimental details
- Figure 1. Mosaic- Tsc1 KO mice develop multisystem lesions showing similarities with human TSC. (a) Genomic DNA was prepared from control (ctrl) and mosaic- Tsc1 KO mice 1.5 mo after tamoxifen injection, and the floxed/mutant alleles were detected by PCR in the indicated organs. (b) Expression of phospho-rpS6 in cerebral cortex sections from ctrl and mosaic- Tsc1 KO mice was analyzed by immunohistochemical staining. (c) Skin samples of ctrl and mosaic- Tsc1 KO mice were stained for ICAM-1 expression and using Trichrome. Arrows indicate ICAM-1 + vessels. (d) Plasma urea concentrations were determined in ctrl and mosaic- Tsc1 KO kidneys (Mean +- SEM; n = 4 mice/group; *, P < 0.05). Bars, 100 um. Three independent pregnant females were injected with tamoxifen. For immunohistochemistry analysis, similar stainings were found in four different ctrl/mosaic- Tsc1 KO mice (6 wk of age, two sections per mouse).

- Submitted by
- Invitrogen Antibodies (provider)
- Main image

- Experimental details
- Figure 2. Mosaic- Tsc1 KO mice develop renal mesenchymal lesions recapitulating PEComas associated with human TSC. Kidneys from ctrl ( n = 3) and mosaic- Tsc1 KO ( n = 3) mice were analyzed at 6 wk of age. (a) Macroscopic photos and representative H&E staining. Arrows indicate hemorrhages. (b-d) Expression of vimentin (b and c), phospho-rpS6, and Ki67 (c) and Hmb45/Pmel (d) was assessed by immunohistochemistry. H&E staining was shown on left in c. Arrows in b indicate vimentin + microhamartomas in mosaic- Tsc1 KO kidneys. For immunohistochemistry analysis, similar stainings were found in three different ctrl/mosaic- Tsc1 KO mice (three sections per mouse). (e) Expression of Mart1, Cathepsin K, Pmel, and Tyrp1 mRNA was assessed by qRT-PCR. Mean +- SEM; n = 3 mice/group; *, P < 0.05. (f) Expression of alpha-SMA, Mart1, p-rpS6, and total rpS6 protein was assessed by Immunoblot. (g) Expression of the indicated proteins in three distinct human angiomyolipoma (AML) samples was assessed by immunohistochemistry. Arrows indicate the microhamartoma. Bar, 100 um unless otherwise indicated. Insets show higher magnification of the lesions indicated with squares.

- Submitted by
- Invitrogen Antibodies (provider)
- Main image

- Experimental details
- Figure 3. Mosaic- Tsc1 KO mice develop renal H-caldesmon + mesenchymal lesions containing CD31 + endothelial cells and PDGFRbeta + /alphaSMA + pericytes. (a and b) Kidney tissues were isolated from ctrl and mosaic- Tsc1 KO mice at 6 wk of age and analyzed by immunofluorescence for H-caldesmon and CD31 (a) or PDGFRbeta and alphaSMA (b). Arrows in b indicate PDGFRbeta- and alphaSMA-double-positive pericytes. (c) Expression of beta-gal and vimentin on kidney sections from Ctrl;R26-floxstop-LacZ and mosaic- Tsc1 KO;R26-floxstop-LacZ mice was assessed by immunofluorescence. Arrows indicate beta-gal + cells and arrowheads show beta-gal negative cells. Insets show higher magnification of tissue indicated with squares. Similar stainings were found in three different mice/genotype (three sections per each mouse). Bars: (A-C) 100 um.

- Submitted by
- Invitrogen Antibodies (provider)
- Main image

- Experimental details
- Figure 4. YAP is up-regulated by mTOR in renal lesions of mosaic- Tsc1 KO mice and human angiomyolipoma. (a and b) Expression of indicated genes was determined by qRT-PCR (a) and immunoblot analysis (b) in kidney samples from Ctrl mice treated with placebo, mosaic- Tsc1 KO mice treated with placebo, or temsirolimus. Mice were injected i.p. with vehicle or temsirolimus (5 mg/kg) every other day for 2 wk before sacrifice. Mice were sacrificed at 6 wk of age. Mean +- SEM; n = 3 mice/group; *, P < 0.05, **, P < 0.01. (c) Expression of indicated proteins was analyzed by immunoblot in nuclear and cytoplasmic protein extractions from ctrl and mosaic- Tsc1 KO mouse kidney samples. Similar results were found in three different mice/genotype. (d) YAP expression was assessed on kidney sections from ctrl and mosaic- Tsc1 KO mice by immunohistochemistry. Arrows indicate cells with YAP nuclear localization. Bars, 100 um. Similar stainings were found in three different mice/genotype (three sections per each mouse). (e) Expression of indicated proteins was analyzed by immunoblot in control human kidney and angiomyolipoma samples. (f and g) YAP expression was analyzed by immunohistochemistry on human angiomyolipoma samples (N, normal kidney; T, Tumor). Arrows indicate cells with YAP nuclear localization. Bars, 100 um. Insets show higher magnification of the lesions indicated with squares. Similar results were found in 7/7 different human angiomyolipoma samples.

- Submitted by
- Invitrogen Antibodies (provider)
- Main image

- Experimental details
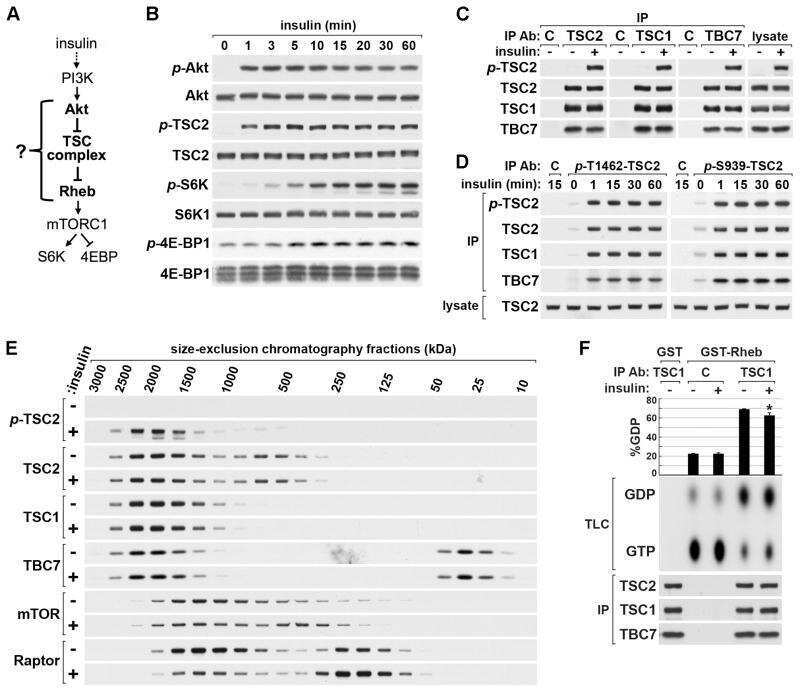
- Figure 2 Affinity purification of R2TP/PFDL subunits reveals interactors. ( a ) Diagram of the network of high-confidence interactions formed around the R2TP/PFD complex. Solid lines denote interactions with a FDR lower than 0.1 while dashed lines are interactions of relevance in this network with FDR scores higher than 0.1, but lower than 0.2 ( Supplementary Data 1 ). Green-coloured nodes are tagged subunits used in this experiment. ( b ) CoImmunoprecipitation (CoIP) of FLAG-tagged subunits of the R2TP/PFD-like complex (RPAP3 and URI1) in HeLa S3 cells. Various Western blots were made to detect endogenous or recombinant proteins, as marked to the right. ( c ) Outline of the splicing cycle with emphasis on the recycling steps of the U5 snRNP and its reintegration within the U4/U6.U5 tri-snRNP (inner loop). ( d ) Regulation of the TORC1 kinase complex by TSC1-TSC2 (annotated here as 'TSC'). Guanine nucleotides (GTP, GDP) and phosphate groups (P) are indicated in green or red, depending on whether they have an activating or inhibitory effect on their associated proteins, respectively.

- Submitted by
- Invitrogen Antibodies (provider)
- Main image

- Experimental details
- Immunoprecipitation of TSC1 was performed on HAP1 cell lysates. Antibody-bead conjugates were prepared by adding 2 µg of TSC1 monoclonal antibody (Product # 370400) with 30 µL of protein G-Sepharose beads and rocked overnight at 4°C. 1 mg of lysate was incubated with an antibody-bead conjugate for 2 hours at 4°C. Following centrifugation and multiple washes, 10% starting material (SM), 10% unbound fraction (UB) and immunoprecipitated fraction (IP) were processed for immunoblot using a different antibody (Product # PA5-116079). Ponceau stained transfer of blot is shown. Data courtesy of YCharOS Inc., an open science company with the mission of characterizing commercially available antibodies using knockout validation.

- Submitted by
- Invitrogen Antibodies (provider)
- Main image

- Experimental details
- Figure 4. Pharmacological inhibition of PLK1 induces apoptosis in hamartin and tuberindeficient cells and attenuates autophagy. ( A ) Phase contrastmicrographs of hamartin deficient 208-P2 MEF and hamartin re-expressing 208-T3 MEFtreated with vehicle control (DMSO) or 30 nM BI-2536 for 3 days. Scale bar400 mum. ( B ) Tuberin deficient ELT3-V3 and tuberin re-expressingELT3-T3 cells were treated with vehicle control (DMSO), 30 nM BI-2536, or20 nM rapamycin for 1, 2 and 3 days, and lysates were immunoblotted withthe indicated antibodies. Asterisk (*) on tuberin immunoblot indicates anon-specific band identified on rat species with the anti-tuberin antibody used, andwas previously described. 50 ( C ) WI38 primary fibroblasts ectopically expressing GFP-LC3 weretreated with vehicle control (DMSO), 20 nM rapamycin, or 100 nM BI-2536for 24 hours, fixed, and the number of GFP-LC3 punctae per nucleus wasquantified from epi-fluorescence digital micrographs. n >= 9,** and *** indicate P < 0.01 and P < 0.001, respectively, compared to DMSO. ( D )HEK293 cells were pre-treated for 24 hours with 0.1% v/v DMSO, or100 nM BI-2536, or 70 ng/ml nocodazole, media were removed, cellmonolayers were washed twice with HBSS, incubated for the indicated time with HBSSin the presence of pre-treatment compounds, lysed, and lysates were immunoblottedfor p62 and beta-actin. The p62 / beta-actin ratios (normalized for the 0 htime-point within each treatment group) are shown below the p62 immunoblots and atth

- Submitted by
- Invitrogen Antibodies (provider)
- Main image
- Experimental details
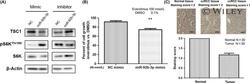
- MicroRNA (miR)-92b-3p regulates the mTOR signaling pathway by targeting TSC1 , and TSC1 is downregulated in clear cell renal cell carcinoma (ccRCC) specimens compared to adjacent normal tissues. A, Representative images of western blot analysis from 3 independent experiments showing the protein levels of TSC1 and p 70S6K(Thr389) and S6K in ACHN cells transfected with miR-92b-3p mimic, or a negative control (NC) miRNA mimic, and also in Caki-2 cells transfected with miR-92b-3p inhibitor, or NC miRNA inhibitor. B, Proliferation assay of ACHN cells transfected with a miR-92b-3p mimic or NC mimic after 96 h incubation with either everolimus or vehicle control (0.1% DMSO). Values are means +- SD of 3 independent experiments. Comparison was carried out by unpaired Student's t test. ** P < .01. C, Representative images of immunohistochemical staining for TSC1 in ccRCC tissues and normal tissues. Paired tissues (30 samples of each) were examined and TSC1 staining intensity was classified into 2 levels: weak = 1 and moderate = 2. Mean scores of normal tissues and ccRCC tissues are shown in the bar graph. Scale bar = 100 mum

- Submitted by
- Invitrogen Antibodies (provider)
- Main image
- Experimental details
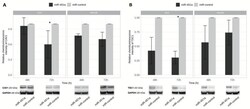
- Figure 9 CAV1 and TSC1 proteins level changes after exogenous up-regulation of miR-451a expression. CAV1 ( A ) and TSC1 ( B ) protein expression comparison 48 h and 72 h after transfection in AGS and MKN28 cell cultures transfected with miR-451a and miR-control. Significant CAV1 and TSC1 proteins' level decrease was determined 72 h after transfection in AGS cell culture. Representative pictures of CAV1 and TSC1 proteins signals detected by Western Blot presented at the bottom of a figure (* p < 0.05). Data from three independent experiments.
