Explore
 Validate
 Learn
Learn Western blot
Antibody data
- Antibody Data
- Antigen structure
- References [1]
- Comments [0]
- Validations
- Western blot [1]
- Immunocytochemistry [1]
- Other assay [1]
Submit
Validation data
Reference
Comment
Report error
- Product number
- MA5-15208 - Provider product page

- Provider
- Invitrogen Antibodies
- Product name
- Phospho-STAT3 (Ser727) Monoclonal Antibody (E.35.9)
- Antibody type
- Monoclonal
- Antigen
- Synthetic peptide
- Description
- It is not recommended to aliquot this antibody.
- Antibody clone number
- E.35.9
- Concentration
- 5833 µg/mL
Submitted references Differential responses to folic acid in an established keloid fibroblast cell line are mediated by JAK1/2 and STAT3.
McCann KJ, Yadav M, Alishahedani ME, Freeman AF, Myles IA
PloS one 2021;16(3):e0248011
PloS one 2021;16(3):e0248011
No comments: Submit comment
Supportive validation
- Submitted by
- Invitrogen Antibodies (provider)
- Main image

- Experimental details
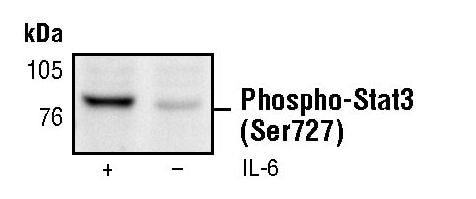
- Western blot analysis of Phospho-STAT3 pSer727 in extracts from serum-starved HeLa cells, untreated or IL-6-treated (100 ng/mL), using Phospho-STAT3 pSer727 monoclonal antibody (Product # MA5-15208).
Supportive validation
- Submitted by
- Invitrogen Antibodies (provider)
- Main image
- Experimental details
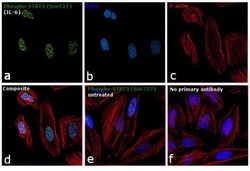
- Immunofluorescence analysis of Phospho-STAT3 (Ser727) was performed using 70% confluent log phase HeLa cells treated with 100 ng of IL-6 for 30 minutes. The cells were fixed with 4% paraformaldehyde for 10 minutes, permeabilized with 0.1% Triton™ X-100 for 15 minutes, and blocked with 1% BSA for 1 hour at room temperature. The cells were labeled with Phospho-STAT3 (Ser727) Mouse Monoclonal Antibody (Product # MA5-15208) at 1:200 dilution in 0.1% BSA, incubated at 4 degree Celsius overnight and then labeled with Goat anti-Mouse IgG (H+L)/IgM (L) Superclonal™ Secondary Antibody, Alexa Fluor® 488 conjugate (Product # A28175) at a dilution of 1:2000 for 45 minutes at room temperature (Panel a: green). Nuclei (Panel b: blue) were stained with SlowFade® Gold Antifade Mountant with DAPI (Product # S36938). F-actin (Panel c: red) was stained with Rhodamine Phalloidin (Product # R415, 1:300). Panel d represents the merged image showing nuclear localization. Panel e shows untreated cells with less intensity of the signal. Panel f represents control cells with no primary antibody to assess background. The images were captured at 60X magnification.

Supportive validation
- Submitted by
- Invitrogen Antibodies (provider)
- Main image

- Experimental details
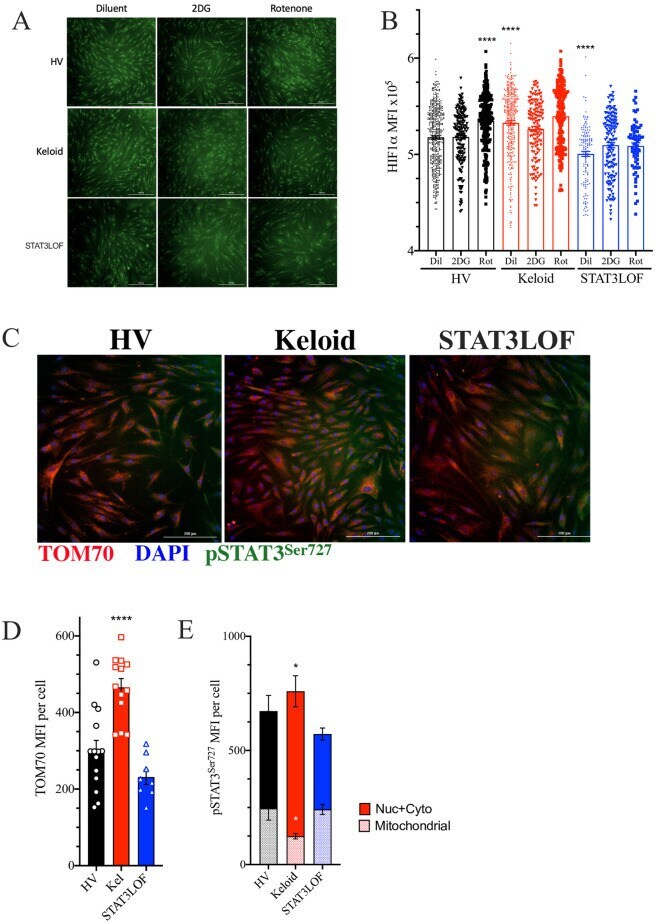
- 10.1371/journal.pone.0248011.g003 Fig 3 Keloid fibroblasts have alterations in transcriptional regulators of metabolism. (A and B) Immunofluorescent (IF) representative images (A) and quantitation of HIF1alpha staining signal co-occurring with DAPI nuclear marker in each identified cell line (B), DAPI not shown to allow nuclear localization assessment. (C) Representative IF images for cells stained for TOM70 (red), phosphorylated STAT3 Ser727 (pSTAT3 Ser727 ; green), and DAPI (blue). (D and E) Signaling intensity for TOM70 (D) as well as pSTAT3 Ser727 associated with TOM70 (mitochondrial) or not associated with TOM70 (nuclear and cytoplasmic; Nuc + Cyto) (E) per cell. Results are representative of two independent experiments and displayed as mean +- SEM for triplicate wells per condition. * = p